A
LICJAF
ILUS1, M
AREKM
ĘDRAŚ1, 2, A
NNAT
RZMIEL−B
IRA1,
J
USTYNAK
ULICZKOWSKA−P
ŁAKSEJ1, D
IANAJ
ĘDRZEJUK1Changes in Bone Mineral Density with Age
in Polish Urban Males*
Zmiany gęstości mineralnej kości w procesie starzenia się mężczyzn
z polskiej populacji wielkomiejskiej
1Department of Endocrinology, Diabetology and Isotope Treatment, Wroclaw Medical University, Poland
2Department of Sports Medicine, University School of Physical Education, Wroclaw, Poland
Adv Clin Exp Med 2009, 18, 4, 369–379 ISSN 1230−025X
ORIGINAL PAPERS
© Copyright by Wroclaw Medical University
Abstract
Background.Age−related bone mineral density (BMD) loss is observed in both middle aged men and middle aged
women.
Objectives. The aim was to evaluate changes in BMD at the femoral neck (FN) and the lumbar spine (L2–L4) in
men of a Polish metropolitan population.
Material and Methods. A population−based sample of 466 randomly selected men aged 25–65, residents of
Wroclaw, Poland, participated in the study. Densitometric measurements were performed using dual−energy X−ray
absorptiometry (DXA). BMD (g/cm2) and T−scores were determined.
Results. BMD in the FN and L2–L4 differed significantly among the age groups and correlated significantly and
negatively with age. The mean annual BMD decrease was 0.3% at the FN and 0.1% at L2–L4. Statistically signif− icant BMD reductions were observed in the FN in the 4th and in L2–L4 in the 4th and 6th decades of life. BMD was 10% higher at the FN and 5% at L2–L4 in men 30–39 than in those 60–65 years old. The prevalence of the
WHO criteria for osteoporosis (T−score ≤–2.5) and osteopenia (–2.5 < T−score ≤–1) was 4.6% and 18.8%, respec−
tively, in the study population. Osteoporosis was found in 1% of 30–39, 6% of 40–49, 6% of 50–59, and 8% of 60–65 year olds at the lumbar spine and in 1% of 30–39, 1% of 50–59, and 12% of 60–65 year olds at the FN. Osteopenia was detected in 22% of 25–29, 15% of 30–39, 12% of 40–49, 24% of 50–59, and 22% of 60–65 year olds at L2–L4 and in 28% of 25–29, 20% of 30–39, 42% of 40–49, 39% of 50–59, and 36% of 60–65 year olds at the FN.
Conclusions. The BMD reduction that occurred with age in Polish men was greater at the femoral neck than the
lumbar spine and appeared at about the fourth decade of life. Its rate was similar to that described for white
Americans and slightly lower than in the Arabic, Asian, and Northern European populations (Adv Clin Exp Med
2009, 18, 4, 369–379).
Key words:bone mineral density, aging, men.
Streszczenie
Wprowadzenie. U mężczyzn, podobnie jak u kobiet, począwszy od wieku średniego obserwuje się związany
z wiekiem spadek gęstości mineralnej kości.
Cel pracy. Ocena zmian gęstości mineralnej kości (BMD) w zakresie szyjki kości udowej (FN) oraz części lędź−
wiowej kręgosłupa (L2–L4) z wiekiem u mężczyzn z polskiej populacji wielkomiejskiej.
Materiał i metody. W badaniach populacyjnych i przekrojowych wzięła udział losowo wybrana populacja próbna
466 mężczyzn – mieszkańców Wrocławia w wieku od 25 do 65 lat. Pomiary densytometryczne szyjki kości udowej (FN) i części lędźwiowej kręgosłupa (L2–L4) wykonano metodą DXA (absorpcjometria wiązki promieniowania rent−
genowskiego o dwóch różnych energiach (DXA, Lunar DPX+, USA). Określono wartość BMD (g/m2) i T−score.
Wyniki. Średnie wartości BMD w zakresie FN i L2–L4 były istotnie różne w grupach wiekowych mężczyzn i zna−
miennie oraz ujemnie korelowały z wiekiem. Roczny spadek BMD wynosił 0,3% w zakresie FN i 0,1% w zakre− sie L2–L4. Uchwytną statystycznie zmniejszenie L2–L4 BMD odnotowano około 4, a FN BMD około 4. i 6. de−
The analysis of many scientific publications has shown that loss of bone mass is an inseparable part of aging in men [1–5]. This is also demon− strated by the increases in the osteoporosis coeffi− cient and osteoporotic fractures, which are likely to become more frequent with age and the enlarge− ment of the elderly population. It has also been demonstrated that the aging process changes the predicative values for different risk factors influ− encing the reduction in bone mineral density (BMD). The most important factor of fracture risk is more often to be connected with age [1–3].
Based on the outcomes of a number of popu− lation studies it can be demonstrated that bone mass loss has different dynamics and scope depending on the population [6–12]. Most data on the aging of the skeleton were obtained in studies of women. The present study was intended to con− tribute to the wealth of knowledge in this area regarding the male population.
The aim of the study was to assess the age− related changes in bone mineral density at the lumbar spine (L2–L4) and femoral neck (FN) in a population of Polish men, inhabitants of Wroclaw. The defined goals were: 1) evaluate BMD changes in different age groups of men, 2) BMD changes during a given unit of time (1 year), 3) determine the period of life of men in which the changes in BMD become statistically significant, 4) determine the difference in BMD in younger (30–39 years old) and older men (60–65 years old), and 5) determine the percentages of men diagnosed on the basis of densitometric criteria developed by the WHO based on T−score for osteopenia (–2.5 < T−score ≤–1) and osteoporosis (T−score ≤–2.5) in the particular age groups.
Material and Methods
Study Design
The following is a population−based cross−sec− tional study of men from a metropolitan popula−
tion. It was conducted within the framework of investigative project no. 2P05D11226 sponsored by the State Committee for Scientific Research (KBN), Poland. The Ethics Committee of the Wroclaw Medical University approved the study’s protocol (Bioethical Commission Opinion no. KB− 180/2006).
Characteristics
of the Study Population
Four hundred sixty−six men aged from 25 to 65 (mean age: 46.9 years), inhabitants of Wroclaw, Poland, participated in this study. This group of respondents was selected from 900 men identified using a layered scheme of drawing lots from a group of men randomly selected in 2000 by the Information Center of the Lower Silesia Regional Office in Wroclaw. Age was the only criterion according to which the subjects were selected. Exclusion criteria were lack of written consent to participate in the study or statements in the interview indicating serious disruption of endocrine glands or the use of testosterone substitution therapy.
On individual invitation, 466 men reported for the study, representing 51.8% of the 900 invited. The subjects were admitted to the study after receiv− ing comprehensive information on the method and assumptions of the study and provided written informed and voluntary consent to participate in it. A medical interview regarding past and recent med− ical history of physical disabilities, including the prevalence of chronic diseases in the family, current medication, and the use of drugs, alcohol, and tobacco, was recorded for every patient. This inter− view was enriched by data related to education, pro− fession, and lifestyle. Of the study population: 44.2% had higher education and 55.68% primary and secondary education; 63.53% were employed and 19.95% had the status of pensioner; 7.3% had no diagnosed chronic disease and did not suffer from any health problems. The most commonly reported chronic diseases were circulatory and loco−
kady życia badanych mężczyzn. BMD była większa o 10% w FN i o 5% w L2–L4 u mężczyzn 30–39−letnich w po− równaniu do mężczyzn 60–65 letnich. W całej badanej populacji odsetek rozpoznanej na podstawie kryteriów
WHO osteoporozy (Tscore ≤–2,5) wynosił 4,6%, a osteopenii (–2,5 < Tscore ≤–1) 18,8%. W poszczególnych gru−
pach wiekowych w zakresie L2–L4 osteoporozę wykazano u 1% mężczyzn 30–39−letnich, 6% 40–49−letnich, 6% 50–59−letnich i 8% 60–65−letnich, a w zakresie FN 1% u mężczyzn 30–39−letnich, 1% 50–59−letnich i 12% 60–65− −letnich. Osteopenię wykryto w zakresie L2–L4 u 22% mężczyzn 25–29 letnich, 15% 30–39 letnich, 12% 40–49− −letnich, 24% 50–59−letnich i 22% 60–65−letnich, a w zakresie FN u 28% 25–29−latków, 20% 30–39−latków, 42% 40–49−latków, 39% 50–59−latków i 22% 60–65−latków.
Wnioski. Towarzyszące procesowi starzenia się mężczyzn polskich zmniejszenie BMD było większe w zakresie
FN niż L2–L4 i występowało już około 4. dekady życia. Tempo było zbliżone do wartości opisywanych dla Ame− rykanów rasy białej i nieznacznie mniejsze w porównaniu z populacją arabską, azjatycką oraz północnej Europy
(Adv Clin Exp Med 2009, 18, 4, 369–379).
motor system diseases. In the group of cardiovascu− lar diseases the most common were: high blood pressure (21.24%), ischemic heart disease (9.44%), myocardial infarction (5.15%), varicose veins of the lower limbs (3.43%), valve defects (2.14%), and arrhythmia (1.9%). Degenerative diseases (20.60%) were dominant among skeleton diseases, including spondyloarthropathy and peripheral joint arthrosis. Respondents were undergoing treatment because of injuries (14.9%), hypertrophy of the prostate (5.58%), allergies (4.72%), nephrolithiasis (4.51%), lipid disorders (4.51%), type 2 diabetes mellitus (4.08%), liver diseases (3.65%), gastric and duode− nal ulcers (3.43%), migraine (3.22%), mental disor− ders (2.79%), and asthma (2.57%). The prevalence of other conditions mentioned by the subjects, such as cancer, stroke, and irritable bowel syndrome, was less than 2%. Headache and pain associated with pathology of the bone−join system, digestive sys− tem, and sense organs were the most frequently reported symptoms. 55.8% of the men were not receiving any drugs, while 47.2% were being treat− ed pharmacologically with different preparations
and 0.6% were using psychotropic drugs. 5.15% of the men declared no use of drugs of any kind. 25.9% reported alcohol consumption, of whom 1.5% declared frequent alcohol consumption. Abstinence was declared by 74.1% of the men. 58.15% declared that they smoked cigarettes, 24.03% at the time of the survey but not in the past, and 17.81% regularly smoked tobacco. Of all the respondents, only 1 man admitted to drug use.
Besides the basic sociodemographic character− istic, a detailed physical examination was carried out to measure blood pressure and assess anthropo− metric indicators such as weight, height, and waist and hip circumferences. Body mass index (BMI, body−mass [kg]/height [m2]) and the waist−to−hip
ratio (WHR, waist−circumference [cm]/hip−cir− cumference [cm]) were calculated for each partici− pant. Densitometric measurements were also car− ried out. Final results of the BMD measurements of the lumbar spine were obtained for 459 men and of the neck of the femur for 462. The population was divided into five age categories (Table 1): 25–29, 30–39, 40–49, 50–59, and 60–65 years old.
Age groups – years (Grupy wiekowe – lata)
Total 25–29 30–39 40–49 50–59 60–65
N 466 36 119 91 115 105
Height – cm ***a
(Wzrost – cm)
Mean (Średnia) 175.84 179.58 179.10 176.97 174.67 171.17
SD 6.95 5.78 6.73 5.17 6.62 6.35
Weight – kg ***
(Masa ciała – kg)
Mean (Średnia) 84.1 77.2 83.1 85.5 87.0 83.4
SD 13.6 10.5 13.2 12.6 14.7 13.5
BMI (kg/m2) ***
Mean (Średnia) 27.22 23.96 25.91 27.24 28.48 28.41
SD 4.17 3.38 3.86 3.53 4.33 4.12 Waist circumference – cm ***
(Obwód talii – cm)
Mean (Średnia) 96.97 88.03 92.25 97.41 100.79 100.80
SD 11.42 7.73 9.81 9.70 11.99 11.44
Hip circumference – cm *** (Obwód bioder – cm)
Mean (Średnia) 101.19 96.39 98.82 101.57 102.86 103.36
SD 8.49 8.79 7.26 7.56 9.25 8.41
WHR ***
Mean (Średnia) 0.96 0.92 0.93 0.96 0.98 0.97
SD 0.071 0.059 0.068 0.066 0.072 0.069
Tabela 1.Charakterystyka kliniczna badanych mężczyzn w grupach wiekowych Table 1. Clinical characteristic of the examined men in age groups
*** athe feature is significantly (p< 0.01) different in the different age groups (ANOVA).
SD – standard deviation.
The Measurement
of Bone Mineral Density
BMD measurements were performed at the Department of Nuclear Medicine of the Endocri− nology, Diabetology, and Isotope Treatment Clinic in Wroclaw using dual−energy X−ray absorptiome− try (DXA, Lunar DPX+; Lunar Corp, Madison, WI, USA). The sites measured were the proximal femur (femoral neck – FN) and the lumbar spine (L2–L4). The coefficients of variation (CV%) obtained were 0.89% for the lumbar spine and 1.25% for the femoral neck. The results of densit− ometry are expressed in g/cm2and standard devia−
tions (T−score) compared with the peak bone mass of young adults.
Statistical Analysis
All statistical calculation was performed using STATISTICA v. 6.0 (Statsoft). Correlation between two characteristics was evaluated using the linear Pearson’s correlation coefficient. A value of p < 0.05 was considered statistically significant. In some cases it was useful to give a value of 0.05 < p< 0.1 as the limit of statistical significance. Student’st test, analysis of variance test (ANOVA), Tukey’s test of multiple compar− isons (post−hoc) tested the significance of correla− tion coefficients. The relationships between para− meters were determined by a linear regression model. Regression analysis included tests of the significance of the regression coefficients (Student’stand ANOVA).
Results
Clinical Evaluation of the Men
Statistically significant differences in height, weight, waist and hip circumference, WHR, and BMI were found among the age groups of men (p < 0.01, ANOVA). The clinical data of all the par− ticipants are shown in Table 1.
BMD of L2–L4 and the FN
in the Age Groups
and Its Connection with Age
The mean BMD of the subjects was 1.25 ± ± 0.18 g/cm2at L2–L4 and 1.00 ± 0.14 g/cm2at the
FN. There were statistically significant differences between the different age groups of men (p< 0.001,
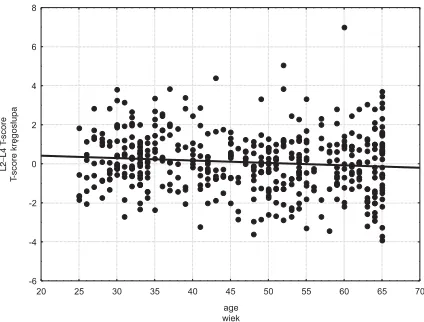
ANOVA). A statistically significant negative cor− relation was found between BMD of the FN and L2–L4 and the age of the examined men (p< 0.001). Table 2 compares the average values of BMD and T−score in the age groups and Table 3 the correla− tion coefficients of BMD and T−score with age. Figures 1–4 illustrate the correlations of BMD at L2–L4 and the FN and T−score with age.
Age Groups which Showed
Statistically Significant Changes
in BMD at the FN and L2–L4
Based on Tukey’s test of multiple compar− isons, the following information was found in the examined population: at L2–L4, two age groups, 40–65 and 25–39 years old, differed significantly in BMD. The older group had lower BMD at L2–L4. A statistically significant change in L2–L4 BMD was observed about the 4th decade of life in the examined men; at the FN, three age groups of men, 60–65, 40–59, and 25–39 years old, differed significantly in BMD, the older age group having lower BMD at the FN. A statistically significant change in FN BMD was observed around the 4th, then the 6th decade of live in the examined men.
The results of the Tukey’s multiple compari− son test are summarized in Table 2.
Changes in BMD at L2–L4
and the FN in Units of 1 Year
On the basis of a regression model it can be assumed that the statistically significant reduction in BMD with age was greater at the FN than at L2–L4. The annual decrease in BMD was 0.0033 g/cm2 (0.3%) at the FN (p < 0.01) and 0.0017
g/cm2(0.1%) at L2–L4 (p< 0.01). A single regres−
sion model is shown in Table 4.
Differences in BMD
at L2–L4 and the FN Between
Men 30–39 Years Old
and Older, for Example 60–65
Age groups – years (Grupy wiekowe – lata)
total 25–29 30–39 40–49 50–59 60–65
L2–L4 BMD (g/cm2) ***a
N 459 36 118 89 113 103
Mean (Średnia) 1.25 1.25 Bb 1.30 B 1.23 Ab 1.22 A 1.23 A
SD 0.18 0.16 0.17 0.17 0.18 0.20 FN BMD (g/cm2) ***
N 461 36 118 88 115 104
Mean (Średnia) 1.00 1.06 C 1.04 C 0.99 B 0.98 B 0.95 A
SD 0.14 0.13 0.13 0.15 0.12 0.15
L2–L4 T−score ***
N 459 36 118 89 113 103
Mean (śŚrednia) 0.082 0.050 A 0.475 B –0.056 A –0.152 A 0.019 A
SD 1.516 1.326 1.383 1.363 1.489 1.795
FN T−score ***
N 462 36 118 89 115 104
Mean (Średnia) –0.57 –0.079 Cb –0.20 C –0.65 B –0.69 B –0.98 A
SD 1.07 1.00 1.01 1.05 0.96 1.10 Table 2.Mean BMD values and T−scores at the femoral neck and lumbar spine in the age groups of men. Analysis of vari− ance test. Tukey’s tests of multiple comparisons (post hoc)
Tabela 2.Średnie wartości BMD i wskaźnika T−score dla kręgosłupa lędźwiowego i szyjki kości udowej w poszczególnych grupach wiekowych mężczyzn. Test analizy wariancji ANOVA. Testy porównań wielokrotnych Tukeya
*** afeature is very significantly (p< 0.001) different in the different age groups. (ANOVA).
bDivision into homogeneous groups according to Tukey’s test. Homogeneous group are marked with the same letter (A, B…). The sequence of letters corresponds to the ascending order of mean values in the groups.
*** acecha jest bardzo istotnie (p < 0,001) różna w różnych grupach wiekowych (test ANOVA).
bPodział na grupy jednorodne wg testu Tukeya. Grupy jednorodne są oznaczone tą samą literą A,B,… Kolejność liter odpowiada rosnącemu porządkowi średnich w grupach.
Age groups – years (Grupy wiekowe – lata)
total 25–29 30–39 40–49 50–59 60–65
466 36 119 91 115 105
L2–L4BMD All correlations are significant p < 0.001
Correlation 0.9800 1.0000 1.0000 0.9510 0.9976 0.9635
(Korelacja)
FN BMD All correlations are significant p < 0.001
Correlation 0.9683 1.0000 0.9999 0.8905 0.9978 0.9704
(Korelacja)
Table 3. Pearson’s correlation coefficient of BMD at the lumbar spine (L2–L4) and femoral neck (FN) and T−score related to the age groups of the men
Tabela 3.Współczynniki korelacji Pearsona BMD w obrębie kręgosłupa lędźwiowego i szyjki kości udowej oraz T−score z wiekiem badanych mężczyzn
L2–L4 – lumbar spine. FN – femoral neck.
The Occurrence of Osteopenia
and Osteoporosis Determined
on The Basis of Densitometric
Criteria Based on T−Score
in the Whole Group
and the Age Groups
In the assessment of BMD in the men who participated in the study, the WHO criteria for osteoporosis based on T−score, in units of the stan− dard deviation of the mean results for peak bone mass in people aged 20–29 years, was adopted. A T−score ≤ –2.5 signifies osteoporosis, –2.5 < < T−score ≤–1.0 osteopenia (low bone mass), and T−score > –1 is normal.
In the study population of men, regardless of age, T−score values fulfilling the criteria for osteo−
porosis and osteopenia were found in 21 (4.6%) and 87 (18.8%), respectively. There were no men in the youngest group (25–29) with osteoporosis in the FN and L2–L4 regions. In the other age groups, osteoporosis at L2–L4 was diagnosed in 1 person (1%) in the group of 30–39 year olds, in 5 (6%) of the 40–49 year olds, in 7 (6%) of the 50–59 year olds, and in 8 (8%) of the 60–65 year olds. There was no FN osteoporosis in men aged 40–49. It was detected in 1 (1%) of the 30–39 year−olds, 1 (1%) of the 50–59 year olds, and 12 (12%) of the 60–65 year olds. Osteopenia at L2–L4 was diagnosed in 8 (22%) of the 25–29 year olds, 18 (15%) of the 40–49 year olds, 27 (24%) of the 50–59 year olds, and 23 (22%) of the 60–65 year olds. Osteopenia at the FN was observed in 10 (28%) of the 25–29 year olds, 24 (20%) of the 30–39 year olds, 37 (42%) of the 40–49 year olds, 44 (39%) of the 50–59 year olds,
Fig. 1. Correlation between BMD at the femoral neck
and age
Ryc. 1.Korelacja między BMD w zakresie szyjki
kości udowej a wiekiem badanych mężczyzn
20 25 30 35 40 45 50 55 60 65 70
age wiek 0,5
0,6 0,7 0,8 0,9 1,0 1,1 1,2 1,3 1,4 1,5 1,6
FN BMD
BMD szyjki
Fig. 2.Correlation between T−score at the femoral
neck and age
Ryc. 2.Korelacja między T−score szyjki kości udowej
a wiekiem badanych mężczyzn
20 25 30 35 40 45 50 55 60 65 70 -4
-3 -2 -1 0 1 2 3 4
age wiek
FN
T-score szyjki
T-score
Fig. 3.Correlation between BMD at the lumbar spine
and age
Ryc. 3.Korelacja między BMD w zakresie kręgosłupa
lędźwiowego a wiekiem badanych mężczyzn
20 25 30 35 40 45 50 55 60 65 70 0,6
0,8 1,0 1,2 1,4 1,6 1,8 2,0
age wiek
L2–L4 BMD
BMD krêgos³upa
Fig. 4.Correlation between T−score at the lumbar
spine and age
Ryc. 4.Korelacja między T−score kręgosłupa
lędźwiowego a wiekiem badanych mężczyzn
20 25 30 35 40 45 50 55 60 65 70 -6
-4 -2 0 2 4 6 8
age wiek
L2–L4 T
-score
and 37 (36%) of the 60–65 year olds. The numbers and percentages of the men with normal and decreased BMD determined on the basis of T−score are summarized in Table 6.
Discussion
The rate of progressive loss of bone mass with age in different populations differs and depends on a number of not fully known mechanisms [6–12]. It has been shown that black men have a higher bone density and slower pace of loss with age than Caucasian and Asian men [9, 10, 13–15]. In peo− ple of the same race there may also be significant differences in the rate of bone mass loss. The
results of the analysis of densitometric parameters of inhabitants of different regions of Asia showed that the age−dependent decrease in bone density is higher in the Japanese than in Koreans [16]. Tsai S.C. et al. suggested that BMD of the spine in healthy Chinese men aged between 20–92 years was lower not only compared with Caucasian men, but also with Japanese and Korean [17]. The importance of race and ethnicity as the strongest factors determining BMD was also confirmed in the American study NHANES III (Third National Health and Nutrition Examination Survey) con− ducted among older men [18]. Based on their results, differences in BMD between African− American and Caucasus males could be proven; African−Americans had 12% higher bone density at the femoral neck and 6% at the spine than the Caucasians. The increased bone mass in men of African origin possibly decreases the risk of osteo− porotic fracture unassociated with factors such as body weight and lifestyle. This issue is not explained by other, different data obtained in the interview. Instead, Asians had lower BMD than Caucasian men. However, these differences were fully explained by a completely different body mass.
It is estimated that the total loss of bone mass in men with age may amount to 20–30% of its peak value [19]. However, there are large differ− ences depending on the study population. The gradual reduction in bone mass in healthy men starts after completing three decades of life [4, 19, 20]. This is a normal physiological effect marking Intercept Standard errora Age Standard errorb Pc
(Oszacowanie (Błąd standard.a) (Wiek) (Błąd standard.b) wyrazu wolnego)
L2–L4 BMD (g/cm2) 1.32***d 0.033 –0.0017***f 0.00067 0.01***
L2–L4T−score 0.66**e 0.28 –0.012**g 0.0057 0.03**
FN T−score 0.64*** 0.19 –0.026*** 0.0038 0.000***
FN BMD 1.15*** 0.025 –0.0033*** 0.00052 0.000***
Table 4.Linear regression model of BMD at the femoral neck and lumbar spine related to the age
Tabela 4.Równanie regresji gęstości mineralnej kości w części lędźwiowej kręgosłupa i szyjce kości udowej względem wieku
a Standard error of intercept.
b Standard error of regression coefficient at age. c p−value (ANOVA test for significance of regression). ***d Significance level of intercept p < 0.01 (Student’s ttest). **e Significance level of intercept 0.01 ≤ p 0.05 (Student’sttest). ***f Significance level of age coefficient p < 0.01 (Student’s ttest). **g Significance level of age coefficient 0.01 ≤ p < 0.05 (Student’s ttest). a Błąd standardowy oszacowania wyrazu wolnego.
b Błąd standardowy oszacowania współczynnika przy wieku. c p – wartość testu istotności regresji (test ANOVA).
***d Wyraz wolny istotny na poziomie p < 0,01 (test tStudenta). **e Wyraz wolny istotny na poziomie 0,01 ≤ p < 0,05 (test tStudenta). ***f współczynnik przy wieku istotny na poziomie p < 0,01 (test tStudenta). **g Współczynnik przy wieku istotny na poziomie 0,01 ≤ p < 0,05 (test tStudenta).
Age – years L2–L4 BMD FN BMD
(Wiek – lata) (g/cm2) (g/cm2)
30–39 1.30 1.04
60–65 1.23 0.95
Whole groups
(Wszystkie grupy) 1.25 1.00
Relative error of difference
(Błąd względny) 5% 10%
Table 5. Difference in BMD at the lumbar spine and femoral neck in younger men between 30–39 and older men between 60–65 years old
the aging of bones. The loss of BMD at the femoral neck and lumbar spine was observed in the fourth decade of life in the men from Wroclaw. The different age groups differed significantly in terms of BMD in both the lumbar spine and the neck of the femur. The highest BMDs were found in the younger and gradually decreased in the older age groups. BMD in men 60–65 years old was lower that of those 30–39 years old, especial− ly at the femoral neck.
Age−related reduction in BMD was reported in many studies of different populations of men. Riggs et al. observed that BMD in both sexes begins to decline in the middle of the fifth decade of life (the degree depends on the place of mea− surement) [21]. The Krassas et al. study of a Greek population also showed a strong correlation between age and BMD in the neck of the femur, lumbar spine, and Ward triangle [22]. The impor− tance of age as a significant factor determining the degree of bone mineralization in men was stressed in the work of French researchers [23]. Studies of a Polish population of healthy men aged 50–83 carried out by Purzycka−Jazdon et al. also demon−
strated a connection between BMD and age [24]. The results of this study clearly showed that a crit− ical decrease in BMD in the lumbar spine (below the threshold of fracture risk) is common in men over 50. Significant correlation between age and BMD was demonstrated by authors in Taiwan, who reported that in a study population of older healthy Taiwanese, the largest decrease in bone density was recorded in the Ward triangle in men 65–69 years of age [15].
Other publications demonstrated that, in con− trast to women, who have a particularly intense acceleration of bone loss in the first 10 years after menopause, the decrease in BMD in men re− mained stable up to 70 years of age and increased at a later period [1]. Examples include a study of an older Brazilian population in which a signifi− cant decrease in bone density at the neck of the femur and the entire skeleton in the process of aging was observed only in men 70–79 years old. Furthermore, no significant relationship was found between age and BMD at the lumbar spine [12].
The results of the present densitometric mea− surements showed that the rate of reduction in Age – years Femoral neck (FN) Lumbar spine (L2–L4)
(Wiek – lata) (Szyjka kości osteoporosis osteopenia normal N
udowej) T−score < –2.5 SD –2.5 < T−score < –1.0 T−score > –1.0 SD
25–29 osteoporosis 0 (0%) 0 (0%) 0 (0%) 0 (0%)
osteopenia 0 (0%) 5 (14%) 5 (14%) 10 (28%)
norm 0 (0%) 3 (8%) 23 (64%) 26 (72%)
N 0 (0%) 8 (22%) 28 (78%) 36 (100%)
30–39 osteoporosis 0 (0%) 1 (1%) 0 (0%) 1 (1%)
osteopenia 1 (1%) 9 (8%) 14 (12%) 24 (20%)
norm 0 (0%) 8 (7%) 85 (72%) 93 (79%)
N 1 (1%) 18 (15%) 99 (84%) 118 (100%)
40–49 osteoporosis 0 (0%) 0 (0%) 0 (0%) 0 (0%)
osteopenia 5 (6%) 7 (8%) 25 (28%) 37 (42%)
norm 0 (0%) 4 (4%) 48 (54%) 52 (58%)
N 5 (6%) 11 (12%) 73 (82%) 89 (100%)
50–59 osteoporosis 0 (0%) 1 (1%) 0 (0%) 1 (1%)
osteopenia 7 (6%) 17 (15%) 20 (18%) 44 (39%)
norm 0 (0%) 9 (8%) 59 (52%) 68 (60%)
N 7 (6%) 27 (24%) 79 (70%) 113 (100%)
60–65 osteoporosis 6 (6%) 6 (6%) 0 (0%) 12 (12%)
osteopenia 2 (2%) 13 (13%) 22 (21%) 37 (36%)
norm 0 (0%) 4 (4%) 50 (49%) 54 (52%)
N 8 (8%) 23 (22%) 72 (70%) 103 (100%)
Total 21 87 351 459
(Suma)
BMD with age in men may also differ depending on the population. This was also shown in the high−quality data obtained from the NEMO studies (Network in Europe for Male Osteoporosis), which found geographical diversity in the rate changes in BMD in both sexes aged 50–86 years representing various European populations [7].
However, the loss of bone mass is usually slow and steady over lifetime in men. It has been calculated that its volume is on average from 0.3 to 0.5% per year [19]. According to other data, the rate of reduction of bone mass in men ranges from 5 to 10% for every 10 years of age [4]. It was observed that the trabecular bone, due to its greater surface and metabolic activity, is more vulnerable to the disorder, which is associated with large structures, than cortical bone [20, 25]. In the cur− rent study of the Wroclaw male population, BMD loss in the lumbar spine averaged 0.0017 g/cm2
(0.1%) per year and in the neck of the femur 0.0033 g/cm2(0.3%) per year. Similar changes in
bone mineral density were obtained by Scopacasa et al. using DXA in a group of 123 healthy men aged 20–83 years for a period of 41 months. The average annual decrease in BMD was 0.33 ± ± 0.72% and potentiated with age, particularly after reaching the age of 70 [26]. In the already cited Purzycka−Jazdon et al. study, the rate of change of BMD with age was higher than the present results for the men of Wroclaw (15.2%) per decade [24]. In population studies of Norwegian authors, the average annual declines in BMD in the distal and ultradistal forearm area in men were 0.5% and 0.4%, respectively [27]. The densitometric analy− ses of the distal and proximal part of the radius and the calcaneus of men aged 61–82 conducted by American researchers showed a decrease of in bone density in all these areas from 3.5–6.9% per decade [28]. Maghraoui et al, examining a popula− tion of Moroccans aged 20–79, reported different paces of decline in the degree of bone mineraliza− tion in different parts of the skeleton. As for the densitometric studies of the Wroclaw inhabitants, it was higher in the area of the femoral neck (0.6% per year) and in the lumbar spine (0.3% per year) [29]. For comparison, Saudis aged 20–79 were said to have an annual reduction in BMD in the spinal area of 0.3–0.8% and in the neck of the femur of 0.2–0.7% [30]. Among white Americans, a higher BMD decrease with age was observed in the neck of the femur (0.005 g/cm2/year) than in
the lumbar spine (0.001 g/cm2/year) [31]. These
results are consistent with those of population studies of Wroclaw’s inhabitants.
With age come quantitative and qualitative changes in bone tissue mineral and disorders of its construction in space. This leads to the develop−
ment of osteoporosis, which is one of the most common systemic metabolic diseases and an important health problem of modern times, espe− cially if one considers the aging of the population [32]. So far, osteoporosis has been discussed main− ly in the context of women and was perceived as a major postmenopausal condition. There is a defi− ciency of major epidemiological studies of this problem in men, although, in this case, sex is asso− ciated with a significantly higher morbidity and mortality [20]. In the present study of the Wroclaw male population, the diagnoses of osteoporosis and osteopenia based on the T−score across the sample population were determined in, respective− ly, 4.16% and 1.8% of the men. In the lumbar spine, osteoporosis was diagnosed in 1% of the men 30–39, 6% of those 50–59, and 8% of those 60–65 years old, while in the neck of the femur these figures were 1%, 1%, and 12%, respectively. According to the independent studies by Kamel and Schuit, the incidence of osteoporosis in women was 29% and in men it was less than half as much (12%) [33.34]. In the previously cited NHANES III study, osteoporosis was observed in 3–6% and osteopenia in 28–47% of men [18]. The multiclinical study EVOS in multi−Evos (Euro− pean Vertebral Osteoporosis Study) reported an incidence of osteoporosis in men in Europe of approximately 13% [35]. Based on other data it was estimated that the proportion of men affected by osteoporosis was 13–19% of the population, compared with 34–41% of women affected by this disorder [36]. As already mentioned, in the Krassas study, 1% of Greek men were character− ized by BMD T−scores of less than 2.5 SD[22].
The incidence of osteoporosis in both sexes is affected by a number of factors. Among them is the significant role generally attributed to higher peak bone mass and increased bone volume in men than in women and the slower decline in the level of testosterone as opposed to the sharp reduction in estrogen levels. The shorter average lifespan of men is also not without significance [19, 20].
The observed differences in the results of den− sitometric measurements among populations may result from the absence of clear criteria for identi− fying low bone mass in men. Those which are commonly used were developed for the population of American women and western Caucasians. There are no studies proving that they are applica− ble in men and persons of different ethnic groups [37, 38].
from problems of measurement and standardiza− tion of measurement apparatus. One must also remember that the evaluation of the lumbar spine, because of its location and the fact that it a fre− quent site of degenerative changes. is fraught with considerable error. Therefore, in men aged 60–65 and older, the results of measuring BMD in the lumbar spine using DXA may be overstated due to the productive change in the axial skeleton, which is vulnerable to constant strain. Of the currently available methods for testing the skeleton, only quantitative computed tomography (QCT) pro− vides an opportunity for fully selective measure− ment of trabecular BMD because of its ability for a precise three−dimensional location of the site of study [24, 37, 38].
Although there are many different theories on the pathogenesis of bone loss in men, advanced age as one of the main risk factors associated with low density of bone tissue has been well documented, also in large prospective studies. However, it should be stressed that osteoporosis was once treated as a natural consequence of the loss of bone mass in the process of aging, but nowadays it is not consid− ered only as an affliction related to age. In persons who did not achieve optimum bone mass during childhood, osteoporosis can develop without increased loss of bone mass. In the growing process of this disease, reaching an optimum bone mass is as important as its loss. Studies show that in healthy men, the average rate of physiological loss of bone mass over a period of years is large but does not lead to the development of osteoporosis in all cases. Throughout life a man loses a little less than a half of his bone mass obtained during growth and ado− lescence. However, due to the existence of a num−
ber of factors modifying bone metabolism, and interactions between them, the rate of decline in BMD with age may accelerate, as the physiological acceleration of bone loss occurs in women who have reached the age of menopause. If the reason for this has been explained as far as women are con− cerned, the male issue remains unclear.
The most important predicative factor for achieving and maintaining good bone condition throughout life and for determining the risk of developing osteoporosis and related fractures appears to be the peak bone mass (PBM), which occurs at the approximate age of 30–35 [19, 20, 38]. It has been shown that increasing the PBM by 10% can reduce the risk of fractures by up to 50%. Thus men, like women, with the highest peak bone mass are protected against the development of osteoporosis when the age−related decline in bone density is imminent. Achievement of maximal bone mass early in life is thus a critical opportuni− ty to reduce the impact of age on bone mass reduc− tion [3, 19, 20]. Assuming that PBM is bone acquired until the third decade of life, osteoporosis should be prevented not only when men grow older, but also when very young, i.e. at the time of bone growth when PBM is shaped, and also at 40 years of age so as to maintain bone mass.
The results of the study allow the following conclusions. 1) Reduction in bone mineral density is an inherent part of the aging process of the pop− ulation of Polish men. 2) It is higher in the femoral neck than in the lumbar region of the spine and is already apparent after about four decades of life. 3) The rate is similar to that of Caucasian Americans and slightly lower than that of Arabic, Asian, and Northern European men.
References
[1] Grzegorzewska AE:Changes in bones in the aging males. Pol Merk Lek 2007, 23, 159–160.
[2] Tuck SP, Datta HK:Osteoporosis in the aging male: treatment options. Clin. Interv. Aging 2007, 2, 521–536.
[3] Misiorowski W:Male osteoporosis. Geriatria Pol 2005, 1, 79–83.
[4] Lepiarz−Rusek W, Kokocińska D:Elary, noninvasive diagnostic of osteoporosis in men. Przegl Lek 2005, 62, 641–649.
[5] May H, Murphy S, Khaw K:Age−associated Bone Loss in Men and Women and its Relationship to Weight. Age
Ageing 1994, 23, 235–240.
[6] Araujo AB, Travison TG, Harris SS, Holick MF, Turner AK, McKinlay JB:Race/ethnic differences in bone
mineral density in men. Osteoporos Int 2007, 18, 943–953.
[7] Kaptoge S, Reid DM, Scheidt−Nave C, Poor G, Pols HA, Khaw KT, Felsenberg D, Benevolenskaya LI, Diaz MN,
Stepan JJ, Eastell R, Boonen S, Cannata JB, Glueer CC, Crabtree NJ, Kauffman JM, Reeve J:Geographic
and other determinants of BMD change in European men and women at the hip and spine, a population−based study from the Network in Europe for Male Osteoporosis (NEMO). Bone 2007, 40, 662–673.
[8] Tracy JK, Meyer WA, Grigoryan M, Fan B, Flores RH, Genant HK, Resnik C, Hochberg MC:Racial dif−
ferences in the prevalence of vertebral fractures in older men: the Baltimore Men’s Osteoporosis Study. Osteoporos Int 2006, 17, 99–104.
[9] Tracy JK, Meyer WA, Flores RH, Wilson PD, Hochberg MC:Racial differences in rate of decline in bone mass
in older men: the Baltimore men’s osteoporosis study. J. Bone Miner Res 2005, 20, 1228–1234.
[10] George A, Tracy JK, Meyer WA, Flores RH, Wilson PD, Hochberg MC:Racial differences in bone mineral
density in older men. J Bone Miner Res 2003, 18, 2238–2244.
[11] Yano K, Wasnich RD, Vogel JM, Heilbrun LK:Bone mineral measurements among middle−aged and elderly
[12] Zerbini CAF, Latorre MRO, Jamie PC, Tanaka T, Pippa MGB: Bone mineral density in Brazilian men 50 years and older. Braz J Med Biol Res 2000, 33, 1429–1435.
[13] Lau EM, Lynn H, Woo J, Melton LJ 3rd.:Areal and volumetric bone density in Hong Kong Chinese: a com−
parison with Caucasians living in the United States. Osteoporos Int 2003, 14, 583–588.
[14] Bell NH, Gordon L, Stevens J, Shary JR: Demonstration that bone mineral density of the lumbar spine,
trochanter, and femoral neck is higher in black than in white young men. Calcif Tissue Int 1995, 56,11–13.
[15] Chiu HC, Chen CH, Ho ML, Liu HW, Wu SF, Chang JK:Longitudinal changes in bone mineral density of
healthy elderly men in southern Taiwan. J Formos Med Assoc 2008, 107, 653–658.
[16] Sugimoto T, Tsutsumi M, Fujii Y, Kawakatsu M, Negishi H, Lee MC, Tsai KS, Fukase M, Fujita T: Comparison of bone mineral content among Japanese, Koreans, and Taiwanese assessed by dual−photon absorp− tiometry. J Bone Miner Res 1992, 7, 153–157.
[17] Tsai SC, Kao CH, Wang SJ, ChangLai SP, Yen RF, Chieng PU:Normal data for lumbar spine bone mineral
content in healthy Chinese men. Calcif Tissue Int 1997, 61, 114–116.
[18] Looker AC, Orwell ES, Johnson CC Jr, Lindsay RL, Wahner HW, Dunn WL, Calvo MS, Harris TB, Heyse SP: Prevalence of low femoral bone density in older U.S. adults from NHANES III. J Bone Miner Res 1997, 12, 1761–1768.
[19] Mędraś M: Mineral density of skeletal system and male hypogonadism. In: Andrologia. Eds. Semczuk M,
Kurpisz M. PZWL, Warszawa 2006, 313–317.
[20] Rabijewski M, Papierska L, Zgliczyński W:Pathogenesis, diagnosis and treatment of osteoporosis in men. Pol
Merk Lek 2008, 24, 76–80.
[21] Riggs BL, Wahner HW, Seemann E, Offord KP, Dunn WL, Mazess RB, Johnson KA, Melton LJ 3rd: Changes in bone mineral density of the proximal femur and spine with aging. Differences between the post− menopausal and senile osteoporosis syndromes. J Clin Invest 1982, 70, 716–723.
[22] Krassas GE, Papadopoulou FG, Doukidis D, Konstantinidis TH, Kalothetou K:Age−related changes in bone
density among healthy Greek males. J Endocrinol Invest 2001,24,326–333.
[23] Blain H, Vuillemin A, Blain A, Guillemin F, De Talance N, Doucet B, Jeandel C:Age−related femoral bone
loss in men: evidence for hyperparathyroidism and insulin−like growth factor−1 deficiency. J Gerontol A Biol Sci Med Sci 2004, 59, 1285–1299.
[24] Purzycka−Jazdon A, Lasek W, Serafin Z, Manysiak S:The bone mass density in men aged over 50 and its rela−
tion to the concentration of free and total testosterone in the blood serum. Pol J Radiol 2003, 68, 30–34.
[25] Orwell ES, Klein RF:Osteoporosis in men. Endocr Rev 1995, 16, 87–116.
[26] Scopacasa F, Wishart JM, Need AG, Horowitz M, Morris HA, Nordin BE:Bone density and bone−related bio−
chemical variables in normal men: a longitudinal study. J Gerontol A Biol Sci Med Sci 2002, 57, 385–391.
[27] Emaus N, Berntsen GKR, Joakimsen R, Fonnebo:Longitudinal Changes in Forearm Bone Mineral Density in Women
and Men Aged 45–84 Years: The Tromso Study, a Population−based Study. Am J Epidemiol 2006,163, 441–449.
[28] Davis JW, Ross PD, Vogel JM, Wasnich RD:Age−related changes in bone mass among Japanese−American
men. Bone Miner 1991, 15, 227–236.
[29] El Maghraoui A, Ghazi M, Gassim S, Mounach A, Ghozlani I, Nouijai A, Achemlal L, Bezza A, Dehhaoui M: Bone mineral density of the spine and femur in a group of healthy Moroccan men. Bone 2009. Abstract.
[30] Ardawi MS, Maimany AA, Bahksh TM, Nasrat HA, Milaat WA, Al−Raddadi RM:Bone mineral density of
the spine and femur in healthy Saudis. Osteoporos Int 2005, 16, 43–55.
[31] Mazess RB, Barden HS, Drinka PJ, Bauwens SF, Orwoll ES, Bell NH:Influence of age and body weight on
spine and femur bone mineral density in U.S. white men. J Bone Miner Res 1990, 5, 645–652.
[32] Khosla S, Amin S, Orwoll E:Osteoporosis in men. Endocr Rev 2008, 29, 441–464.
[33] Kamel HK:Male osteoporosis: new trends in diagnosis and therapy. Drugs Aging 2005, 22, 741–748.
[34] Schuit SC, van der Klift M, Weel AE, de Laet CE, Burger H, Seeman E, Hofman A, Uitterlinden AG, van
Leeuwen Jp, Pols HA:Fracture incidence and association with bone mineral density in elderly men and women:
the Rotterdam Study. Bone 2004;34:195–202.
[35] Lunt M, Felsenberg D, Adams J, Benevolenskaya L, Cannata J, Dequeker J, Dodenhof C, Falch JA, Johnell O, Khaw KT, Masaryk P, Pols H, Poor G, Poor G, Reid D, Schedt−Nave C, Weber K, Silman AJ, Reeve J: Population−based geographic variations in DXA bone density in Europe: the EVOS Study. European Vertebral Osteoporosis. Osteoporos Int 1997, 7, 175–189.
[36] Melton LJ III, Atkinson EJ, O’Connor MK, O’Fallon WM, Riggs Bl:Bone density and fracture risk in men.
J Bone Miner Res 1998, 13,1915–1923.
[37] Lorenc RS, Karczmarewicz E, Skorupa E:Osteoporosis diagnostics as an example of effective prophylactic
procedure. Adv Clin Exp Med 2003, 12, Suppl. 1, 163–168.
[38] Lombardi A, Ross PD:The assessment of bone mass in men. Calcif Tissue Int 2001, 69, 222–224.
Address for correspondence:
Alicja Filus
Department of Endocrinology, Diabetology, and Isotope Treatment Wroclaw Medical University
Wybrzeże Ludwika Pasteura 4 50−356 Wrocław
Poland
Tel. +48 691 380 599 E−mail: [email protected]
Conflict of interest: None declared