This is an open access journal, and articles are distributed under the terms of the Creative Commons Attribution-Non Commercial-ShareAlike 4.0 License, which allows others to remix, tweak, and build upon the work non-commercially, as long as appropriate credit is given and the new creations are licensed under the identical terms.
© 2018 Journal of Advanced Pharmacy Education & Research | Published by SPER Publication
420
Erythrocyte membrane fatty acids in hyperlipidemic patients
Hana M. Gashlan
*, Ayat M. Shourbaji
Biochemistry Department, King Abdulaziz University, Faculty of Sciences, Jeddah, Saudi Arabia
Correspondence: Hana M. Gashlan, Biochemistry Department, King Abdulaziz University, Faculty of Sciences, Jeddah, Saudi Arabia. Email: [email protected], [email protected]
ABSTRACT
Background: Erythrocytes are always exposed to oxidative stress, affecting their membrane lipid composition and function. Impaired fatty acids (FAs) composition of erythrocyte membrane were observed in numerous physiological and chronic diseases. Objective: The aim of the current investigation was to find out the changes in the composition of saturated, monounsaturated and polyunsaturated fatty acids in both plasma and erythrocyte membrane in hyperlipidemia patients. Material and Method: One hundred subjects were enrolled to the study. They were divided into: healthy control group (n= 30), newly diagnosed hyperlipidemia group, ND, (n=33) and treated hyperlipidemia group, TH, (n=37). RBC membrane FAs were separated, identified and were analyzed using gas-chromatography. Results: Significant elevation in almost all detected FAs in RBC membrane were registered. Palmitic and stearic acids were the main contributors in saturated fatty acids (SFAs), while Oleic and elaidic acids were the major components of mono-unsaturated fatty acids (MUFAs). From the main contributors to polymono-unsaturated fatty acids (PUFAs) were linoleic and arachidonic. Levels of MUFAs were higher in ND hyperlipidemia compared to healthy subjects. Same trend was also noted in TH patients compared to control volunteers. Results also demonstrated elevated percent of SFAs and MUFAs and decreased PUFAs percent, from total fatty acids, in hyperlipidemia groups. From total fatty acids the percent of either SFAs or MUFAs was greater than percent of PUFAs. PUFAs n-6 series were elevated in RBC membrane, while n-3 series showed remarkable decreased values in RBC membrane of some patients in ND and TH groups. Decreased saturation index was also obtained in ND and TH patients compared to control subjects. Conclusion: patients with hyperlipidemia, either ND or TH, had marked elevation in almost all FAs in plasma and RBC membrane. The percentage of SFAs and MUFAs from total FAs were increased while the percentage of PUFAs was decreased in hyperlipidemia. Increased dietary SFAs might lead to elevated membrane SFAs which in turn will lead to higher levels of MUFAs in ND and TH patients. Saturation index of RBC membrane, which is an indication of membrane fluidity, was decreased in patients’ group compared to control. Increased dietary intake and alterations in the metabolism of FAs may be responsible for the observed changes.
Keywords: Red blood cells membrane, saturated fatty acids, unsaturated fatty acids, hyperlipidemia
Introduction
Erythrocyte membrane composed of integral proteins, which are important elements with structural functions. Integral proteins are strongly embedded into the lipid layer, making them harder to be extracted from the membrane. Erythrocyte membrane lipids are composed of 60% of phospholipids bilayer, 30% non-esterified cholesterol and 10% glycolipids [1]
.
Numerous studies have shown that cell membrane abnormalities and structural changes of erythrocyte are an etiological factor in many diseases of the circulatory system, e.g. hypertension [2,3]
, breast cancer [4]
, colorectal cancer [5]
and acute pancreatitis [6]. Therefore, membrane fluidity is an
important physiochemical characteristic of biomembranes and an important factor in regulating membrane microviscosity, cell functions and its rheological behavior.
The fluidity of biological membranes is mainly determined by their lipid composition. Cholesterol plays a role in maintaining the bilayer matrix in an “intermediate fluid state” [7] by
regulating mobility of phospholipid fatty acyl chains. An increase in the amount of cholesterol relative to phospholipid has been shown by a variety of physico-chemical techniques to decrease fluidity in both biological and artificial membranes [8].
The cholesterol/phospholipid molar ratio is not the only determinant of membrane fluidity; the phospholipid composition [9-11] and the length and degree of unsaturation of
Access this article online
Website: www.japer.in E-ISSN: 2249-3379
How to cite this article: Hana M. Gashlan, Ayat M. Shourbaji. Erythrocyte membrane fatty acids in hyperlipidemic patients. J Adv Pharm Edu Res 2018;7(4):420-427.
Source of Support: Nil, Conflict of Interest: None declared.
Journal of Advanced Pharmacy Education & Research | Oct-Dec 2017 | Vol 7 | Issue4 421 the phospholipid fatty acyl chains affect fluidity [9,11]
. Lipid-protein interactions within a biological membrane may also modify fluidity and so both the lipid/protein ratio and types of protein present may be important [12,13]
.
In hyperlipidemia, damage to the plasma membranes of red blood cells is well known. This may result from a higher concentration of cholesterol in plasma and membranes, changes in protein conformation and peroxidation of polyunsaturated fatty acids. These changes make erythrocytes less plastic, lose the ability to adjust their shape to the vessel diameter and aggregate, and they accelerate the development of atherosclerosis [14, 15]. In addition, the lipid content is known to
vary and a raised in triglycerides levels were found which in turn can alter RBC membrane fluidity. Furthermore, hypercholesterolaemia is associated with increased oxidative stress and inflammatory mediators that can damage RBCs and increase RBC membrane rigidity [16]. The lipids of the
membranes of erythrocytes were labeled with saturated and unsaturated fatty acid. When these erythrocytes were subsequently incubated with hydrogen peroxide, both types of fatty acid were transferred from superficial erythrocyte neutral lipids into phosphatidylethanolamine. However, the unsaturated fatty acids of phosphatidylethanolamine were subsequently altered by hydrogen peroxide, whereas the saturated fatty acids were not. The cumulative effect of these processes was a relative decrease in unsaturated fatty acid and an increase in saturated fatty acid in the phosphatidylethanolamine of the erythrocyte membrane. The net effect of these events represents the operation of repair processes which distort the usual fatty acid composition of erythrocyte membranes in the presence of H2O2[1]. The aim of
the current investigation was to find out the changes in the composition of saturated, monounsaturated and polyunsaturated fatty acids in both plasma and erythrocyte membrane in hyperlipidemia patients.
Material and Methods
Subjects and study design:
The present study was approved by Faculty of Medicine, Unit
of Biomedical Ethics, KingAbdulaziz University Hospital. Newly diagnosed and treated dyslipidemia cases were diagnosed by hospital physicians. The criteria for dyslipidemia were levels of total cholesterol ˃ 5.0 mmol/l, low density lipoprotein ˃ 3.0 mmol/l, triglycerides ˃ 1.77 mmol/l, high density lipoprotein ˂ 1.0 mmol/l [17].One hundred subjects (62 females & 38 males) were recorded in this study. Their ages ranged from 35 to 50 years. They were divided into three main groups: Control group (C): included 30 healthy volunteers (22 females and 8 males), not suffering from any diseases that might affect lipid profile or any cardiovascular disease, or taking any medications that are known to affect lipid metabolism. Newly diagnosed hyperlipidemic group (ND): included 33 (21 females and 12 males) newly diagnosed patients (uncontrolled hyperlipidemic patients). Treated hyperlipidemic group (TH): included 37 patients with dyslipidemia (19 females and 18 males). Patients were under treatment for at least 6 months before enrollment in the study.
Methods
Blood sample collection: Three milliliter of blood sample were collected from each subject on EDTA tubes after overnight fasting. RBC’s were separated from plasma by centrifugation at 1000×g for 10 min at 4ºC. Plasma was aliquoted and stored at –80°C (for a maximum period of 3 months) pending assay. Packed RBC’s were stored at 4ºC for not more than 3 days till analysis
Materials
Specific kits purchased from HUMAN GmbH Company (Wiesbaden, Germany) were used for determination of plasma lipid profile including cholesterol, triglycerides, high density lipoprotein and low density lipoprotein.
Separation and identification of fatty acids from plasma and RBC membrane
a. Phosphate buffered saline (PBS), PH 7.4, chloroform (CHCl3), dichloromethane (CH2Cl2), methanol (MeOH),
sulfuric acid (H2SO4), toluene, glacial acetic acid, potassium
hydroxide and n-hexane. All were of analytical grade and were obtained from Sigma–Aldrich (St. Louis, MO, USA). b. Standard esterified fatty acids methyl ester (EFAME)
solution mixture containing 37 EFAME (10 mg/ml in CH2Cl2,) was purchased from Sigma-Aldrich (St. Louis,
MO, USA). EFAME standard mixture batch was labeled to contain the following FA as methyl ester: butyric acid 4% (C4:0 ), caproic acid 4% (C6:0), caprylic acid 4% (C8:0), capric acid 4% (C10:0), undecanoic acid 2% (C11:0), lauric acid 4% (C12:0), tridecanoic acid 2% (C13:0), myrstoleic acid 2% (C14:1), myrstic acid 4% (C14:0), cis-10-pentadecanoic acid 2% (C15:1), cis-10-pentadecanoic acid 2% (C15:0), palmitoleic acid 2% (16:1), palmitic acid 6% (16:0), cis-10-heptadecanoic acid 2% (17:1), heptadecanoic acid 2% (C17:0), stearic acid 4% (C18:0),gamma-linoolenic acid 2% (C18:3n6), linoleic acid 2% (C18:2n6c), linolelaidic acid 2% (C18:2n6t), linolenic acid 2% (C18:3n3), oleic acid 4% (C18:1n9c), elaidic acid 2% (C18:1n9t), arachidonic acid 2%(C20:4n6), 5,8,11,14,17-eicosapentaenoic acid 2% (C20:5n3), cis-11,14,17-eicosatrienoic acid 2%(C20:3n3), cis-11,14-eicosatrienoic acid 2% (C20:2), cis-8,11,14-cis-11,14-eicosatrienoic acid 2%(C20:3n6), cis-11-eicosenoic acid 2% (C20:1), arachidic acid 4% (C20:0), cis-4,7,10,13,16,19-docosahexaenoic acid 2% (C22:6n3), heneicosanoic acid 2% (C21:0), cis-13,16-docosadienoic acid 2% (C22:2), erucic acid 2% (C22:1n9), behenic acid 4% (C22:0) tricosanoic acid 2% (C23:0), nervonic acid 2% (C24:1), and lingoceric acid 4% (C24:0).
c. Myrstic acid ethyl ester was prepared in lab from Myrstic acid (C14:1) (Sigma Aldrich, St Louis, MO, USA) and used as internal standard.
d. Nitrogen gas (99.999% purity) was obtained from Abdullah Hashim Company (Abdullah Hashim Industrial Gases and Equipment Company Limited, Saudi Arabia).
Biochemical analysis:
Each separated plasma sample was subjected to quantitative determination of plasma cholesterol, triglycerides, HDL-Cholesterol and LDL-HDL-Cholesterol.
Gashlan, et al.; Erythrocyte membrane fatty acids in hyperlipidemic patients
422 Journal of Advanced Pharmacy Education & Research | Oct-Dec 2017 | Vol 7 | Issue4
The fatty acids content of RBC’s membrane after RBCs washing were extracted and esterified according to the procedure of Folch [18] and Rose [19], this procedure was an optimization and a
modification for optimal recover extraction of lipid trans-methylation by Khedr [20]. Fatty acids were analyzed by GC-MS,
as methyl ester versus standard EFAME solution
Fatty Acids Naming and Grouping:
Fatty acids naming and grouping was carried out using the established method following [4]
.
Statistical analysis:
Statistical analysis was performed using SPSS statistical software package (SPSS Inc, USA). Numerical data were expressed as mean value for each parameter ± it is corresponding standard error. One-way analysis of variance (ANOVA) was carried out to test the significance of difference between groups mean values for each parameter. In case of significant P-value, multiple comparisons using Tukey's HSD (honestly significant difference) test was carried out to test which groups mean value differ from which. For all comparisons, P-values of ˂ 0.05 were considered statistically significant.
Results
Physical characteristics:
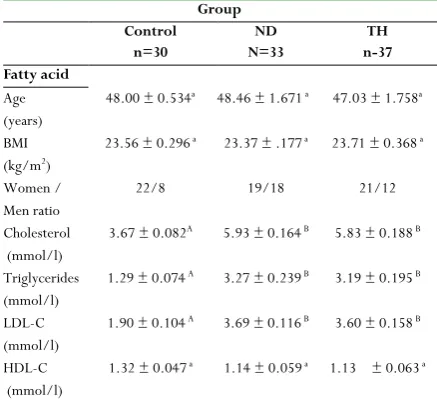
30, 33 and 37 individuals were involved in control, ND and TH respectively. No significant variations in subjects’ ages and BMI were noted between groups. Relative to control group, significant elevation in cholesterol, triglycerides, LDL-cholesterol and HDL-cholesterol were obtained in hyperlipidemia groups (Table 1).
Table 1: Physical characteristics and plasma lipid profile in control and hyperlipidemia groups (x̅ ± SE)
Group Control
n=30
ND N=33
TH n-37 Fatty acid
Age (years)
48.00 ± 0.534a 48.46 ± 1.671 a 47.03 ± 1.758a
BMI (kg/m2)
23.56 ± 0.296 a 23.37 ± .177 a 23.71 ± 0.368 a
Women / Men ratio
22/8 19/18 21/12
Cholesterol (mmol/l)
3.67 ± 0.082A 5.93 ± 0.164 B 5.83 ± 0.188 B
Triglycerides (mmol/l)
1.29 ± 0.074 A 3.27 ± 0.239 B 3.19 ± 0.195 B
LDL-C (mmol/l)
1.90 ± 0.104 A 3.69 ± 0.116 B 3.60 ± 0.158 B
HDL-C (mmol/l)
1.32 ± 0.047 a 1.14 ± 0.059 a 1.13 ± 0.063 a
ND: Newly diagnosed hyperlipidemia, TH: Treated hyperlipidemia BMI: Body mass index
LDL-C: Low density lipoprotein, HDL-C: High density lipoprotein In the same raw, same letters indicate non-significant P value (P> 0.05), while different capital letters indicate high significant P value (P< 0.001).
Saturated fatty acids:
In all groups, the most abundant saturated fatty acids in RBC membrane were palmitic and stearic acids, representing 55.28 % and 42.82 % from total SFAs in control group, 56.70 % and 41.26 % in ND and 57.98 % and 40.02 % in TH respectively.
Significant differences between control, newly diagnosed and treated hyperlipidemia groups were noted for saturated fatty acids with 12, 14, 15, 16, 17 and 18 carbon atoms in membrane of RBC, although saturated fatty acids C12:0 and C20:0 did not show significant variations between groups (Table 2). Detectable values for arachidic acid (C20:0) were only obtained in 12, 18, and 24 cases in control, ND and TH respectively, the rest of participants (18, 15 and 13 cases in C, ND and TH respectively) were presented with non-detectable values. Therefore, the mean values concerning this FA were calculated from detectable values only. No significant change in individual SFAs were obtained between ND and TH hyperlipidemia (Table 2). Results in Table 4 reveled significantly elevated mean for SFA in hyperlipidemia groups compared to healthy control subjects.
SFA: Saturated fatty acid, ND: Newly diagnosed hyperlipidemia, TH: Treated
hyperlipidemia
* Values outside parenthesis indicate % from total SFA, while values inside
parenthesis indicate % from total Fatty acid
**The mean values for arachidic acid were calculated for detectable cases (12, 18 and 24 in control, ND and TH respectively)
Unsaturated fatty acids
All extracted unsaturated fatty acids from RBC membrane showed significant variations between all the studied groups except linoleic acids and cis-eicosatrienoic acid. In control and hyperlipidemia groups, linoleic acid (C18:2, n-6) and docosahexaenoic acid (C22:6, n-3) represented the highest ratio from total USFAs, followed by elaidic (C18:1, n-9t) and oleic acid (C18:1, n-9c). No statistical variations between the two hyperlipidemia groups for the individual USFAs with the exception ofcis-eicosenoic acid (C20:1, n-9). Wide variations in the individual data of C22:6, n-3 were detected in control and hyperlipidemia groups, the mean values were determined Table 2: Saturated fatty acids (µg/ml) in RBC membrane for
control and hyperlipidemia groups (x̅ ± SE) TH n=37 ND
n=33 Control
n=30
Group
Fatty acid
0.23 ± 0.012a 0.13 (0.05) 0.21 ± 0.014a
0.11 (0.04) 0.24 ± 0.024a
0.17 (0.06) Lauric acid
C12: 0 % from total SFA*
1.40 ± 0.079B
0.80 (0.31) 1.41 ± 0.126B
0.75 (0.26) 0.80 ± 0.056A
0.58 (0.21) Myristic acid
C14: 0 % from total SFA*
0.44 ± 0.022B
0.25 (0.10) 0.49 ± 0.037B
0.26 (0.09) 0.35 ± 0.025A
0.25 (0.10) Pentadecanoic acid
C15:0 % from total SFA*
101.95 ± 4.721B
57.98 (22.25) 106.09 ± 6.319B
56.70 (19.22) 76.11 ± 4.250A
55.28 (19.94) Palmitic acid
C16:0 % from total SFA*
0.96 ± 0.044B
0.55 (0.21) 1.09 ± 0.078B
0.58 (0.20) 0.73 ± 0.051A
0.53 (0.19) Heptadecanoic acid
C17:0 % from total SFA*
70.36 ± 3.183A, a 40.02 (15.36) 77.21 ± 4.634B, a
41.26 (13.99) 58.95 ±3.714A
42.82 (15.44) Stearic acid
C18:0 % from total SFA*
0.49 ± 0.037a 0.28 (0.11) 0.61 ± 0.045a
0.32 (0.11) 0.49± 0.055a
0.36 (0.13) Arachidic acid
Journal of Advanced Pharmacy Education & Research | Oct-Dec 2017 | Vol 7 | Issue4 423 from only 30, 28 and 16 cases in control, ND and TH
respectively. The excluded cases (5 and 21 cases in ND and TH respectively) were presented with individual values below 1.0 µg/ml for statistical analysis (Table 3). Elevated levels of monounsaturated fatty acids, polyunsaturated fatty acids, n-6 PUFAs and n-3PUFAs among patients with hyperlipidemia compared to healthy control were noted. Results also indicated decreased saturation index (SI) in RBC membrane in ND and TH compared to healthy volunteers. Although the mean values of n-6 PUFAs in ND and TH were increased relative to their matched values in control, however, the percent of n-6 PUFA from total FAs was decreased. The mean values of n-3 PUFAs percentage were significantly elevated in ND, but not in TH, compared to control groups. No significant variation of n-3/n-6 PUFAs ratio between control and hyperlipidemia groups was obtained (Table 4).
In the same raw, same letters indicate non-significant P value (P> 0.05), while different capital letters indicate high significant P value (P< 0.001). MUFA: Monounsaturated fatty acid, PUFA: Polyunsaturated fatty acid, ND: Newly diagnosed hyperlipidemia, TH: Treated hyperlipidemia.
*Values outside parenthesis indicate % from total MUFA
**Values outside parenthesis indicate % from PUFA, while values inside parenthesis indicate % from total Fatty acid.
*** The mean values for docosahexaenoic acid were calculated for
detectable cases (12, 18 and 24 in control, ND and TH respectively).
In the same raw, same letters indicate non-significant P value (P> 0.05), while different capital letters indicate high significant P value (P< 0.001).
Table 4: Contents (µg/ml) of RBCs membrane SFAs, MUFAs, PUFAs,
n-3PUFAs, n-6PUFAs, SI and n-3PUFA/n-6 PUFA in control and hyperlipidemai groups
TH ND Control Group n=37 n=33 n=30 Fatty acid
207.52 ± 12.204 B
225.18 ±15.000 B
135.46 ±7.561A
SFA
39.17 38.85
35.96 % from total FA
95.21 ± 6.146 B
96.04 ± 6.074 B
52.40 ± 28.14 A
MUFA
17.97 16.57
13.91 % from total FA
227.01 ± 11.275A,a
258.42 ± 20.211B,a
188.85 ± 15.583 A
PUFA
42.85 44.58
50.13 % from total FA
208.51 ± 10.626A,a
228.78 ± 16.176B,a
172.74 ± 13.87 A
n-6 PUFA
39.36 39.47
45.85 % from total FA
20.25 ±1.652 A
32.78 ± 4.625 B
18.77 ±1.720 A
n-3 PUFA
3.82 5.66
4.98 % from total FA
0.10 ± 0.007a,B
0.14 ± 0.012a,A
0.11 ± 0.005 a
n-3/n-6 PUFA
2.07 ± 0.076 B
1.94 ± 0.074 B
2.37 ± 0.118 A
SI
ND: Newly diagnosed hyperlipidemia, TH: Treated hyperlipidemia SFA: Saturated fatty acids = 12:0 + 14:0 +15:0 +16:0 + 17:0 + 18:0. MUFA: Monounsaturated fatty acids = 14:1+ 16:1+ 17:1+18: 1, n-9c + 18:1, n-9t + 20:1, n-9c.
UFAs: Polyunsaturated fatty acids = 18:2, 6c + 20:2+ 18:3, 6c + 20:3, n-3c + 20:4, n-6c + 22:6, n-n-3c.
n-6 PUFAs = 18:2, n-6c + 18:3, n-6c + 20:4, n-6c n-3 PUFAs = 20: 3, n-3c + 22: 6, n-3c. SI: Saturation index = C18: 0 / C18: 1, n-9c.
In the same raw, same letters indicate non-significant P value (P> 0.05), while different capital letters indicate high significant P value (P< 0.001).
Discussion
The present study demonstrated changes in plasma fatty acids in hyperlipidemia patients, either newly diagnosed (ND) or treated hyperlipidemia (TH), compared to control subjects. Almost all saturated and unsaturated fatty acids showed measurable increase in hyperlipidemia group than control one. Patients with hyperlipidemia had pronounced increased levels of total: SFAs, MUFAs, PUFAs, n-3PUFAs and n-6PUFAs than control volunteers. Saturation index (SI) was reduced in patients’ groups compared to control healthy volunteers. In the current study, hyperlipidemic patients had considerable changes in almost all estimated saturated fatty acids in RBC membrane. Elevated SFAs could be due to high intake of hazelnut, fat rich dairy products, fatty meats and sausages [21-23]
. Elevated mean values of membrane SFAs were due to increased levels of palmitic (C16:0) and stearic (C18:0) acids. From total SFAs, both palmatic and stearic acids represented 56.70% and 41.26% respectively in newly diagnosed hyperlipidemia, while in treated hyperlipidemia, palmitic acid represented 57.98% and srearic acid represented 40.2%. In control group, the percent of palmitic /SFAs and stearic /SFAs were 55.28% and
Table 3: Unsaturated fatty acids (µg/ml) in RBC membrane for
control and hyperlipidemia groups (x̅ ± SE)
TH ND
Control Group
Fatty acid n=30 n=33 n=37
0.08 ±0.009B,a
0.06 ± 0.007A,a
0.04 ± 0.006A
Myrstoleic acid C14:1
M
UFA
0.08 (0.02) 0.06 (0.01)
0.07 (0.01) % from total MUFA*
3.61 ± 0.357B,a
2.91 ± 0.280A,a
1.61 ± 0.184A
Palmitoleic acid C16:1
3.78 (0.79) 3.02 (0.53)
2.88 (0.42) % from total MUFA*
0.82 ± 0.069B
0.72 ± 0.068B
0.34 ± 0.025A
cis-10-Heptadecanoic acid C17:1
0.86 (0.18) 0.75 (0.13)
0.61 (0.09) % from total MUFA*
38.01 ± 2.494A.a
42.07 ± 3.262B,a
28.36 ± 3.026A
Oleic acid C18:1, n-9c 39.75 (8.30) 43.62 (7.62) 50.75 (7.43) % from total MUFA*
52.39 ± 3.711B
49.75 ± 4.196B
25.15 ± 4.106A
Elaidic acid C18:1, n-9t 54.79 (11.44) 51.58 (9.01) 45.01 (6.59) % from total MUFA*
0.60 ± 0.050B
0.64 ± 0.095B
0.23 ± 0.035A
gamma-linolenic acid C18:3, n-6
0.32 (0.13) 0.24 (0.12)
0.12 (0.06 % from total MUFA*
0.72 ± 0.047C
0.94 ± 0.084B
0.38 ± 0.050A
cis-11-eicosenoic acid C20: 1, n-9
0.75 (0.16) 0.97 (0.17)
0.68 (0.09) % from total MUFA*
88.70 ± 4.504a
101.89 ± 7.359 a
83.97 ± 8.334 a
Linoleic acid C18:2, n-6
P UFA 47.51 (19.36) 37.97 (18.46) 44.62 (21.99) % from total PUFA**
0.71 ± 0.086a
0.52 ± 0.110a
0.70 ± 0.079 a
cis-11,14-eicosatrienoic C20:2, n-6
0.38 (0.15) 0.19 (0.09)
0.37 (0.18) % from total PUFA**
5.53 ± 0.802B
6.59 ± 1.230 B
0.06 ± 0.007A
cis-11,14,17 eicosatrienoic acid 2.96 (1.21) 2.46 (1.19) 0.03 (0.01) C20:3,n-3
% from total PUFA**
14.86 ± 1.785C
26.45 ± 3.798 B
17.21 ± 1.688A
Arachidonic acid C20: 4, n-6
7.96 (3.24) 9.86 (4.79)
9.14 (4.51) % from total PUFA**
76.28 ± 13.975a,B
132.24 ± 18.989 a,A
86.04 ± 8.44 a
cis-4,7,10,13,16,1 docosahexaenoic acid C22:6,n-3 ***
% from total PUFA**
40.86 (16.65) 49.28 (23.96)
Gashlan, et al.; Erythrocyte membrane fatty acids in hyperlipidemic patients
424 Journal of Advanced Pharmacy Education & Research | Oct-Dec 2017 | Vol 7 | Issue4
42.82% respectively. In control group, SFAs in RBC membrane represented 35.96% from total fatty acids, while in hyperlipidemia patients it represented 38.85% in ND and 39.17% in TH from total fatty acids. Our data are consistent with previous studies [6, 24] reported that both palmitic and
stearic acids were the major contributing factors in SFAs of RBC membrane in patients with arterial blood pressure associated with dyslipidemia. Elevated stearic acid level was also observed in animal model kept on high fat diet for long term [25].
Saturated fatty acids are non-essential FA and are harmful if ingested excessively in food. They favor excess weight, insulin resistance [26] increased LDL-Cholesterol and are atherogenic [27].
Increased percent of SFA/PUFA were previously reported to be positively correlated with different diseases [4, 6, 28]. Increased
SFA in RBC lead to decreased fluidity of the cell lipid bilayer, an activity of membrane bound enzymes and inhibition of binding the ligands with receptor [29, 30].
USFAs are the major fatty acids contributing to permeability, fluidity of the RBC membrane and also to the function of the membrane via receptors and membrane bond energy [31]
. Although, higher mean values levels for USFA (MUFA and PUFA) were detected in hyperlipidemia subgroups, however their percent from total fatty acids were lower than the control. From total FA, USFA represented 61.3% in ND and 60.82% in TH compared to 64.04% in control. In our study, levels of MUFAs were higher in ND hyperlipidemia compared to healthy subjects. Same trend was also noted in TH patients compared to control volunteers. Non-essential MUFAs and namely its main component oleic acid have a beneficial effect upon cholesterol metabolism and a protective role against cardiovascular diseases
[32]
. Both oleic (C18:1, n-9c) and elaidic (C18:1, n-9t) acids were the major contributors in RBC membrane MUFAs in all groups. Significantly elevated levels of both FAs were observed in hyperlipidemia patients compared to healthy subjects. Novgorodtseva et al. [33] indicated that all patients with arterial
hypertension associated with dyslipidemia had measurable increased erythrocyte membrane MUFA C18:1n9 (oleic acid). Decreased percent of oleic acid/ MUFA was noted in control (50.75%) than newly diagnosed (43.62%) and treated hyperlipidemia (39.75%). However opposite trend was obtained for elaidic acid, where higher percent of elaidic /MUFA was detected in ND and TH patients compared to control subjects.
The high levels of MUFAs in hyperlipidemia might be primarily due to increased consumption of olive oil [34, 35]. A high dietary
MUFAs contents is probably one determinant, but not the major one, of erythrocyte membrane MUFAs [36-38] which are
synthesized in the body [39, 40]. High level of MUFAs especially
oleic acid and elaidic acid in dyslipidemia, either newly diagnosed or treated, and low saturation index may also be related to other factor than diet. Most oleic acid in mammalian tissue is derived from diet or saturated stearic acid residue [39, 41, 42]. The later was the second abundant SFA in RBC membrane
in our study. The conversion is catalyzed by Δ9-desaturase enzyme, which also regulates the transformation of the other common SFAs (myristic and palmitic) to their corresponding monounsaturated forms, myrstoleic and palmitoleic [4]
. In our study, all these FAs were elevated in RBC membrane of hyperlipidemia patients than control subjects. This finding was supported by the obtained significant positive correlations, in
RBC membrane, between stearic and oleaic acids in all studied groups, as well as between myristic and its corresponding fatty acid myrstoleic and between palmitic and palmitoleic acids. Their significant correlations might indicate that increased dietary SFAs might lead to elevated membrane SFAs which intern will lead to higher values of MUFAs in ND and TH patients. Therefore, the observed higher MUFAs mean values in hyperlipidemia compared to control may be mostly due to increased Δ9-desaturase activity. Several factors are known to exert an important effect on Δ9-desaturase activity. The fat contents of the diet have an important effect on the enzyme activity [43], which might explain the higher concentration of
MUFAs in dyslipidemia compared to control subjects, since this group of patients was presented with significantly elevated plasma cholesterol and triglycerides, indicating their quality of diet. A high cholesterol diet was also reported to increase Δ 9-desaturase activity resulting in increased monounsaturation of the membrane fatty acids in rat liver to partially compensate for the rigid zing effect of cholesterol incorporation in the membrane [40]
. Additionally, Δ9-desaturase activity was found to be activated by carbohydrate [44] and insulin [34, 45] which might
point out to the possible relationships between increased dietary carbohydrate and elevated MUFAs.
In this work, RBC membrane polyunsaturated fatty acids represented higher percentage from total FAs in all groups. In hyperlipidemia patients, the percent of PUFAs from total FAs was decreased in ND (44.58%) and in TH (42.85%) compared to control group value (50.13%). Polyunsaturated fatty acids are designated as essential for good health, as their metabolic precursors cannot be synthesized in the body and must be ingested by food intake [46]
. PUFAs have important effects on the structure and physical properties of localized membrane domains. They modulate enzyme activities, carriers and membrane receptors. PUFAs are involved in eicosanoid (prostaglandins, prostacyclins, thromboxanes, leukotrienes) production, signal transduction, and the activation of nuclear transcription factors [47]
. Parent essential FAs contributors in PUFAs are linoleic (C18:2, n-6c) and linolenic (C18:3, n-3c) acids. It is well established that α-linolenic acid content of erythrocyte membrane is very low and is largely unrelated to dietary intake [48, 49]. Researchers[30] had indicated that the
desaturation and elongation of essential fatty acids, linoleic and linolenic, results in the formation of PUFAs of n-6 and n-3 series. In our study, significant positive correlations were detected between linoleic acid and most PUFA of n-6 and n-3 series in hyperlipidemia subjects. Other contributors in PUFA were arachidonic acid (C20:4, n-6) and C22:6, n-3. It is worth to point out to the lack of significant difference between hyperlipidemia and control groups for linoleic acid levels. On the other hand, significant elevation was obtained in plasma linoleic acid in hyperlipidemia patients relative to control group. Arachidonic acid was reported to be higher in arterial hypertension patients with dyslipidemia compared to healthy group [33, 50]
. Elevated erythrocyte membrane C20:4, n6 was also found to be increased in animals fed high fat diet for a long period [25]. Linoleic acid is an essential fatty acid [51], after being
Journal of Advanced Pharmacy Education & Research | Oct-Dec 2017 | Vol 7 | Issue4 425 arachidonic acid mean value was noted in newly diagnosed
hyperlipidemia compared to control. We also observed decreased linoleic/arachidonic ratio in ND hyperlipidemia compared to control group (3.9 in ND and 4.9 in control). In addition to the obtained significant positive correlation between membrane linoleic and membrane arachidonic acids. This finding might suggests that the conversation of linoleic to arachidonic acid could be active in ND hyperlipidemia patient, which properly indicate higher activity of elongase or of Δ9 desaturase for the formation of arachidonic from linolic acid. Therefore, the increased concentration of arachidonic acid and other n-6 PUFAs observed in ND hyperlipidemia may indicate increased transformation of linoleic acid to arachidonic acid and to other n-6PUFA, or increased dietary intake. Our study revealed significant reduction (although it was borderline significant, P = 0.05) in the mean value of membrane arachidonic acid in TH compared to ND subgroup. On the other hand, the increased linoleic/ arachidonic ration in treated hyperlipidemia (5.9) relative to control (4.9) raised the possibility that diversion of linoleic acid metabolism away from arachidonic acid (and hens from arachidonic acid - derived prostaglandins) might be a protective step in hyperlipidemia patients under treatment [54]
. Arachidonic acid is a predecessor of synthesis of anti-inflammatory leukotriens and thromboxanes with their strong aggregation and vasoconstriction properties [55, 56]
. It is worth mentioning that some n-6PUFAs, but not arachidonic acid, in TH subgroup could be also due to decreased dietary intake.
In our study, the observed increase in the percent of membrane SFAs with simultaneous decrease in PUFA percent from total fatty acids in hyperlipidemia compared to control values may be an evidence for transport pathology with a predominance of cells passive fatty acids absorption. The integral parameters of the cells impaired absorption both of SFAs and of PUFAs are low levels of HDL-C and high levels of cholesterol and triglycerides in plasma [57, 58].
The saturation index (SI) in erythrocyte membrane is the ratio of stearic to oleic acid. The SI is an indicator of membrane fluidity; its reciprocal is considered to be an index of the activity of the rate-limiting enzyme delta 9-desaturase that transforms the SFAs palmitic and stearic acids, respectively, into the MUFAs palmitoleic and oleic acid [39]. Our results
indicated that hyperlipidemia group was associated with decreased saturation index. This result is in agreement with previous study [25]. The observed elevated levels of oleic acid and
low SI in hyperlipidemic patients may reflects poor PUFAs in diet [4]
.
It was concluded from the present study that patients with hyperlipidemia, either ND or TH, had pronounced elevation in almost all FAs in RBC membrane. The percentage of SFAs and MUFAs from total FAs were increased while the percentage of PUFAs was decreased in hyperlipidemia. Increased dietary SFAs might lead to elevated membrane SFAs which in turn will lead to higher levels of MUFAs in ND and TH patients. Saturation index of RBC membrane, was decreased in patients’ groups compared to control. Increased dietary intake and alterations in the metabolism of FAs may be responsible for the observed changes.
From the present study, the percent of SFAs, MUFAs and PUFAs from total FAs in RBC membrane should be
determined, since this data will give information about the membrane fluidity and viscosity, which consequently indicate RBCs functions. Determination of lipid profiles requires fasting for at least 12h. Some patients are unable to fast for long time; therefore, analysis of RBC membrane fatty acids might be useful in this case. Balanced dietary fat with balanced intake of both n-3 and n-6 polyunsaturated fatty acid is essential to maintain normal plasma lipids and for better health. Analysis of RBS fatty acids during routine follow up of hyperlipidemia patients is highly recommended since it might provide information on the dietary fat intake for long period.
Acknowledgment
Thanks and appreciations are directed to King Abdulaziz City for Science and Technology for financial support) TA-10-231) to the project of the research.
References
1. Gabreanu GR, Angelescu S. Erythrocyte membrane in type 2 diabetes mellitus. Discoveries 2016; 4(2): 1-12 2. Tsuda K, Kimura K, Nishio I, Masuyama Y. Nitric oxide
improves membrane fluidity of erythrocytes in essential hypertension: an electron paramagnetic resonance investigation. BiochemBiophys Res Comm2000; 275: 946 -954.
3. Tsuda K, Shimamoto YK, Kimura K, Nishio I. Nitric oxide is a determinant of membrane fluidity of erythrocytes in postmenopausal woman: An electron paramagnetic resonance investigation. Am J Hyper 2003; 16: 244-248.
4. Pala V, Krogh V, Muti P, Chajes V, Riboli E, Micheli A, Saadatian M, Sieri S, Berrino F. Erythrocyte Membrane Fatty Acids and Subsequent Breast Cancer: A Prospective Italian Study. J Natl Cancer Inst 2001; 93:1088-1095. 5. Kuriki K, Wakai K, Hirose K, Matsuo K, Ito H, Suzuki
T, et al. Risk of Colorectal Cancer is Linked to Erythrocyte Intakes of Fish, Fat, and Fatty Acids Compositions of Fatty Acids as Biomarkers for Dietary, Cancer Epidemiol Biomarkers 2006; 15:1791-1798. 6. Kuliaviene I, Gulbinas A, Cremers J, Pundzius J,
Kupcinskas L, Dambrauskas Z, Jansen E. Fatty acids of erythrocyte membrane in acute pancreatitis patients, World J Gastroenterol 2013;19(34): 5678-5684. 7. Chapman D. Recent physical studies of phospholipids and
natural membranes. In Biological Membranes. Physical Fact and Function. D. Chapman, editor. Academic Press, London 1968; 125-202.
8. Cooper R A, Durocher R J, Leslie M H. Decreased fluidity of red cell membrane lipids in abetalipoproteinemia. J. Clin. Invest 197760: 115-121. 9. Shinitzky M, Inbar M. Microviscosity parameters and
protein mobility in biological membranes. Biochim. Biophys. Acta 1976; 433:133-149.
Gashlan, et al.; Erythrocyte membrane fatty acids in hyperlipidemic patients
426 Journal of Advanced Pharmacy Education & Research | Oct-Dec 2017 | Vol 7 | Issue4
11. Cooper RA. Abnormalities of cell-membrane fluidity in the pathogenesis of disease. N Engl J Med 1977; 297: 371-377.
12. Jahnig F. Structural order of lipids and proteins in membranes: evaluation of fluorescence anisotropy data. Proc. Natl. Acad. Sci 1979;76: 6361-6365.
13. Chapman D, G6mez-Fernhndez J C, Gofii FM. Intrinsic protein-lipid interactions. Physical and biochemical evidence. FEBS Lett 1979; 98: 211-223.
14. Kanakaraj P, Singh M. Influence of Hypercholesterolemia on morphological and rheological characteristics of erythrocytes. Atherosclerosis 1989; 76: 209-18.
15. Unruh D, Srinivasan R, Benson T, Haigh S, Coyle D, Batra N, et al. Red Blood Cell Dysfunction Induced by High-Fat Diet: Potential Implications for Obesity-Related Atherosclerosis.Circulation. 2015;132(20):1898-908. 16. Sparrow RL. Red blood cell components: time to revisit
the sources of variability. Blood Transfus2017; 15(2): 116-125.
17. Mancia G, De Backer G, Dominiczak A, Cifkova R, Fagard R, Germano G, et al. Guidelines for the Management of Arterial Hypertension: the task force for the Management of Arterial Hypertension of the Europen Society of Hypertension (ESH) and Europen Society of Cardiology (ESC). J Hypertens 2007; 25:1105-1187 18. Folch J, Lees M, Sloane Stanley GH. A simple Method
for the isolation and purification of total lipids from Animal tissues. J BiolChem 1957; 226: 497-509. 19. Rose G, Oklander M. Improved procedure for the
extraction of lipids from human erythrocytes. J Lipid Res 1965; 6:428–431.
20. Khedr A, Abd-Elaaty M, Hegazy A, Kamal A. Profiling of plasma esterified fatty acids contents in dengue fever patients applying optimized GC MS method. Metabolomics 2014; 4 (2): 154.
21. Deon V, Del Bo' C, Guaraldi F, Abello F, Belviso S, Porrini M, Riso P, Guardamagna O. Effect of hazelnut on serum lipid profile and fatty acid composition of erythrocyte phospholipids in children and adolescents with primary hyperlipidemia: A randomized controlled trial.ClinNutr 2017; S0261-5614(17)30196-6.
22. Keys A. Coronary heart disease-the global picture. Atherosclerosis 1975; 22: 149-92.
23. Pietinen P, Dougherty R, Mutanen M, et al. Dietary intervention study among 30 free-living families in Finland. J Am DietetAssoc 1984; 84:313-318.
24. Ristic-Medic D, Suzic S, Vucic V, Takic M, et al. Serum and erythrocyte membrane phospholipids fatty acid composition in hyperlipidemia: effects of dietary intervention and combined diet and fibrate therapy. Gen PhysiolBiophys 2009; 28:190–199.
25. Novgorodtseva TP, Karaman YK, Zhukova NV. The effect of high fat food on erythrocyte phospholipids, fatty acids composition and glutathione redox-system of rats with alimentary dyslipidemia. Health 2010; 2:45-50. 26. Folsom AR, Ma J, Aggovern PG, Eckfeldt JH. Relation
between plasma phospholipid saturation fatty acids and hyperinsulinemia. Metabolism 1996; 25: 223–228. 27. Ma J, Folsom R, Lewis L, Eckfeldt H. Relation of plasma
phospholipids and cholesterol ester fatty acid composition
to carotid artery intima-media thickness: the atherosclerosis risk in communities (ARIC) study. Am J ClinNutr 1997; 65: 551-559.
28. Pandey M, Khatri AK, Dubey SS, Gautam A, Shukla VK. Erythrocyte membrane stearic to oleic acid ratio in carcinoma of the gallbladder: a preliminary study. World Journal of Surgical Oncology 2003; 1.
29. Endakova EA, Novgorodtseva TP, Svetashev VI. Modification of blood fatty acids composition in case of cardiovascular diseases. Vladivostok: Dalnauka 2002; 296.
30. Potyomkin VV, Troitskaja SJ, Maksina AG. Metabolic indicators and struktura membranes erythrocytes at obesity and a metabolic syndrome at women. Russian Medical Journal 2006; 1: 35-38.
31. Popp-Snijders C, Schouten JA, van Blitterswijk WJ, van dar Veen EA. Changes in membrane lipid composition of human erythrocyte after dietary supplementation of (n-3) olyunsaturated fatty acids. Maintenance of membrane fluidity. Biochim. Biophys 1986; 854: 31-37
32. De Lacruz JP, Villalobos MA, Carmona JA, Romero M, Agreda JM, de Lacuesta F. Antithrombotic potential of olive oil administration in rabbits with elevated cholesterol. Thromb Res 2000; 100: 305–315.
33. Novgorodtseva TP, Karaman YK, Gvozdenko TA, Antonyuk MV, Knyshova VV. Fatty acids composition of erythrocytes in arterial hypertension associated with dyslipidemia. Health 2013; 5: 73-77.
34. Menotti A, Conti S, Giampoli S, Mariotti S, Signoretti A. Coronary risk factors predicting coronary and other causes of death in fifteen years. ActaCardiol 1980; 35: 107-120.
35. Ferro-Luzzi A, Strazzullo P, Scaccini C, Siani A, Sette S, Mariani MA, et al. Changing the Mediterranean diet: effects on blood lipids. Am J ClinNutr 1984; 40:1027-1037.
36. Dougherty, R.M., Galli, C., Ferro-Luzzi, A. and Iacono, J.M. Lipid and phospholipid fatty acid composition of plasma, red blood cells, and platelets and how they are affected by dietary lipids: a study of normal subjects from Italy, Finland, and the USA. Am J ClinNutr 1987; 45:443-455.
37. Corrocher R, Pagnan A, Ambrosio GB, Ferrari S, Olivieri O, Guarini P, et al. Effects induced by olive oil-rich diet on erythrocytes membrane lipids and sodium-potassium transports in postmenopausal hypertensive women. J Endocrinol Invest 1992; 15:369–376.
38. Kohlmeier L. Biomarkers of fatty acid exposure and breast cancer risk. Am J ClinNutr 1997; 66 (6):1548S– 6S.
39. Fernandez C, Schuhmann K, Herzog R, Fielding B, Frayn
K, Shevchenko A, et al.
Altered desaturation and elongation of fatty acids in horm
one-sensitive lipase null mice.PLoSOne2011;6(6):e21603. 40. Brenner RR. Endocrine control of fatty acid desaturation.
BiochemSoc Trans 1990; 18:773–775.
Journal of Advanced Pharmacy Education & Research | Oct-Dec 2017 | Vol 7 | Issue4 427 the Morris hepatoma 7288C. BiochimBiophysActa 1985;
845:380–8.
42. Polo-Hernández E, De Castro F, García-García AG, Tabernero A, Medina JM. Oleic acid synthesized in the periventricular zone promotes axonogenesis in the striatum during brain development. J Neurochem 2010; 1756-1766.
43. Waters KM, Ntambi JM. Polyunsaturated fatty acids inhibit hepatic stearoyl-CoA desaturase-1 gene in diabetic mice. Lipids 1996; 31: S33–S36.
44. Berra B, Rapelli S. Utilization of dietary fats with particular reference to olive oil: biochemical and nutritional aspects. La RivistadelleSostanze Grasse 1987; 64:317–324.
45. Ntambi JM, Sessler AM, Takova T. A model cell line to study regulation of stearoyl-CoA desaturase gene 1 expression by insulin and polyunsaturated fatty acids. BiochemBiophys Res Commun 1996; 220:990-995. 46. Abedi E, SahariMA.Long-chain polyunsaturated fatty acid
sources and evaluation of their nutritional and functional properties. Food SciNutr 2014; 2(5): 443–463.
47. Spector A. Essentiality of fatty acids. Lipids 1999; 34: S1–S3.
48. Brox JH, Killie J, Gunnes S, Nordoy A. The effect of cod liver oil and corn oil on platelets and vessel wall in man. ThrombHaemost (Stuttgart) 1981; 46:604-11.
49. Goodnight SH, Harris ES, Connor WE, Illingworth DR. Polyunsaturated fatty acids, hyperlipidemia and thrombosis. Atherosclerosis 1982; 2: 87-113.
50. Novgorodtseva TP, Kantur TA, Karaman YK, Antonyuk MV, Zhukova NV. Modification of fatty acids composition in erythrocytes lipids in arterial hypertension associated with dyslipidemia. Lipids 2011; 10:18. 51. Halliwell B, Gutterdige JMC. Free Radicals in Biology
and Medicine, 3rd Edition, Oxford University Press 1999.
52. James MJ, Gibson RA, Cleland LG. Dietary polyunsaturated fatty acids and inflammatory mediator production. Am J ClinNutr 2000; 71:343-348.
53. Jones R, Adel-Alvarez LA, Alvarez OR, Broaddus R, Das S. Arachidonic acid and colorectal carcinogenesis. Mol Cell Biochem 2003; 253:141-149.
54. Chapkin R S, Hubbard N E, Buckman D K, Erickson K L. Linoleic acid metabolism in metastatic and nonmetastatic murine mammary tumor cells. Cancer Res 1989; 49:4724–4728.
55. Zhou L, Nilsson А. Sources of eicosanoid pre-cursor fatty acid pools in tissues. J Lipid Res 2001; 42:1521-1542. 56. Novgorodtseva TP, KaramanYuK, Antoniuk MV,
Zhukova NV. The role of free and esterified fatty acids in pathogenesis of metabolic syndrome. Klin Med 2009; 87(5): 33-7.
57. Calder PC, Yaqoob P. Lipid rafts-composition, characterization and controversies. J Nutr 2007; 137:545-7.