An evaluation of additional criteria for
assessing the condition of oil terminal
tanks with the aim of extending safe
service life – Part 2
by A.A. Katanov*
1, M.V. Likhovtsev
1, and
D.A. Bushnev
21 The Pipeline Transport Institute, LLC, Moscow, Russian Federation 2 JSC Transneft Diascan, Lukhovitsy, Moscow Region, Russian
Federation
T
HE FIRST PART OF THIS PAPER, describing the isssues involved and the authors’ research proposal,was published in the September 2018 (Vol.2, No.3) issue of Pipeline Science and Technology. In this second part, the authors discuss their work in detail, and describe their conclusions.4. Discussion
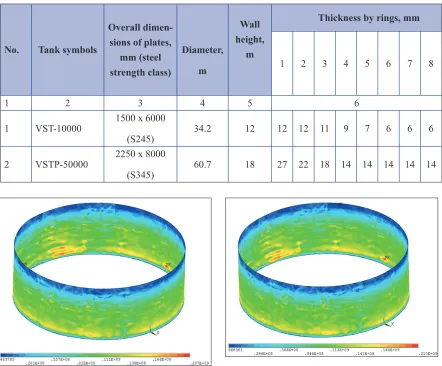
The results of these studies are demonstrated using the example of processing laser scanning data for the walls of VST-10000 and VSTP-50000 tanks.
The characteristics of the tanks are presented in Table 1.
The laser scanner Leica ScanStation P40 was used during SLS. Scanning was carried out at a resolution of 1.6; 3.1; 6.3; 12.5 mm / 10 m.
Processing the data of tank wall SLS to prepare a computer 3D model for calculating tank wall stress-strain state was carried out in the following order:
• recording points in a single cloud, evaluating the accuracy of stitched scans, cleaning the model of foreign objects and preparing a point cloud for import into a 3D Reshaper in ASC format (Fig.1);
• reducing ‘noise’ in the point model of the structure (corrections for interference and scanning errors caused by the gloss of the metal, or by viewing angles which are impossible for the scanner);
• filtering the point model with adjustable spacing of the points;
• filling gaps in areas that were hidden by loading platforms and stairs, cladding structures, fire extinguishing pipes, etc.;
• reconfiguring the polygon mesh frame to obtain a more uniform triangulation;
• - forming a mesh and generating a mathematical shape, used in computer graphics to generate and represent curves and surfaces – NURBS surface;
• NURBS – surface models of tank walls, obtained as a result of processing, are evaluated for deviation from the initial point cloud, which in turn is obtained as a result of SLS. The evaluation is based on the mean (±) and linear standard error RMS (root mean square), limiting the interval which the actual error does not exceed with a probability of 68%. The error values for resolution range 1.6 to 12.5 mm / 10 m do not exceed: • mean deviations ± 0.0004 m;
• RMS 0.0006 m.
ARTICLE INFO
Lorem ipsum
Fig.1. General view of the points cloud of the VSTP-50000 tank wall with a superimposed colour texture.
Fig.2. Stress-strain curve
The resulting NURBS-surface was saved in .IGES format for programs which implement the finite element method and calculate the stress-strain state of the structures.
The tank wall NURBS-surface obtained from computer processing was saved in .IGES format, suitable for developing a wall surface design model in the ANSYS software which implements the finite-element method.
To develop a finite-element model of tank wall, the following finite elements were used:
• Shell 181, a four-node finite element in ANSYS, which implements the properties of plate elements with thickness as a given parameter, to create plate elements of the tank wall;
• - Beam188, a two-node finite element in Ansys, which implements the properties of be • ements with a cross-section as a given parameter, to simulate beam elements of the base setting ring of the tank roof.
The physical characteristics of steels S245 and S345 are as follows:
• modulus of elasticity E = 2.06 x 10¹¹ Pa; • Poisson’s ratio m = 0.3;
• density r = 7850 kg/m3.
The calculation was made taking into account geometric and physical nonlinearity. Values for the elastic-plastic characteristics of S345 steel are shown in Table 2 and in Fig.2.
4.1. Accepted filling levels for tanks (product density r = 1000 kg/m3):
• with a wall height of 12.0 m - 11.0 m; • with a wall height of 18.0 m - 17.0 m.
Based on calculations performed in ANSYS software, von Mises equivalent stresses (seqv,
MPa) were determined for each tank wall ring using the following equation:
σeqv =
(
σ1−σ2)
+(
σ −σ)
+(
σ −σ)
2
2 3
2
3 1
2
2
where s1, s2 and s3are the principal stresses in the final element, calculated by means of the
applied finite-element package ANSYS, Pa.
No. Tank symbols
Overall dimen-sions of plates,
mm (steel strength class)
Diameter, m
Wall height,
m
Thickness by rings, mm
1 2 3 4 5 6 7 8
1 2 3 4 5 6
1 VST-10000 1500 х 6000
(S245) 34.2 12 12 12 11 9 7 6 6 6
2 VSTP-50000 2250 х 8000
(S345) 60.7 18 27 22 18 14 14 14 14 14
Table 1. Characteristics of tanks subjected to laser scanning
Fig.3. Distribution of equivalent stresses seqv in the VST-10000 tank wall (Pa). The scanning resolution is 1.6 mm/10 m.
Fig.4. Distribution of equivalent stresses seqv in the VST-10000 tank wall (Pa). The scanning resolution is 3.2 mm/10 m.
Fig.5. Distribution of equivalent stresses seqv in the
VST-No. gradeSteel
Material model characteristics
se, Pa ee Ry, Pa ey sy.pl., Pa sy.pl. su, Pa su
1 2 3 4 5 6 7 8 9 10
1
S345 (09G2S), thickness
2 - 20 mm
3.20 x 10⁸ 0.00160 3.25 x 10⁸ 0.00363 3.73 x 10⁸ 0.01521 4.70 x 10⁸ 0.021
Point 1 in Fig.2 Point 2 in Fig.2 Point 3 in Fig.2 Point 4 in Fig.2 2 S345 (09G2S), thickness
20 - 40 mm
3.0 x 10⁸ 0.00150 3.05 x 10⁸ 0.00353 3.57 x 10⁸ 0.01518 4.60 x 10⁸ 0.021
Point 1 in Fig.2 Point 2 in Fig.2 Point 3 in Fig.2 Point 4 in Fig.2
3 S245 (VSt3)
2.40· x 108 0.00120 2.45 x 10⁸ 0.00323 2.87 x 10⁸ 0.01774 3.70 x 10⁸ 0.025
Point 1 in Fig.2 Point 2 in Fig.2 Point 3 in Fig.2 Point 4 in Fig.2 N o t e s :
σe, ee – stresses and strains corresponding to the elastic (proportionality) limit;
Ry, ey – stresses and strains corresponding to the yield strength; sy.pl., ey.pl. – stresses and strains corresponding to the yield plateau; su, eu – stresses and strains corresponding to the ultimate strength
Table 2. The elastic-plastic characteristics of S345 and S345 steels
No.
Scanning resolution mm/10 m
Ring thickness, mm
1 2 3 4 5 6 7 8
1 2 3
1 1.6 0.207 0.197 0.178 0.161 0.156 0.169 0.123 0.059
2 3.1 0.21 0.195 0.177 0.162 0.149 0.174 0.122 0.061
3 6.3 0.211 0.195 0.182 0.16 0.157 0.162 0.121 0.056
4 12.5 0.21 0.194 0.184 0.162 0.154 0.154 0.117 0.054
Table 3. The values of the maximum equivalent stresses seqv in VST-10000 tank wall rings (Pa x 109)
No.
Scanning resolu-tion
mm / 10 m
Ring thickness, mm
1 2 3 4 5 6 7 8
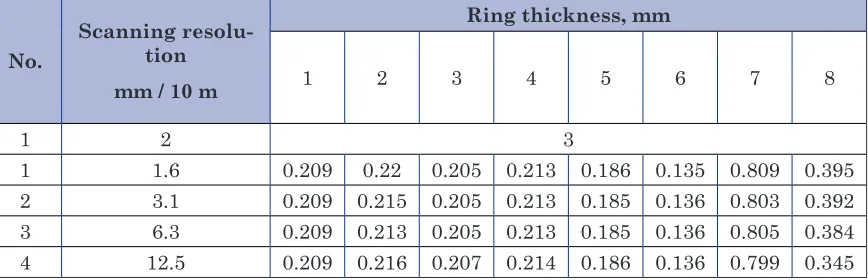
1 2 3
1 1.6 0.209 0.22 0.205 0.213 0.186 0.135 0.809 0.395
2 3.1 0.209 0.215 0.205 0.213 0.185 0.136 0.803 0.392
3 6.3 0.209 0.213 0.205 0.213 0.185 0.136 0.805 0.384
4 12.5 0.209 0.216 0.207 0.214 0.186 0.136 0.799 0.345
Fig.7. Distribution of equivalent stresses seqv in the VSTP-50000 tank wall (Pa). The scanning resolution is 1.6 mm/10 m.
Fig.8. Distribution of equivalent stresses seqv in the VSTP-50000 tank wall (Pa). The scanning resolution is 3.2/10 m.
Fig.9. Distribution of equivalent stresses seqv in the VSTP-50000 tank wall (Pa). The scanning resolution is 6.3 mm/10m.
Fig.10. Distribution of equivalent stresses seqv in the VSTP-50000 tank wall (Pa). The scanning resolution is 12.5 mm/10 m.
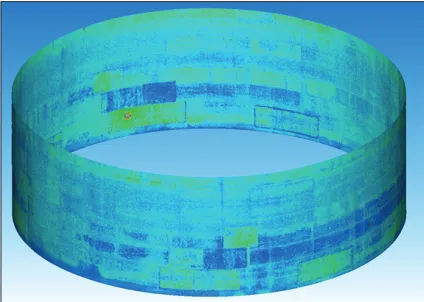
Fig.11. Surface of the tank wall with superimposed colour texture.
Fig. 12 (above). Flat map of the tank wall.
The values of the maximum equivalent stresses seqv in the VST-10000 and
VSTP-50000 tank wall rings are given in Tables 3 and 4.
In order to determine actual local tank wall deviations from the vertical, JSC Transneft-Diascan developed during technical diagnostics work a software module (implemented within 3D Reshaper environment) for computer-aided detecting and determining parameters of local deviation
from the tank design shape. This enables local geometric wall defects in inaccessible areas and defects such as weld ‘angularity’ to be examined using a template computer model.
The necessity of monitoring the tank wall both vertically and horizontally was taken into account when developing a software monitoring method for actual local deviations of the wall geometry from design. In order to locate unacceptable deviations, the actual surface of the tank wall (Fig.11) was transformed into a 3D surface mapped onto a plane, which displays all the irregularities of the tank wall without taking into account its radial curvature (Fig.12).
After this, cross-sections of the surface were plotted vertically and horizontally in automatic mode. These sections were automatically constructed in the 3D Reshaper program with predefined increments (Fig. 13).
To find local tank wall deviations from the designed shape, the following data must be entered into the program:
•
• length of the template used to check for local deviations;
• the permissible deviation from the design shape (i.e. from the template); • the increment with which the programme will shift the virtual template.
The values of the cross-section construction step and the virtual template moving step determine the duration of the computer operation to find deviations.
At the second stage of the program’s work, a virtual line of a template of a given length was drawn, and the distance was calculated from the surface represented by triangle edges (Fig.14). This operation is repeated sequentially for each cross-section with the virtual template line shifted at the specified increment.
At the third stage, points further than the permissible distance from the virtual template were visualised. These points were coloured dark blue, if there were impermissible local wall deviations inside the tank, and red if there were impermissible local wall deviations outside the tank for the vertical template. Such points were coloured light blue and orange respectively for the horizontal template (Fig.15).
At the final fourth stage, the necessary information about impermissible local deviations was exported into CSV files.
The result of exporting data into CSV format is a file with a set of points described by parameters such as coordinates on the mapped tank wall (X, Y) and the value of impermissible local deviations from the design shape (N).
Using these data, the following curves can be plotted using Excel software:
• a curve representing the position of points on a plane (X, Y); • a curve representing impermissible horizontal deviations (N, X); Fig.14. Visual representation of the calculation of the
distance from the surface to the virtual template.
• a curve representing impermissible vertical deviations (N, Y).
Using these curves and data filtering, it is possible to search for the maximum values of local deviations of each defect from the design shape. In this case, the horizontal X and vertical Y point coordinates determine the position from the origin of coordinates taken when mapping the tank wall.
Results from the software module developed were verified by comparing the results of local geometric wall defect measurements obtained from the program module with measurements of local deviations in the first and / or second ring of the tank. A calibrated reel steel tape (to find the local deviation in the tank wall), 300-mm metal ruler, a vertical measuring rod and 1000-mm long horizontal radius gauge were used for the verification. The actual deviations of the local deformation depth in the tank wall are within ± 2 mm. These values were obtained from the results of the tank wall surface data processing using additional module for 3DReshaper software, and from the results of instrumental measurements.
5. Conclusions
The conducted work allowed the following recommendations to be made:
1. The following scanning resolutions can be recommended for constructing models and for calculating the stress-strain state of the tank walls by finite element methods, to guarantee acceptably accurate calculations and to reduce processing time:
2. When the scanner distance from the top ring of the tank is no more than 7 m, a resolution of at least 6.3 mm should be chosen at a distance of up to 10 m between the scanner and the object. When the scanner distance from the top ring of the tank exceeds 7 m, a resolution of at least 3.2 mm should be chosen at a distance up to 10 m between the scanner and the object. If the scanning data need to be improved, the resolution should be increased (up to 3.2; 1.6 mm);
3. The software module developed (and implemented within 3D Reshaper) for сomputer-aided detecting and determining parameters of local deviation from the tank design shape has demonstrated sufficient reliability of results when compared with tanks measurements made by full-size templates during construction. This software enables monitoring the local geometric wall defects in inaccessible areas and defects such as welded joint “‘angularity’” using a template computer model;
4. In 2014-2017, as part of research programmes conducted by PJSC Transneft and the Pipeline Transport Institute, LLC, together with Gubkin National Research University and JSC Transneft-Diascan, the work was carried out to study the possibility of using SLS for monitoring the geometric parameters of tanks during construction, repair and technical diagnostics. Based on the results of this work, the following corporate technical standards were developed and brought into force:
RD-23.020.00-KTN-017-15: Trunk pipeline transportation of oil and oil products. Tank laser scanning. General provisions”;
OR -23.020.00-KTN-065-16: Trunk pipeline transportation of oil and oil products. Methodology for monitoring geometrical parameters of tanks at PJSC Transneft using three-dimensional surface laser scanning during construction and repair.
These documents contain:
• monitoring procedures for tank geometric parameters using the SLS method;
• recommendations on the use of tank SLS data for computer modelling when conducting strength calculations and evaluating the stress-strain state of tank structures;
other defects such as welded joint ‘angularity’.
5. The application of SLS data as an additional criterion for technical diagnostics of oil terminal tank farms for constructing computer models of tank structures obtained from SLS data significantly increases the reliability of calculations and makes it possible to determine the timeframe for their further accident-free operation with higher level of confidence.
Conflicts of interest
All authors have no conflicts of interest to declare.
References
[1] Safety Guidelines: Recommendations for the technical diagnostics of welded vertical cylindrical tanks for oil and oil products” (approved by order of the Federal Service for Environmental, Technological and Nuclear Oversight of Russia (Rostekhnadzor), No.520, 6 November, 2013).
[2] RD-23.020.00-KTN-141-16: Trunk pipeline transportation of oil and oil products. Rules for tanks technical diagnostics.
[3] RD-23.020.00-KTN-017-15: Trunk pipeline transportation of oil and oil products. Tanks laser scanning. General provisions.
[4] OR-23.020.00-KTN-065-16: Trunk pipeline transportation of oil and oil products. Methodology for monitoring geometrical parameters of tanks at JSC Transneft using three-dimensional surface laser scanning during construction and repair.
[5] G.G. Vasiliev et al., 2014. The use of surface laser scanning in the oil and gas industry. Science and Technology: Oil And Oil Products Pipeline Transportation, 4, 16, pp 47-51.
[6] G.G. Vasiliev, at al., 2015. The work of 3D laser scanning for VSTP-20000. Science and Technology: Oil And Oil Products Pipeline Transportation, 1, 17, pp 54-59.
[7] G.G. Vasiliev, et al., 2015. Analysis of the practice of using three-dimensional laser scanning at the facilities of JSC Transneft. Science And Technology: Oil and Oil Products Pipeline Transportation, 2, 18), pp 48-55.
[8] ECE/CP.TEIA/28 Safety guidelines and good industry practices for oil terminals, United Nations Economic Commission for Europe, 2015.
[9] API STD 653-2009: Tank Inspection, Repair, Alteration, and Reconstruction. [10] API RP 579: Fitness-for-Service.