Published by the
Iranian Chemical Society
Anal. Bioanal. Chem. Res., Vol. 4, No. 2, 329-339, December 2017.
Determination of Cadmium by Electrothermal Atomic Absorption Spectrometry
after its Separation and Preconcentration by Syringe to Syringe Dispersive Liquid
Phase Microextraction-Solidified Floating Organic Drop
Mohammad Asadi, Shayessteh Dadfarnia* and Ali Mohammad Haji Shabani
Department of Chemistry, Yazd University, Yazd, Iran
Address correspondence to Shayessteh Dadfarnia, Department of Chemistry, Yazd University, Yazd, 89195-741, Iran (Received 29 April 2017, Accepted 23 July 2017)
The application of syringe to syringe dispersive liquid phase microextraction-solidified floating organic drop was extended for the separation and preconcentration of trace amounts of cadmium ions from water and cereal samples. The extracted cadmium was quantified by electrothermal atomic absorption spectrometry. Factors affecting the complex formation as well as microextraction efficiency such as the concentration of dithizone as the chelating agent, sample pH, type and volume of the extractant, number of injections, ionic strength and sample volume were optimized. Under optimized conditions, the calibration curve was linear in the range of 1.0-14.0 ng l-1 with the coefficient of determination of 0.9994. The limit of detection and quantification were found to be 0.25 and 0.85 ng l-1, respectively. The inter-day and intra-day precision at two concentration levels (3.0 and 10.0 ng l-1) were in the range of 3.9-9.2%. The accuracy of the developed method was evaluated through recovery experiments and the analysis of certified reference material (SLRS-6).
Keywords: Cadmium, Syringe to syringe dispersive liquid phase microextraction, Solidified floating organic drop, Electrothermal atomic absorption spectrometry
INTRODUCTION
Cadmium is a toxic element which can damage organs such as liver, kidneys, and lungs even at trace concentration level [1]. It enters the human body through water and food chain. Thus, the monitoring and determination of trace amounts of cadmium in water and food samples is a significant task [2]. Different analytical techniques such as flame atomic absorption spectrometry (FAAS) [3], electrothermal atomic absorption spectrometry (ETAAS) [4], UV-Vis spectrophotometry [5], and inductively coupled plasma mass spectrometry (ICP-MS) [6] have been used for the determination of cadmium in various samples. However, because of low concentration of cadmium in food and environmental samples and complexity of these matrices, its direct determination by instrumental analysis is difficult
*Corresponding author. E-mail: [email protected]
rapidly injected into the aqueous sample, resulted in the formation of fine droplets of extractant in the aqueous sample and thereby an increase in the contact area between the extractant and sample solution. The main advantages of DLPME are rapidity, simplicity, low cost, high efficiency and the use of the low volume of organic solvent. However, the use of the dispersing solvent in DLPME may cause an increase in the solubility of the organic solvent in the sample solution as well as the decrease in the partition coefficients of analytes between the aqueous and organic phases. To alleviate these limitations, new modes of DLPME called stirrer assisted dispersive liquid phase microextraction [16], ultrasonic-assisted dispersive liquid phase microextraction [17], and vortex assisted dispersive liquid phase microextraction [18] have been developed. In these modes of DLPME, the dispersive solvent is eliminated, and the extractant is dispersed in the aqueous sample by the use of ultrasound radiation, stirrer, and vortex energy, respectively. However, these modes of DLPME need longer extraction time than the conventional DLPME and also in the case of ultrasonic-assisted DLPME; there is the possibility of degradation of the analyte or its complex by ultrasonic energy. Recently, a new mode of DLPME called syringe to syringe dispersive liquid phase microextraction-solidified floating organic drop (SS-DLPME-SFOD) for the extraction of albendazole and triclabendazole drugs before their quantification by high performance liquid phase chromatography was introduced [19]. In this mode of DLPME, two disposal syringes are connected to each other through one needle and are used as the extraction vessel. The sample solution and the extraction solvent are put in one syringe and then it is connected to the second syringe. The solvent is simply dispersed in the aqueous phase by several injections and back injections of the mixture until the extractant is thoroughly mixed with aqueous sample and equilibrium is achieved. Finally, the mixture is transferred to a centrifuge tube; the phases are separated by the mean of centrifugation, and the extract is easily recovered through solidification in an ice bath. In this mode of DLPME, the extraction is done in a closed system which minimized the loss of the extraction solvent by evaporation and reduced the harmful effects of hazardous analytes and toxic organic solvents on the operator and the environment. Furthermore, it does not require a dispersive
solvent, vortex mixer or ultrasound bath.
In this study, the application of SS-DLPME-SFOD is extended toward the inorganic ions and a method is
developed for the separation and preconcentration of trace amounts of cadmium ions from various matrices using dithizone as the chelating agent. The extracted cadmium is then determined by electrothermal atomic absorption spectrometry (ETAAS).
EXPERIMENTAL
Reagents
Dithizone, sodium chloride, 1-dodecanol, 1-decanol, 1,10-dichlorodecane and 1-undecanol (analytical grade) were provided from Merck (Darmstadt, Germany). The stock standard solution of cadmium (1000 mg l-1) was purchased from Merck (Darmstadt, Germany). Working standard solutions were prepared daily by dilution of the stock solution with deionized water. The river water certified reference material (SLRS-6) was from the National Research Council of Canada.
Instrumentation
An atomic absorption spectrophotometer (Shimadzu, Model 670G, Japan) equipped with a cadmium hollow-cathode lamp (Hamamatsu Photonics, Shizuoka, Japan) and a pyrolytically coated graphite tube (Shimadzu) was used for cadmium determination. The analytical wavelength, lamp current, spectrum bandwidth, and injection volume were 228.8 nm, 8 mA, 0.7 nm and 20 µl, respectively. The furnace program was optimized and is summarized in Table 1. Peak height measurement was used for all quantifications.
Procedure
and the extraction system was assembled. The mixture (sample solution and extractant) in the syringe 1 was rapidly injected into the syringe 2 followed by back injection of the mixture into syringe 1. The injection and back injection procedure were repeated seven times, during which the cadmium ions reacted with DTZ and formed a complex which extracted into 1-dodecanol. The mixture was then transferred into a closed centrifugal tube and centrifuged for four minutes at 5000 rpm. Then, the tube containing the mixture was placed in an ice bath where the extract was solidified in about 5 min. The solidified solvent was collected, transferred into a conical tube and melted immediately at room temperature. Finally, 20 µl of the extractant was manually injected into the graphite tube of electrothermal atomic absorption spectrometer for quantification of the analyte.
Sample Preparation
Water samples. Tap water and packed water (Mashhad, Iran) were filtered through a Millipore 0.45 µm pore size filter. After pH adjustment, the sample was treated according to extraction method.
Cereal Samples
The cereal samples (rice, barley, bean, and sesame) were collected from the several markets in Mashhad (Iran) and 100 g of each sample was milled. After that, for digestion of
cereal samples [20]. 1.0 g of each sample was weighed into a beaker and 6,0 ml concentrated HNO3 (65%) was added to it. The mixture was placed on a hot plate and boiled until the volume was reduced to about 2 ml. The residue was cooled to room temperature, 5 ml of concentrated HCl was added to the mixture and was heated to near dryness. Then, 6 ml of deionized water was added and the mixture was filtered through a Millipore 0.45 µm pore size filter. Finally, the sample pH was adjusted to 8.0, and the cadmium was extracted and determined according to the given method.
Calculations
The enhancement factor (EF) was calculated as the ratio of the slopes of calibration curves plotted (0.0563) with and without extraction (0.0003). The extraction recovery (ER) was determined according to the following equation:
% 100
aq org V V EF
ER (1)
where Vorg and Vaq are the volumes of the organic and the aqueous phase, respectively [21]. The recovery (R%) of the developed method was calculated using the following equations: 100 % add real final C C C
R (2)
Table 1. Temperature Program of Electrothermal Atomic Absorption Spectrometry for Determination of Cadmium
Step Temperature
(°C)
Time
(s)
Argon flow rate
(l min-1)
Drying 80 5 2.0
Drying 95 20 2.0
Drying 270 8 2.0
Ashing 400 20 2.0
Atomizing 2000 4 0
where Creal, Cadd, and Cfinal are the initial concentration of the cadmium in the sample, the amount of cadmium spiked, and the concentration of the cadmium determined in the spiked sample using the developed method, respectively.
RESULTS AND DISCUSSION
To obtain high recovery and enhancement factor, various factors influencing the extraction efficiency such as the nature and volume of the extraction solvent, sample pH, concentration of DTZ, ionic strength, the number of dispersion, and sample volume were optimized by the univariable method. Each experiment was repeated three times, and the average and the standard deviation were reported.
Effect of Sample pH
The sample pH usually has a significant role in the formation, selectivity, and extractability of a metal-ligand complex. Therefore, the effect of the sample pH on the complex formation and extraction of Cd ions with DTZ was examined by varying the pH in the range of 3.0-11.0 while keeping the other experimental parameters constant. The results (Fig. 1) showed that the extraction recovery is increased by an increase in the pH of the solution up to 7.5, remained constant up to 9.0 and then it is slightly decreased by a further increase in the pH. The decrease in extraction efficiency at low pHs is due to the incomplete complex formation of Cd ions and DTZ, whereas the decrease in absorption at high pHs can be related to the precipitation of Cd ions as cadmium hydroxide. Thus, a pH = 8 was chosen as the best pH for further experiments.
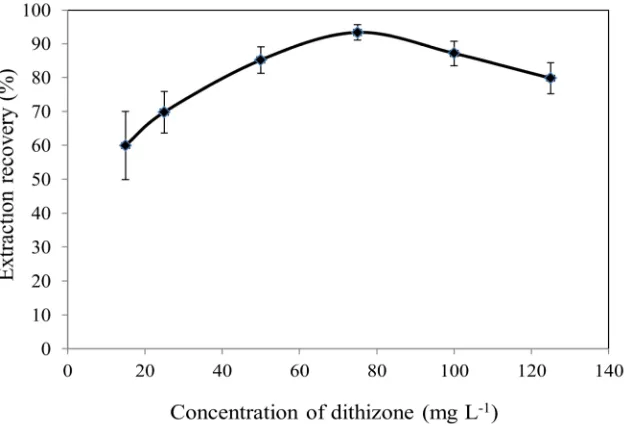
Effect of Dithizone Concentration
DTZ which form a 2:1 complex with cadmium(II) in neutral to alkaline media was selected as the chelating agent for the extraction of Cd(II). To find the optimum amount of the DTZ for the quantitative extraction of cadmium, experiments were performed with different concentrations of DTZ in 1-dodecanol (15 to 125 mg l-1) at other constant experimental conditions. The results (Fig. 2) indicated that the extraction recovery increased and reaches a maximum by an increase in the dithizone concentration up to 75 mg l-1. The slight variation in the extraction recoveries at higher
concentration of DTZ can be related to the increase in the background absorption. Thus, a dithizone concentration of 75 mg l-1 was chosen for further experiments.
Effect of the Nature and Volume of Extractant
The nature of the extraction solvent may influence the performance of the SS-DLPME-SFOD. The extraction solvent should have a high affinity for the complex, low solubility in the aqueous phase, a density lower than water and a melting point close to the room temperature. Thus, based on these criteria, several solvents including undecanol, dodecanol, 1,10-dichlorodecane, and 1-decanol were selected and the effect of nature of extractant on the extraction efficiency of developed method was studied. The results (Table 2) revealed that with 1-dodecanol the extraction recovery was higher than the other studied organic solvents. This observation can be related to the lower polarity of 1-dodecanol which results in higher affinity for the lipophilic complex of Cd-DTZ in compared to the other solvents. Thus, 1-dodecanol was chosen as the extraction solvent.
The effect of volume of the organic solvent on the extraction efficiency of the method was studied by performing several experiments with different volumes of 1-dodecanol (30, 40, 50 and 60 µl). The results revealed that the extraction recovery of Cd decreased proportionally to the increase in the extractant volume. An extractant volume less than 30 µl was not used due to the difficulty in the recovery of the extractant after extraction. Consequently, 30 µl of 1-dodecanol was chosen as the optimized extractant volume in subsequent experiments.
Effect of Ionic Strength
Fig. 1. Effect of the sample pH on the extraction recovery of cadmium. Conditions: cadmium concentration, 10 ng l-1; dithizone concentration, 75 mg l-1; sample volume, 6 ml; extraction solvent, 1-dodecanol (30 µl); number of injections, seven times.
Effect of Number of Injection and Back Injection
In SS-DLPME-SFOD, an organic solvent is dispersed in the aqueous sample in a closed system through several injections and back injections of the mixture of the sample and extractant in two medical syringes connected by a gauge needle [19]. So, the number of injection has an
important role in the extraction recovery of analyte as well as the speed of SS-DLPME-SFOD. For this purpose, several experiments were performed with varying the number of injection between 1 to 9 under the other optimized conditions. The results revealed that the extraction recovery of Cd(II)-dithizone complex was increased up to 7 injection
Table 2. Effect of the Nature of Solvent on the Extraction Recovery of Cadmium
Extraction solvent Melting point
(ºC)
Dielectric constant Extraction recovery
(%)
1-Dodecanol 22-24 5.82 93.1 ± 2.4
1-Undecanol 13-15 5.98 90.8 ± 3.6
1,10-Dichlorodecane 14-16 6.68 87.9 ± 4.5
1-Decanol 6-7 7.93 85.1 ± 3.1
Conditions: sample pH, 8.0; cadmium concentration, 10 ng l-1; dithizone concentration, 75 mg l-1; sample volume, 6 ml; volume of extraction solvent, 30 µl; number of injections, seven times.
Table 3. Effect of Interfering Ions for the Determination of Cadmium (10 ng l-1)
Interfering ions Molar ratio (Interfering ion/cadmium(II)) Recovery
(%)
Al3+ 500 98.9
Fe3+ 1000 101.1
Mn2+ 1000 98.9
Zn2+ 700 97.5
Cu2+ 500 96.8
Co2+ 500 98.9
Pb2+ 1000 97.8
Ni2+ 500 98.1
Ca2+ 1000 97.8
Mg2+ 1000 103.2
K+ 1000 98.9
SO42- 1000 101.9
NO3- 1000 102.8
Table 4. Precision of the Microextraction Method for the Determination of Cadmium in Spiked Blank Real Samples
Matrix Cadmium
Inter-day assay (RSD%, n = 3) Intra-day assay ( RSD%, n = 5)
3.0 10.0 3.0 10.0
Tap water (ng l-1) 7.9 6.9 4.6 5.0
Packed water (ng l-1) 7.9 7.4 5.9 3.9
Rice (ng kg-1) 9.0 8.0 5.1 6.3
Bean (ng kg-1) 9.2 9.0 6.0 5.8
Barley (ng kg-1) 8.8 7.9 5.8 6.0
and back injection cycles and then leveled off. Thus, the equilibrium is achieved after seven successive injections and back injections.
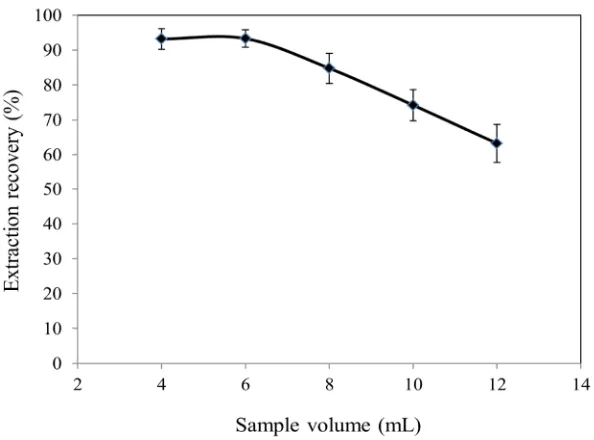
Effect of Sample Volume
Demonstrating the ability of the extraction method for separation and preconcentration of low amounts of the analyte is an important task. An increase in the sample volume causes an increase in the preconcentration factor but it may retard the extraction efficiency due to improper convection of the mixture during the extraction procedure.
Thus, to study the influence of sample volume on the extraction efficiency of the method, experiments were carried out using different sample volumes (3-10 ml) containing 0.06 ng of Cd. The results (Fig. 3) showed that the extraction recovery was maximum and constant up to 6 ml and decreased by a further increase in the sample volume. Hence, 6 ml was chosen as the optimum volume of the sample for the extraction.
Effect of Interfering Ions
The effects of potential ions usually present in real
Table 5. Determination of Cadmium in Different Matrices (n = 3)
Sample Added Found Recovery
(%)
- 4.10 ± 0.15 -
3 7.02 ± 0.23 97.3
Tap water (ng l-1)
10 13.98 ± 0.52 98.8
- 3.70 ± 0.11 -
3 6.75 ± 0.26 101.7
Packed water (ng l-1)
10 13.57 ± 0.55 98.7
- 3.84 ± 0.11 -
3 6.78 ± 0.26 98.0
Rice (ng kg-1)
10 13.98 ± 0.81 101.4
- 2.20 ± 0.09 -
3 5.12 ± 0.10 97.3
Bean (ng kg-1)
10 12.38 ± 0.52 101.8
- 3.40 ± 0.15 -
3 6.39 ± 0.22 99.6
Barely (ng kg-1)
10 13.55 ± 0.52 101.5
- 2.38 ± 0.13 -
3 5.41 ± 0.28 101.0
Sesame (ng kg-1)
samples on the extraction and determination of Cd by the developed method were examined, and the results are summarized in Table 3. For this aim, 6.0 ml of the sample solution contains 10 ng l-1 of Cd, and interfering ions at an initial molar ratio of 1000 was subjected to the given procedure. The tolerance limit was set as the largest
amounts of ions making a variation of less than 5% in the
recovery of the analyte. The results indicated that at the
mole ratio given in the table, the presence of the ions has no
significant effect on the extraction and determination of
cadmium.
Table 6. Comparison of the Developed Method with other Microextraction Methods for Cadmium
RSD
(%)
Analytical technique Sample
Inter-day
Intra-day
LOD
(ng l-1)
LDR
(ng l-1)
EF Ref.
VALLME-FAAS Water and apple - 4.1 2900 10000-250000 35 [3]
USAEME-GFAAS Herbal medicine - 8.0 30 50-20000 70 [4]
DLLME-FAAS Water and food - 4.2 13000 20000-300000 80 [14]
UASEME-SFO-FAAS
Water and tea - 1.98 110 300-100000 64 [17]
MSPE-FAAS Water and hair - 2.1 110 400-18000 96 [22]
SA-DLSME-FASS Rice and wheat 4.5-5.5 3.0-4.3 1300 5000-250000 37 [23]
VSLLME-SFO-FAAS
Water - 3.2 160 500-30000 38 [24]
DES-MNPs-FAAS Water and hair - 2.1 100 500-30000 100 [25]
NDILME-GFAAS Water - 3.8 0.5 20-150 150 [26]
SS-DLPME-SFOD-GFAAS
Water and cereals <9.2 <6.5 0.25 1.0-14.0 187 This
work
Analytical Figures of Merit
The figures of merit of the developed method were evaluated under the optimized conditions. The calibration curve was linear in the range of 1.0-14.0 ng l-1 of cadmium with the equation of A = 0.0563C + 0.0265 (where A is the absorbance, and C is the concentration of Cd in ng l-1) and R2 = 0.9994. The limits of detection (LOD) and quantification (LOQ) of the method defined as the 3 and 10 times of Sb/m (where Sb is the standard deviation of the blank signals and m is the slope of calibration curve after extraction) were found to be 0.25 and 0.85 ng l-1, respectively. The enhancement factor and extraction recovery were 187 and 93%, respectively. The closeness of the enhancement factor to preconcentration factor (200) reveals that the extraction is almost quantitative. The intra-day (n = 5) and inter-intra-day (n = 3) relative standard deviations were calculated by determination of Cd in blank samples, spiked at two concentration levels (3.0 and 10.0 ng l-1). The results are summarized in Table 4 indicating the high precision of the method for analysis of real samples.
Determination of Cadmium in Real Samples
The SS-DLPME-SFOD-ETAAS method was applied to the extraction and determination of Cd in real samples. The accuracy of the method was checked through the recovery experiments and the analysis of certified reference material of river water (SLRS-6). The results (Table 5) showed that the recoveries of samples spiked at two concentrations levels of Cd (3.0 and 10 ng l-1) were in the range of 97 to 102%. Furthermore, the amount of cadmium in the certified reference material sample was found to be 6.41 ± 0.42 ng l-1 which at 95% confidence level was in agreement with the accepted value of 6.3 ± 1.4 ng l-1. Thus, the present method provides acceptable recoveries and accuracy for the determination of Cd in the sample type examined.
Comparison of the Developed Method with Other
Microextraction Methods
A comparison of the proposed method (SS-DLPME-SFOD-ETAAS) with recently reported microextraction methods for the separation and determination of Cd are summarized in Table 6 [22-26]. It shows that the enhancement factor of proposed method was higher, its detection limit was lower, and its precision is comparable to
other methods. Also, the method applies to the determination of cadmium in a wider range of real samples.
CONCLUSIONS
For the first time, the capability of the combination of a syringe to syringe dispersive liquid phase microextraction-solidified floating organic drop method with electrothermal atomic absorption spectrometry was demonstrated, and a reliable microextraction method for trace enrichment of Cd in water and cereal samples was developed. The SS-DLPME-SFOD method is performed in a closed system and provides low detection limit, good precision, and accuracy as well as a high enhancement factor. The major advantages of the developed method are simplicity, rapidity, low cost, and low toxicity without any need to dispersive solvent or specific instruments such as ultrasonic bath, vortex mixer, or magnetic stirrer.
REFERENCES
[1] J.B.B. Da Silva, D.L.G. Borges, M.AM. S. da Veiga, A.J. Curtius, B. Welz, Talanta 60 (2003) 977. [2] X.D. Wen, P. Wu, L. Chen, X.D. Hou, Anal. Chim.
Acta 650 (2009) 33.
[3] M. Chamsaz, A. Atarodi, M. Eftekhari, S. Asadpour, M. Adibi, J. Adv. Res. 4 (2013) 35.
[4] M. Aghamohammadi, M. Faraji, P. Shahdousti, H. Kalhora, A. Salehb, Phytochem. Analysis 26 (2015) 209.
[5] V. Podgaiskytė, P. Vaitiekūnas, J. Environ. Eng. Landsc. 17 (2009) 219.
[6] D. Pozebon, V.L. Dressler, A.J. Curtius, J. Anal. At. Spectrom. 13 (1998) 363.
[7] S. Dadfarnia, A.M. Haji Shabani, Anal. Chim. Acta 658 (2010) 107.
[8] M.A. Jeannot, F.F. Cantwell, Anal. Chem. 68 (1996) 2236.
[9] M. Enteshari, A. Mohammadi, K. Nayebzadeh, E. Azadniya, Food Anal. Methods 7 (2014) 438. [10] M. Adibmehr, H. Bagheri Sadeghi, Sh. Dehghan
Abkenar Anal. Bioanal. Chem. Res. 1 (2014) 20. [11] C. Zeng, M. Li, Q. Xie, H. Yan, X. Zhang, Spectrosc.
[12] M. Asadi, S. Dadfarnia, A.M. Haji Shabani, B. Abbasi, J. Sep. Sci. 38 (2015) 2510.
[13] M. Shamsipur, M. Ramezani, M. Sadeghi, Microchim. Acta 166 (2009) 235.
[14] C.B. Ojeda, F. Sánchez Rojas, Sample Prep. 2 (2014) 13.
[15] A. Daneshfar, R. Tabaraki, R. Khodakarami, T. Khezeli, Anal. Bioanal. Chem. Res. 3 (2016) 41. [16] Naeemullah, T.G. Kazi, M. Tuzen, Food Chem. 172
(2015) 161.
[17] M. Ezoddin, T. Taghizadeh, B. Majidi, Environ. Technol. 35 (2014) 2401.
[18] M. Asadi, A.M. Haji Shabani, S. Dadfarnia, B. Abbasi, J. Chromatogr. A 1425 (2015) 17.
[19] M. Asadi, S. Dadfarnia, A.M. Haji Shabani, Anal. Chim. Acta 932 (2016) 22.
[20] Association of Analytical Chemists (AOAC), 2005. AOAC Official Method 985.16.
[21] N. Shokoufi, F. Shemirani, Y. Assadi, Anal. Chim. Acta 597 (2007) 349.
[22] N. Baghban, A.M. Haji Shabani, S. Dadfarnia, Int. J. Environ. Anal. Chem. 93 (2012) 1367.
[23] H. Kahe, M. Chamsaz, G.H. Rounaghi, Food Anal. Methods 9 (2016) 2887.
[24] G. Peng, Y. Lu, Q. He, D. Mmereki, X. Tang, Z. Zhong, X. Zhao, Water Sci. Technol. 73 (2016) 2781.
[25] M. Karimi, A.M. Haji Shabani, S. Dadfarnia, Microchim. Acta 183 (2016) 563.