Ram´
on Aranda
1,3and Hugo Carlos
2,31
Centro de Investigaci´on Cientifica y de Educaci´on Superior de Ensenada, Unidad de Transferencia Tecnol´ogica (CICESE–UT3); Tepic, Nayarit, M´exico.
2
Centro de Investigaci´on en Ciencias de Informaci´on Geoespacial. 3 C´atedras del Consejo Nacional de Ciencia y Tecnolog´ıa (CONACYT), M´exico.
[email protected] [email protected]
Abstract
Fishing is an ancient practice that dates back to at least the beginning of the Upper Paleolithic period about 40,000 years ago. Nowadays, Fishing is one of the most important activities, as it provides a source of food and economic income worldwide. A key challenge in ecology and conservation is to decrease the Illegal, Unreported and Unregulated fishing (IUU). IUU fishing depletes fish stocks, destroys marine habitats, distorts competition, puts honest fishers at an unfair disadvantage, and weakens coastal communities, particu-larly in developing countries. One strategy to decrease the IUU fishing is monitoring and detecting the fishing vessel behaviors. Satellite–based Automatic Information Systems (S– AIS) are now commonly installed on most ocean–going vessels and have been proposed as a novel tool to explore the movements of fishing fleets in near real time. In this article, we present a dictionary–based method to classify, by using AIS data, between two fishing gear types: trawl and purse seine. The data was obtained from Global Fishing Watch. Our experiments show that our proposal has a good performance in classifying fishing be-haviors, which could help to prevent overexploit and improve the strategies of the fisheries management.
Keywords: AIS, Fishing gear, Dictionary model, Pattern Detection.
1
Introduction
According to the document “Estado Mundial de la Pesca y la Acuicultura, 2018” [5], illicit fishing represents up to 26 million tons of fish per year, more than 15% of the world’s an-nual production. The deficiency of some legal laws, together with the lack of vigilance, lack of implementation of management measures, among others, have hampered the fight against Illegal, Unreported and Unregulated (IUU) fishing. IUU fishing depletes fish stocks, destroys marine habitats, distorts competition, puts honest fishers at an unfair disadvantage, and weak-ens coastal communities, particularly in developing countries. IUU fishing constitutes a threat to the sustainability of the fishing sector globally, in ecological terms, economic cost, and in
(c) (d)
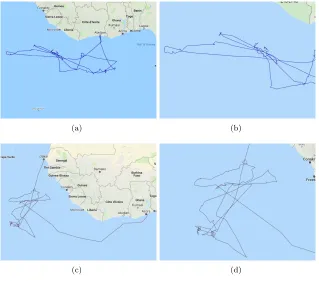
Figure 1: (a) and (c) Lines interpolated representation of raw S–AIS tracks for two individual vessel by using purse seine fishing gear; (b) and (d) more fine–scale of track fishing behavior for a purse seiner of tracks in (a) and (c), respectively..
general of an important source of food and income, as well as the impact on communities that depend on this activity (FAO, 2017). Also, IUU fishing effects directly eco–tourism activities due to it impacts natural habits [6].
The Sustainable Development Goals (SDG) of the United Nations set a goal for marine fisheries: ”By 2020, effectively regulate fishing exploitation and stop overfishing, illegal fishing, undeclared fishing and unregulated and destructive fishing practices, and apply scientifically based management plans in order to restore fish stocks in the shortest time possible, at least reaching levels that can produce the maximum sustainable yield according to their biological characteristics”. To accomplish this goal, it is necessary many efforts in different areas, one of this is the artificial intelligence to analyze data and see the problem from other perspective.
One strategy to decrease the IUU fishing is monitoring the fishing boats and vessel to determine their behaviors. Satellite–based Automatic Information Systems (S–AIS) are now commonly installed on most ocean–going vessels and have been proposed as a novel tool to explore the movements of fishing fleets in near real time. In contrast, one disadvantage is the poor knowledge about general fishing behaviors of boats and vessels, only there are researches for specific fishing gears [8,4,9]
(a) (b)
(c) (d)
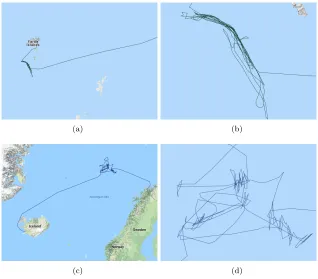
Figure 2: (a) and (c) Lines interpolated representation of raw S–AIS tracks for two individual vessel by using trawl fishing gear; (b) and (d) more fine–scale of track fishing behavior for a trawler of tracks in (a) and (c), respectively.
learning strategy that extracts the features of the vessel tracks by analyzing AIS data. Thus, the extracted features are represented by means of normalized histograms. Then, the normalized histograms are used to generate a learned dictionary to represent each fishing gear.
2
Dictionary–based method
Our method uses a supervised machine learning strategy that extracts the features of the vessel tracks by analyzing AIS data. Thus, the extracted features are represented by means of nor-malized histograms. For this reason, we basically consider a track vessel as the curve described by the vessel when it moves. The sampling of the trajectory implies a step of discretization, i.e., the division of this continuous curve into a number of discrete “steps” connecting successive relocations of the vessel, similar to [13]. Two main classes of trajectories can be distinguished:
• Trajectories of type Iare characterized by the fact that the time is not precisely know or not taken into account for the relocations of the trajectory;
(c) (d)
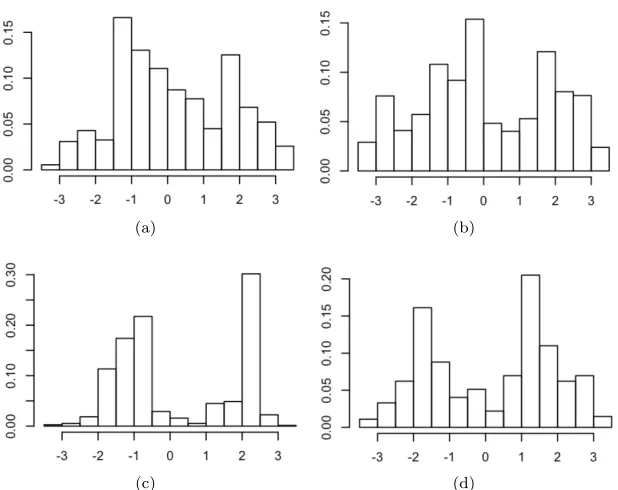
Figure 3: (a) and (b) Histograms of the absolute angle for tracks in Figure 1 (purse seine fishing gear); (c) and (d) Histograms of theabsolute angle for tracks in Figure2(trawl fishing gear).
Clearly, track vessels by AIS data information are trajectories type II. A good description of the trajectory can be achieved with the estimation of a minimum set of relatively easily measured parameters.
In our case, we have chosen to characterize all the trajectories by means of the absolute angleσibetween thexdirection and the step built by relocationskandk+ 1 [7]. To compute this parameter, we particularly use the implementation in [3]. After computing the absolute angle, we compute the normalized histograms of them to characterize a compete track. Then, we can generate supervised learning dictionary to represent each fishing gear as the average of normalized histograms labeled by fishing gear. In our case, we have two normalized histograms in our learned dictionary Φ. Finally, to determine if a track is member of one fishing gear class, we use the Nearest Neighbor [12]. The computation of the distances is made by the Earth Mover’s Distance (EMD) [11, 10] between the track and each element of our dictionary. The EMD is explained in the next section.
2.1
Earth Mover’s Distance
(a) (b)
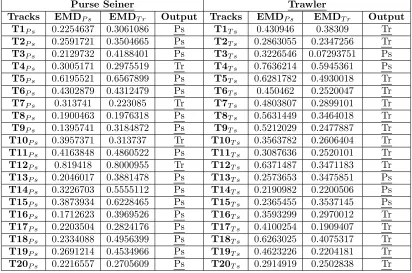
Figure 4: Learned dictionary for different type gears: (a) purse seine fishing gear; and (b) trawl fishing gear.
problem:
D(Q, J) = min x
P
i,jdijxij P
i,jxij subject to
X
j
xij ≤βi,
X
i
xij ≤αj
xij ≥0
X
i,j
xij = min
X
i βi,
X j αj . (1)
In this manner, xij denotes the transportation flows and represents the amount transported from thei−thsupply to the j−thdemand. The system of equations1is known as the Earth Mover’s Distance (EMD). The EMD is a measure which evaluates the dissimilarity between two multi–dimensional distributions in some feature space by using a distance measure between single features. This distance is defined as the minimal cost that must be paid to transform one distributions into the other.
3
Experiments
3.1
Data
For our experiments, we use AIS data available from Global Fishing Watch (GFW)[1]. Al-though, the raw AIS data are commercial data owned by Orbcomm, GFW has created a sam-ple dataset of labeled anonymized AIS data that can be used to train fishing prediction mod-els [2]. The data can be directly downloaded from https://github.com/GlobalFishingWatch/ training-data. For our experiments a total of 20 tracks by each fishing gear were used. Figures
T7P s 0.313741 0.223085 Tr T7T s 0.4803807 0.2899101 Tr
T8P s 0.1900463 0.1976318 Ps T8T s 0.5631449 0.3464018 Tr
T9P s 0.1395741 0.3184872 Ps T9T s 0.5212029 0.2477887 Tr
T10P s 0.3957371 0.313737 Tr T10T s 0.3563782 0.2606404 Tr
T11P s 0.4163848 0.4860522 Ps T11T s 0.3087636 0.2520101 Tr
T12P s 0.819418 0.8000955 Tr T12T s 0.6371487 0.3471183 Tr
T13P s 0.2046017 0.3881478 Ps T13T s 0.2573653 0.3475851 Ps
T14P s 0.3226703 0.5555112 Ps T14T s 0.2190982 0.2200506 Ps
T15P s 0.3873934 0.6228465 Ps T15T s 0.2365455 0.3537145 Ps
T16P s 0.1712623 0.3969526 Ps T16T s 0.3593299 0.2970012 Tr
T17P s 0.2203504 0.2824176 Ps T17T s 0.4100254 0.1909407 Tr
T18P s 0.2334088 0.4956399 Ps T18T s 0.6263025 0.4075317 Tr
T19P s 0.2691214 0.4534966 Ps T19T s 0.4623226 0.2204181 Tr
T20P s 0.2216557 0.2705609 Ps T20T s 0.2914919 0.2502838 Tr
the two fishing gears. Figure 3 depicts the histograms computed over of theabsolute angle for tracks in Figures 1 and 2. Note that seeing at a glance the histograms is easily distinguish between fishing gears.
3.2
Results
Before to compute the results, we first must estimate the elements of the dictionary. In our case, we compute each element taking randomly four histograms for each fishing gear type. Figure4
shows the computed dictionary for the two different type gears: purse seiner and trawler. Table
1shows the results obtained by proposal method. As we can see, the proposed method has an accuracy of out 80% for the purse seine and 75% for the trawl fishing gear.
4
Conclusions
computational cost.
References
[1] Global Fishing Watch. https://globalfishingwatch.org. 2019.
[2] Global Fishing Watch. https://globalfishingwatch.org/datasets-and-code/ais-and-other-data/. Accessed on 2019-09-1.
[3] C. Calenge. The package adehabitat for the r software: tool for the analysis of space and habitat use by animals. Ecological Modelling, 197:1035, 2006.
[4] Erico N. de Souza, Kristina Boerder, Stan Matwin, and Boris Worm. Improving fishing pattern detection from satellite ais using data mining and machine learning. PLOS ONE, 11(7):1–20, 07 2016.
[5] FAO. EL ESTADO MUNDIAL DE LA PESCA Y LA ACUICULTURA. Roma, 2018.
[6] Reinaldo Borrego Hernandez Gaspar Gonzalez Sanson. Jorge A. Angulo Valdes, Rodney Bor-rego Acevedo. Effects of tourism activities on coral reef communities in the punta frances national marine park, cuba. Rev. Invest. Mar., 28(2):159–175, 2007.
[7] L.M. Marsh and R.E. Jones. The form and consequences of random walk movement models.
Journal of Theoretical Biology, 133(1):113 – 131, 1988.
[8] M. I. Marzuki, R. Garello, R. Fablet, V. Kerbaol, and P. Gaspar. Fishing gear recognition from vms data to identify illegal fishing activities in indonesia. InOCEANS 2015 - Genova, pages 1–5, May 2015.
[9] M. I. Marzuki, P. Gaspar, R. Garello, V. Kerbaol, and R. Fablet. Fishing gear identification from vessel-monitoring-system-based fishing vessel trajectories. IEEE Journal of Oceanic Engineering, 43(3):689–699, July 2018.
[10] Ofir Pele and Michael Werman. Fast and Robust Earth Mover’s Distances. In2009 IEEE 12th
International Conference on Computer Vision, pages 460–467. IEEE, September 2009.
[11] Yossi Rubner, Carlo Tomasi, and Leonidas J. Guibas. The Earth Mover’s Distance as a Metric for Image Retrieval. International Journal of Computer Vision, 40(2):99–121, November 2000. [12] B. W. Silverman and M. C. Jones. E. fix and j.l. hodges (1951): An important contribution
to nonparametric discriminant analysis and density estimation: Commentary on fix and hodges (1951).International Statistical Review / Revue Internationale de Statistique, 57(3):233–238, 1989. [13] Peter Turchin.Quantitative Analysis of Movement: Measuring and Modeling Population