23
ِ
Determination of the Kinetic Parameters and Dynamic
Modeling of the Reactor for the Direct Conversion of
Synthesis gas to Di-methyl ether
A. Hadipour, M. Sohrabi∗
Department of Chemical Engineering, Amirkabir University of Technology, Tehran 159145, Iran.
Abstract
In the present study the reaction kinetic and dynamic modeling of the reactor for syngas transformation into dimethyl ether using a mixture of a metallic oxides (CuO, ZnO, Al2O3), and an acidic component (γ-Al2O3) as the catalyst has been investigated. A
combination of the Graff kinetic model for methanol synthesis and the Bercic model for methanol dehydration was correlated with the experimental results obtained in this study. Activity and kinetic measurements were carried out using a catalytic fixed bed micro reactor. The operating temperature range was 230-300 °C and the pressure was 8 barg. The experimental runs were performed applying a wide range of catalyst to feed ratios. A simple dynamic model for the reactor performance was developed and tested with the experimental data. The mean absolute deviation, concerning the data for the steady state conditions, was less than 8%.
Keywords: DME , kinetic parameter, fixed bed reactor, dynamic modeling
∗ - Corresponding author: E-mail: [email protected]
1. Introduction
Dimethyl ether (DME) is an intermediate in the preparation of a number of industrial chemicals. It has also found increasing ap-plication in the aerosol industry as an ozone friendly propellant. In addition, DME is used as an ultra-clean fuel for diesel engines [1-3]. Commercial production of dimethyl ether is achieved using either of the following two methods, 1) a two-step procedure consisting of methanol formation from synthesis gas followed by the dehydration of the latter, and 2) a single step process that is the direct formation of DME from synthesis gas. In comparison with the two-step method, the
single-step procedure is attracting more attention for its dramatic economic value and theoretical significance [4].
24 Iranian Journal of Chemical Engineering, Vol. 3, No. 4 I) CO + 2H2 ⇔ CH3OH (Methanol Synthesis)
II) CO2 + 3H2 ⇔ CH3OH + H2O (Methanol Synthesis) III) CO + H2O ⇔ CO2 + H2 (Water Gas Shift Reaction)
IV) 2CH3OH ⇔ CH3OCH3 + H2O (Dehydration of Methanol to DME) V) 2CO + 4H2 ⇔ CH3OCH3 + H2O (Direct Synthesis of DME)
In the present study, the reaction kinetic parameters have been determined and the dynamic modeling of reactor performance for DME synthesis from syngas has been deve-loped and correlated with the experimental results.
2. Experimental
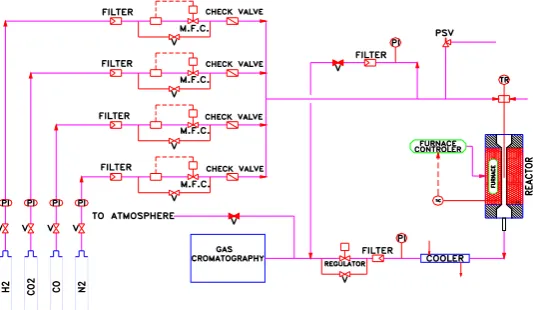
The activity of catalysts in converting synthesis gas to DME were studied under both unsteady and steady state conditions in a fixed bed flow reactor (i.d., 6.4mm and length 650 mm) connected online to a GC apparatus. The catalyst was prepared ac-cording to the procedure given in reference 6 and packed in a stainless steel tubular reactor equipped with a thermocouple placed in the catalyst bed. Experiments were performed in temperatures ranging from 230-300ºC and a constant pressure of 8 barg. Prior to catalytic testing, the samples were crushed and sieved to fine powders. In each experimental run, about 2 grams of catalyst (grain size equal to 150 μm) was loaded in the reactor having two stainless steel supports at both ends of the catalyst bed. A schematic diagram of the
experimental rig is shown in Figure 1. The reactor system was first purged with nitrogen gas and then pressurized. The catalysts were reduced in a flowing hydrogen gas diluted with nitrogen.
A mixture of 4 vol. % CO2, 32 vol. % CO and 64 vol. % H2 entered the top section of the reactor that acted as a pre-heater. Three mass flow meters (Brooks, Model 5850) and a control system were used to monitor the individual gas flow rates and to provide the required gas mixtures.
A portion of the effluent gas, after reducing its pressure by a back pressure regulator, was directed to a gas chromatograph apparatus (Agilent- 6890) connected online to the system. The effluent gas was analyzed several times with four to seven minute intervals during each experimental run. The GC column was packed with Porapak Q with 80–100 mesh. The column temperature was increased steadily from 70 to 200°C and remained at that level for 4 minutes. Helium was used as a carrier gas with a flow rate of 2.5 cm3/min. The thermal conductivity detector was applied.
Iranian Journal of Chemical Engineering, Vol. 3, No. 4 25 3. Results and discussion
The reaction has been carried out within a temperature range of 230-300 °C, 8 barg
pressure and a wide range of catalyst to feed ratios. The results are presented in Fig.2 and Tables 1-4.
0 0.05 0.1 0.15 0.2 0.25 0.3 0.35 0.4 0.45 0.5
0 100 200 300 400 500 600 700
Time (min)
% C
o
n
v
er
s
io
n
-C
O
T=230 ºC T=250 º C T=270 ºC T=300 ºC
Figure 2. Conversion of Co as a function of time (at different temperatures).
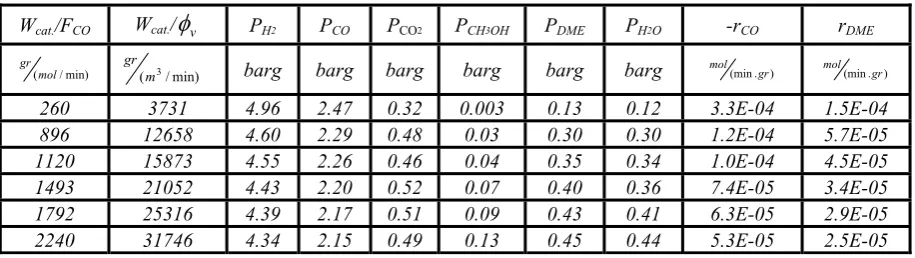
Table 1. Data for the reactor’s outlet stream at 230 °C.
rDME
-rCO
PH2O
PDME
PCH3OH
PCO2
PCO
PH2
Wcat./φv
Wcat./FCO
) . (mingr mol
) . (mingr mol barg barg
barg barg
barg barg
min) / (m3 gr min) / (mol gr
1.5E-04 3.3E-04
0.12 0.13
0.003 0.32
2.47 4.96
3731 260
5.7E-05 1.2E-04
0.30 0.30
0.03 0.48
2.29 4.60
12658 896
4.5E-05 1.0E-04
0.34 0.35
0.04 0.46
2.26 4.55
15873 1120
3.4E-05 7.4E-05
0.36 0.40
0.07 0.52
2.20 4.43
21052 1493
2.9E-05 6.3E-05
0.41 0.43
0.09 0.51
2.17 4.39
25316 1792
2.5E-05 5.3E-05
0.44 0.45
0.13 0.49
2.15 4.34
31746 2240
Table 2. Data for the reactor’s outlet stream at 250 °C.
Wcat./FCO Wcat./φv PH2 PCO PCO2 PCH3OH PDME PH2O -rCO rDME
No
min) / (mol gr
min) / (m3 gr
barg barg barg barg barg barg molmin.gr molmin.gr
1 260 3731 4.91 2.45 0.33 0.004 0.16 0.15 3.2 E-4 2.2 E-4
2 896 12658 4.47 2.21 0.50 0.04 0.40 0.38 1.3E-4 8.8E-5
3 1120 15873 4.40 2.18 0.48 0.05 0.45 0.43 1.1 E-4 7.2E-5
4 1493 21052 4.24 2.1 0.56 0.08 0.52 0.5 8.7E-5 5.5E-5
5 1792 25316 4.18 2.06 0.55 0.11 0.56 0.54 7.6E-5 4.8E-5
26 Iranian Journal of Chemical Engineering, Vol. 3, No. 4
Table 3. Data for the reactor’s outlet stream at 270 °C.
Wcat./FCO Wcat./φv PH2 PCO PCO2 PCH3OH PDME PH2O -rCO rDME
min) / (mol gr min) / (m3 gr
barg barg barg barg barg barg mol(min.gr) mol(min.gr)
260 3731 5.00 2.39 0.40 0.003 0.14 0.07 4.7E-04 2.1E-04
896 12658 4.71 2.07 0.67 0.03 0.36 0.17 1.8E-04 8.3E-05
1120 15873 4.69 2.00 0.69 0.04 0.40 0.17 1.4E-04 6.8E-05
1493 21052 4.58 1.89 0.79 0.07 0.46 0.20 1.1E-04 5.1E-05
1792 25316 4.55 1.85 0.80 0.10 0.50 0.21 9.2E-05 4.4E-05
2240 31746 4.52 1.78 0.82 0.14 0.53 0.21 7.5E-05 3.8E-05
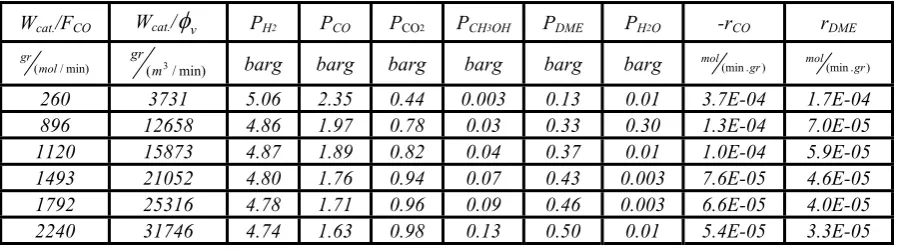
Table 4. Data for the reactor’s outlet stream at 300 °C.
Wcat./FCO Wcat./φv PH2 PCO PCO2 PCH3OH PDME PH2O -rCO rDME
min) / (mol gr min) / (m3 gr
barg barg barg barg barg barg mol(min.gr) mol(min.gr)
260 3731 5.06 2.35 0.44 0.003 0.13 0.01 3.7E-04 1.7E-04
896 12658 4.86 1.97 0.78 0.03 0.33 0.30 1.3E-04 7.0E-05
1120 15873 4.87 1.89 0.82 0.04 0.37 0.01 1.0E-04 5.9E-05
1493 21052 4.80 1.76 0.94 0.07 0.43 0.003 7.6E-05 4.6E-05
1792 25316 4.78 1.71 0.96 0.09 0.46 0.003 6.6E-05 4.0E-05
2240 31746 4.74 1.63 0.98 0.13 0.50 0.01 5.4E-05 3.3E-05
The reaction rates given in these tables were calculated, assuming the plug flow of gas in the reactor, i. e.
) ( ) ( 0 CO CO CO F W d X d r =
− (1)
⎟ ⎠ ⎞ ⎜ ⎝ ⎛ ⎟ ⎠ ⎞ ⎜ ⎝ ⎛ = v out DME DME W d RT P y d r φ . . (2)
4. Developing the Model
4-1. Kinetic study
A number of studies on syngas trans-formation into liquid hydrocarbons have been reported [10-14]. A method similar to those proposed by Graaf and Bercic for complex reactions in isothermal fixed bed micro reactors was adopted in the present
study. The Graff kinetic model has been used for the transformation of syngas to methanol, and that of Bercic has been applied in the synthesis of DME from methanol. These are as follows:
a- Graff model:
[
]
) ( ) 1 ( ) . /( . 2 2 2 2 3 2 4 2 / 1 3 2 1 2 / 1 2 / 3 1 O H H CO CO P H OH CH H CO CO P k P P k P k k P P P P k r + + + − = − (3)b- Bercic model:
4 7 2 1 6 2 2 5 ) ) ( 2 1 ( ) / . ( 2 3 2 3 O H OH CH P DME O H OH CH DME P k P k K P P P k r + + − − = (4)
para-Iranian Journal of Chemical Engineering, Vol. 3, No. 4 27 meters involved minimization of error. Using
the nonlinear regression analysis and ap-plying the results presented in Tables 1-4 to
the relations 3 and 4, the kinetic parameters have been calculated. These are given in Table 5.
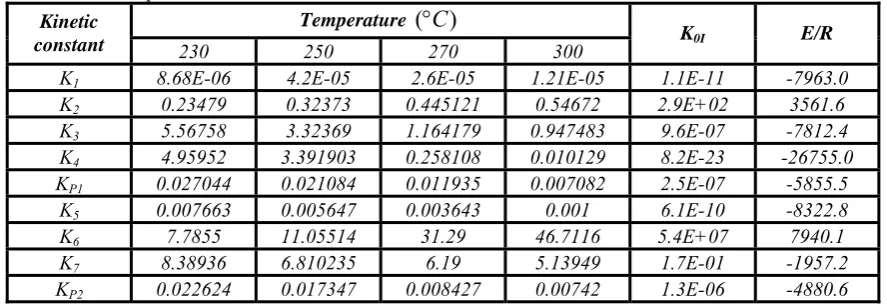
Table 5. Kinetic parameters.
Temperature (°C) Kinetic
constant 230 250 270 300 K0I E/R
K1 8.68E-06 4.2E-05 2.6E-05 1.21E-05 1.1E-11 -7963.0
K2 0.23479 0.32373 0.445121 0.54672 2.9E+02 3561.6
K3 5.56758 3.32369 1.164179 0.947483 9.6E-07 -7812.4
K4 4.95952 3.391903 0.258108 0.010129 8.2E-23 -26755.0
KP1 0.027044 0.021084 0.011935 0.007082 2.5E-07 -5855.5
K5 0.007663 0.005647 0.003643 0.001 6.1E-10 -8322.8
K6 7.7855 11.05514 31.29 46.7116 5.4E+07 7940.1
K7 8.38936 6.810235 6.19 5.13949 1.7E-01 -1957.2
KP2 0.022624 0.017347 0.008427 0.00742 1.3E-06 -4880.6
4-2. Reactor study
Assuming no axial dispersion, negligible inter particle and intera particle diffusional limitations, and also accounting for the catalyst deactivation, the following relation is obtained:
[
r C T]
a1 z u C z C u t C
i i
i
i − − − ( , )
∂ ∂ − ∂ ∂ − = ∂
∂ ρ
ε ε
(5)
Boundary conditions:
out i i
in i i
C C L
z t t at
C C z
t at
, ,
,
0 , 0
= ⇒ =
=
= ⇒ =
=
Under the experimental conditions applied in this study, the catalysts activity remained unchanged during a period of 12 hours (Fig.2, Temperature=250 °C). The catalyst deactivation was, therefore, ignored (a =1). In addition, the mean diameter of catalyst particles was 100 µm and was loaded in the reactor as fine powders. The overall effectiveness factor (η) was assumed equal to unity. In other words, it may be assumed that
neither internal nor external diffusion have been effective within the process.
By considering a dimensionless coordinate ξ=z/L; β= (1-ε)/ε, Isothermal condition and the ideal gas law, equation (5) may be rearranged as follows:
) ( .
. i
i i
i u RT r
L P P L u t
P − −
∂ ∂ − ∂ ∂ − = ∂
∂ β ρ
ξ
ξ (6)
Furthermore, in the case of chemical reac-tions with density change, the term (∂u/∂ξ) can be expressed as a function of (∂Pi/∂ξ), applying the following two relations:
) . 1 (
0 CO XCO
u
u= +ε (7)
CO CO
CO CO
CO X
X P
P
ε +
− =
1 1
0 (8)
and
) . 1 ( 2
.
0
CO CO
M CO CO
DME X
X X P
P
ε +
= (9)
28 Iranian Journal of Chemical Engineering, Vol. 3, No. 4 ) r ( RT . . ) ( P ) X ( X ) ( L ) X ( u t X CO CO CO CO CO CO CO CO CO CO − + + + ∂ ∂ + + − = ∂ ∂ β ρ ε ε ξ ε ε 1 1 1 1 0 2 2
0 (10)
Similarly, mathematical manipulation and substitution of equations (7) and (9) in (6) results in equation (11): ) r ( RT . . X X X X L P u t X ) X ( X P t X ) X . ( X . P DME CO M M CO CO CO CO CO M CO M CO CO CO CO ρ β ξ ξ ε ε 2 1 1 0 0 2 0 0 − ⎟⎟ ⎠ ⎞ ⎜⎜ ⎝ ⎛ ∂ ∂ + ∂ ∂ − = ∂ ∂ + + ∂ ∂
+ (11)
Finally, applying equation (10) in equations (11) gives the following result:
) r ( X X . P RT . . ) X ( X ) ( X . L ) X ( X u X L ) X ( u t X DME CO M CO CO CO CO CO CO CO CO CO M CO M CO CO M ⎥ ⎦ ⎤ ⎢ ⎣ ⎡ + + + − ∂ ∂ + + − ∂ ∂ + − = ∂ ∂ 2 1 1 1 1 1 0 0 0 ε ρ β ε ξ ε ε ε ξ ε (12)
By replacing (-rCO) from equation (3) and (rDME) from equation (4) in equations (10) and (12) respectively, the
following relations may be obtained:
) , ( ) ( ) 1 ( ) ( 2
1 CO CO CO CO M
CO f X X m X m f X X
t X + ⎥ ⎦ ⎤ ⎢ ⎣ ⎡ Δ − + ∗ = ∂ ∂ ξ (13) ) X , X ( f ) m ( X ) m ( X ) X , X ( f ) m ( X ) m ( X ) X ( f t X M CO CO M M CO M M CO M 5 4 3 1 1 + ⎥ ⎦ ⎤ ⎢ ⎣ ⎡ Δ − + ∗ − ⎥ ⎦ ⎤ ⎢ ⎣ ⎡ Δ − + = ∂ ∂ ξ ξ (14)
Iranian Journal of Chemical Engineering, Vol. 3, No. 4 29
4-3. Applications of model
4-3-1. Variation of CO conversion at the reactor outlet
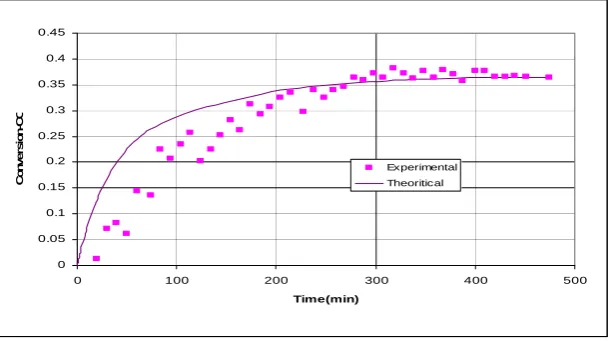
In Figure 3, the experimental data for CO conversion at the reactor outlet and those predicted from the model are presented. Apart from the initial period, the correlation between the two sets of data is satisfactory in all experimental runs. The discrepancies observed in the initial period may be either due to the use of steady state experimental results in the prediction of system behavior under unsteady state conditions, or to the experimental errors involved in the deter-mination of transient CO concentrations at
the reactor outlet.
4-3-2. Variation of methanol and DME partial pressures at the reactor outlet
The experimental data for partial pressures of methanol and DME at the reactor outlet and those estimated from the model are given in Figs 4 and 5. Similar to the previous case, apart from the initial period, the correlations between the experimental and predicted values are fairly good. The discrepancies observed at the earlier stages could be related to the application of steady state experi-mental data in the prediction of system behavior under unsteady state conditions.
0 0.05 0.1 0.15 0.2 0.25 0.3 0.35 0.4 0.45
0 100 200 300 400 500
Time(min)
C
o
n
ver
s
io
n
-C
O
Experimental Theoritical
Figure 3. Conversion of CO as a function of time at the reactor outlet (T=250 °C, W/F=1120 g/(mol/min)).
0 0.1 0.2 0.3 0.4 0.5 0.6 0.7 0.8 0.9
0 100 200 300 400 500
Time(min)
M
eo
h
-P
a
rt
ia
l P
ressu
re
(
b
ar
g
)
Theoritical Experimental
30 Iranian Journal of Chemical Engineering, Vol. 3, No. 4
0 0.1 0.2 0.3 0.4 0.5 0.6 0.7
0 100 200 300 400 500
Time(min)
D
M
E
P
a
rt
ia
l P
ress
u
re
(b
ar
g
)
Experim ental
Theoritical
Figure 5. Partial pressure of DME as a function of time at the reactor outlet (T=250 °C, W/F=1120 g/(mol/min)).
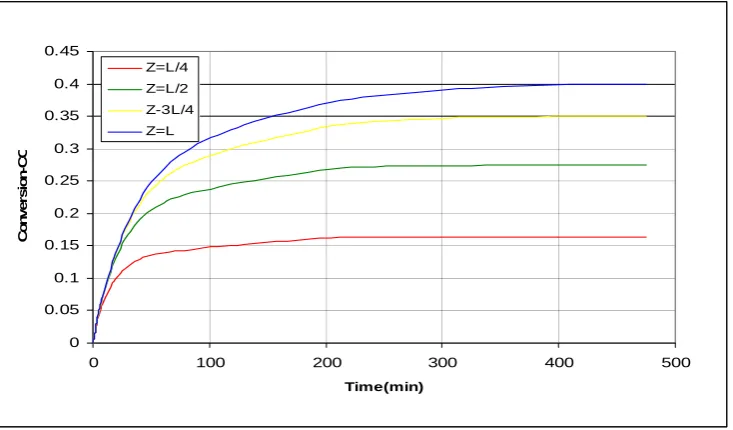
4-3-3. Variation of CO conversion within the reactor Conversions of CO at different depths of the catalyst bed, as calculated from the model, are plotted in Fig.6. Each curve in Fig.6
represents a specific location within the reactor. The conversions at each location have been calculated at different times after the start of the experiment.
0 0.05 0.1 0.15 0.2 0.25 0.3 0.35 0.4 0.45
0 100 200 300 400 500
Time(min)
C
o
n
ver
si
o
n
-C
O
Z=L/4
Z=L/2
Z-3L/4
Z=L
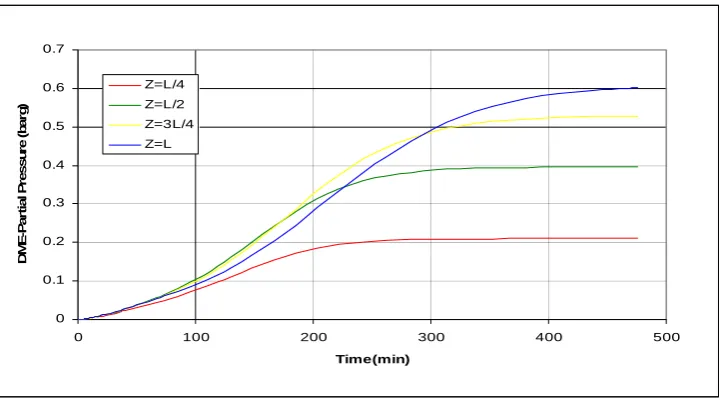
Iranian Journal of Chemical Engineering, Vol. 3, No. 4 31 4-3-4. Variation of methanol and DME partial
pressures within the reactor
Predicted data for the methanol and DME partial pressures at different depths of the
catalyst bed against time are plotted in Figures 7 and 8, respectively.
0 0.1 0.2 0.3 0.4 0.5 0.6 0.7 0.8 0.9
0 100 200 300 400 500
Time(min)
M
e
o
h
-P
a
rt
ia
l P
ressu
re
(
b
ar
g
)
Z=L/4 Z=L/2 Z=3L/4 Z=L
Figure 7. Partial pressure of methanol as a function of time at different depths of catalyst bed (T=250 °C, W/F=1120 g/(mol/min)).
0 0.1 0.2 0.3 0.4 0.5 0.6 0.7
0 100 200 300 400 500
Time(min)
D
M
E
-P
a
rt
ia
l P
ressu
re
(
b
ar
g
)
Z=L/4 Z=L/2 Z=3L/4 Z=L
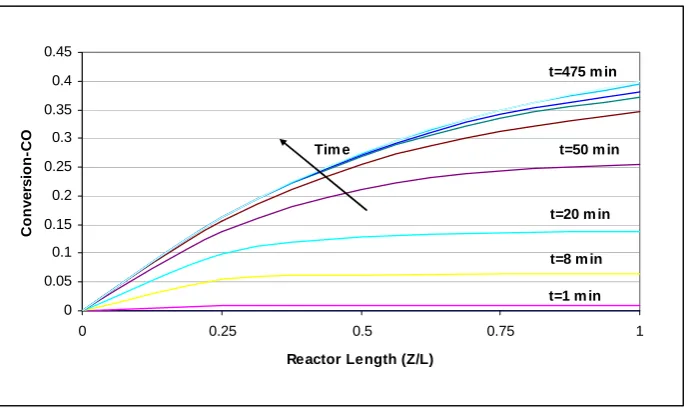
32 Iranian Journal of Chemical Engineering, Vol. 3, No. 4 4-3-5. Variation of CO conversion along the reactor
Conversions of CO as a function of both time and reactor length are given in Fig.9.
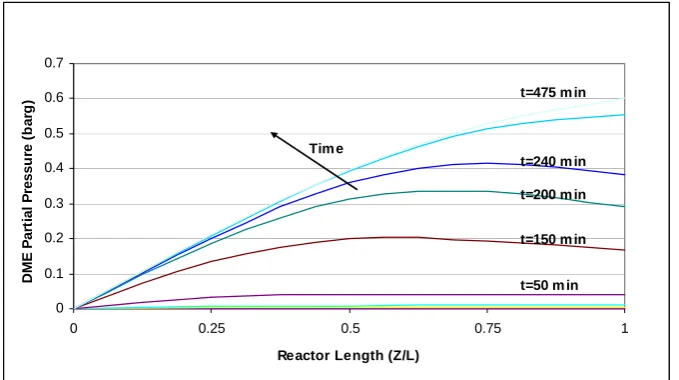
4-3-6. Variation of methanol and DME partial pressures along the reactor
At a certain time after the start of each experiment, the partial pressures of DME and methanol at different locations within the
reactor have been calculated using the dynamic model. Predicted data for partial pressures of methanol, as a function of time and reactor length, before and after extermum point, are presented in Figs 10 and 11, respectively. Whereas the data for DME is plotted in Fig. 12.
0 0.05 0.1 0.15 0.2 0.25 0.3 0.35 0.4 0.45
0 0.25 0.5 0.75 1
Reactor Length (Z/L)
C
o
n
ver
si
o
n
-C
O
Tim e t=50 m in
t=475 m in
t=8 m in t=20 m in
t=1 m in
Figure 9. Conversion of CO along the reactor (T=250 °C, W/F=1120 g/(mol/min)).
0 0.1 0.2 0.3 0.4 0.5 0.6 0.7 0.8
0 0.25 0.5 0.75 1
Reactor Length (Z/L)
M
e
o
h
P
a
rt
ia
l P
ress
u
re
(b
ar
g
)
Tim e
t=50 m in
t=1 m in t=8 m in t=20 m in
Iranian Journal of Chemical Engineering, Vol. 3, No. 4 33
0 0.1 0.2 0.3 0.4 0.5 0.6 0.7 0.8 0.9
0 0.25 0.5 0.75 1
Reactor Length (Z/L)
M
e
oh
P
a
rt
ia
l P
re
s
s
ur
e
(
b
a
rg)
Tim e
t=150 m in
t=200 m in
t=240 m in
t=350 m in t=475 m in
Figure 11. Partial pressures of methanol along the reactor (after extermum point-T=250 °C, W/F=1120 g/(mol/min)).
0 0.1 0.2 0.3 0.4 0.5 0.6 0.7
0 0.25 0.5 0.75 1
Reactor Length (Z/L)
D
M
E
P
a
rt
ial P
re
ssu
re
(
b
ar
g
)
Tim e
t=475 m in
t=240 m in t=200 m in
t=150 m in
t=50 m in
Figure 12. Partial pressures of DME along the reactor (T=250 °C, W/F=1120 g/(mol/min)).
5. Conclusion
A kinetic expression for syngas trans-formation to DME based upon Graff methanol synthesis and Bercic dehydration models has been derived and correlated with the experimental results over a range of temperatures. In order to predict the behavior for the process of direct conversion of synthesis gas to DME in a packed bed catalytic reactor, a simple dynamic model
34 Iranian Journal of Chemical Engineering, Vol. 3, No. 4 6. Symbols
a Catalyst activity C Concentration (mol/cm3) F Molar flow rate (mol/min) f Denotes function k Kinetic parameters Kp Equilibrium constant L Reactor length (mm)
m Exponent in equations (14) and (15) P Pressure (barg)
r Reaction rate (mol/min.gcat.) R Universal gas constant (J/mol.K) t Time (min)
T Temperature (K)
u Surface velocity of gases (mm/min) W Catalyst mass (g)
X Conversion y Mole fraction
z Longitudinal coordinate along the reactor (mm)
Subscript
i ith component M Methanol
Greek letters
β Constant
ε Bed porosity
εco Expansion parameter
øv Volumetric flow rate (m3/min)
ρ Bulk density (g/cm3)
ξ Dimensionless coordinate along the reactor
η Effectiveness factor
7. References
1. Hansen, J., Voss, B., Joensen, F. and Dcra-Siguroavdottir, I. “Large Scale Manu Facture of DME a New alternative Diesel Fuel From Natural gas”, International Congress &
Exposition, Detroit – Michigan, Feb.
27-March2 (1995).
2. Smadani, S. G. “Chementator”, Chem. Eng. April, (1995), 17-18.
3. Fleisch, T., McCarthy, C., Basu, A. and Udovich, C. “Demonstration of
4. ULEV Emissions on a Navistar Diesel Engine Fueled with Dimethyl Ether”, SAE Technical Paper Series, International
Congress & Exposition, Detroit, Michigan,
February 27-March 2,1995.
5. Nle, Z., Liu, H., Liu, D., Ying, W. and Fang, D. “Intrinsic Kinetics of Dimethyl Ether Synthesis From Syngas”, J. of Natural gas
Chemistry, 14(2005), 22-28.
6. Ge, Q., Huang, Y., Qiu, F. and Li, S. “Bifunctional catalysts for conversion of synthesis gas to DME”, Applied Catalysis, 167, 1998, 23-30.
7. Hadipour, A. and Sohrabi, M. “ Synthesis of Some Bifunctional Catalysts for Direct Conversion of Syngas to DME as a Clean Diesel Fuel”, Paper Accepted for Presentation at the First International
Congress on Green Process Engineering to
be Held in Toulous-France, 24-26 April, 2007.
8. Bercic, G. and Levec, J. “Intrinsic and Global reaction rate of Methanol Dehydration Over
γ-Al2O3 Pellets”, Ind. Eng. Chem. Res. 31
(1992), 1035-1040.
9. Bercic, G. and Levec, J. “Catalytic Dehydration of Methanol to DME. Kinetic Investigation and Reactor Simulation”, Ind.
Eng Chem. Res. 32 (1993), 2478-2484.
10. Erena, J., Arandes, J. M., Bilbao, J., Gayubo, A. G. and De lasa, H. I. “Conversion of Syngas to Liquid Hhydrocarbons Over a Two-Component (Cr2O3-zno and zsm-5
zeolite) Catalyst: Kinetic Modeling and Catalyst Deactivation”, Chem. Eng. Sci., 55 (2000), 1845-1855.
11. Peng, X. D., Toseland, B. A. and Tijm, P. J. A. “Kinetic Understanding of Chemical Synergy under LPDME Conditions – Once Through Applications”, Chem. Eng. Sci., 54 (1999), 2787-2792.
12. Graaf, G. H., Winkelman, J. G.M., Stamhuis, E. J. and Beenakers, A. A. C. M. “Kinetics of Three Phase Methanol Synthesis”, Chem.
Eng. Sci., 43, 8 (1988), 2161-2168.
13. Graaf, G. H., Sijtsema, P. J. J. M., Stamhuis, E. J. and Joosten, G. E. H. “Chemical Equilibria In Methanol Synthesis”, Chem.
Eng. Sci., 41, 11 (1986), 2883-2890.