VOLUME 41, ARTICLE 2, PAGES 37
-
52
PUBLISHED 3 JULY 2019
https://www.demographic-research.org/Volumes/Vol41/2/ DOI: 10.4054/DemRes.2019.41.2
Descriptive Finding
The geography of changing fertility in Myanmar
Anne Schuster
Sabu S. Padmadas
Andrew Hinde
© 2019 Anne Schuster, Sabu S. Padmadas & Andrew Hinde.
This open-access work is published under the terms of the Creative Commons Attribution 3.0 Germany (CC BY 3.0 DE), which permits use, reproduction, and distribution in any medium, provided the original author(s) and source are given credit.
1 Introduction 38
2 Data and methods 40
3 Geographical variations in fertility, 1983–2014 41
4 Factors associated with fertility in 2014 43
5 Discussion 46
6 Conclusions 48
The geography of changing fertility in Myanmar
Anne Schuster1
Sabu S. Padmadas2
Andrew Hinde2
Abstract
BACKGROUND
Between 1983 and 2014, the total fertility rate in Myanmar declined from 4.7 to 2.3 children per woman. Previous analyses of fertility decline in the country suggest that the decline varied regionally, but the geography of the decline has not been formally assessed.
METHODS
Using data from the 1983 and 2014 censuses, we examine fertility trends and geospatial patterns in fertility decline in Myanmar during the intercensal period, and investigate the aggregate socioeconomic factors underlying fertility decline at subregional levels.
RESULTS
Between 1983 and 2014, fertility change at subregional level was characterised by a precipitous decline in fertility rates in the broad central valley areas and a much weaker decline in remote, peripheral areas. Regression analysis of the 2014 census data, adjusting for state/region level variances, reveals a strong negative correlation between fertility and access to modern communication technologies. District-level female education and road connectivity were also associated with fertility.
CONCLUSIONS
The geographical diversity in Myanmar’s fertility transition has intensified over time, as fertility decline is concentrated in areas with greater development, higher socioeconomic status, and better connectivity to information networks.
1 Department of Social Statistics and Demography, University of Southampton, Southampton, UK.
Email:[email protected].
2 Department of Social Statistics and Demography, University of Southampton and Southampton Statistical
CONTRIBUTION
A district’s digital connectivity, measured through access to communication technologies, was a better predictor of fertility than other traditional measures. There is a need to explore to what extent digital connectivity is a proxy indicator for levels of modernisation and access to family planning and reproductive health services, and the extent to which it measures the intensity of social networks and the diffusion of information.
1. Introduction
Myanmar has experienced rapid population growth over the past half century, more than tripling in population since establishing its current borders in 1948. However, the most recent census data show a smaller than forecasted population. Intercensal estimates assumed sustained population growth and projected a population between 45 and 64 million by 2003 (Maung 1986; Myint 1991; Tint 1991; Spoorenberg 2013), but the 2014 Census counted only around 51 million people. Recent analyses report a deceleration of population growth consistent with fertility decline (Spoorenberg 2013; World Bank 2016). This paper examines the geography of, and the factors associated with, this fertility decline.
Figure 1: States and regions of Myanmar, 2014 (a), and conflict incidents during year 2014 (b)
(a) (b)
Source: Myanmar Information Management Unit (2007); Raleigh et al. (2010).
Border states have also been affected by conflict during the past decades. Conflict event data for the census year of 2014 indicate that conflict incidents were widespread throughout the country, though most intense in Rakhine, northern Shan, and western Kachin states (Figure 1b). Although less frequent, Kayin state also regularly experienced conflict during the same period. The most intensive conflicts have been in peripheral areas inhabited by ethnic minorities, such as Rakhine state.
In this paper we examine regional fertility trends using data from the 1983 and 2014 censuses, validated using data from the recently released 2016 Demographic and Health Survey (DHS). We compare subregional fertility patterns in 2014 with those reported 31 years earlier. Aggregate data from the 2014 census are examined to provide insight into the factors influencing fertility at a subregional level, and how these factors may contribute to our understanding of other health and social outcomes across the country.
We generated maps showing the geospatial distribution of fertility and associated factors using ArcGIS 10.4.1 and applying Shapefiles and Place Codes from the Myanmar Information Management Unit (2007). Statistical analysis was carried out using Microsoft Excel and IBM SPSS Statistics v.24.
2. Data and methods
Data for 1983 were abstracted from individual state- and region-level published census reports. The reports include tables of population by five-year age groups and sex for each township, but do not include information on births below the state/region level (Immigration and Manpower Department, Ministry of Home and Religious Affairs 1986). For this reason, we calculated the implied Total Fertility Rate (iTFR) to obtain fertility estimates for smaller geographic areas (Hauer, Baker, and Brown 2013). The iTFR uses data on the population aged under five years to estimate the annual number of births in a particular area, and divides this by the population of women in the fertile age range to estimate the mean age-specific fertility rate across the fertile ages. Multiplying this by the number of years in the fertile age range produces the iTFR. The iTFR has been found to perform well compared with other methods of estimating the TFR, such as the Bogue–Palmore method (Hauer, Baker, and Brown 2013).
The iTFR as originally proposed assumes no child mortality or migration. As we had access to child mortality estimates, we adjusted our iTFR estimates for the expected number of children born in the last five years who would have died before the census. At the state/region level, our iTFRs were generally lower than Myint’s (1991) estimates of the 1983 fertility rates using Brass, Trussell, and Arriaga’s methods.
the union territory and capital of Nay Pyi Taw in 2005). The census data for conflict areas are known to be deficient. Access to some areas was restricted during both census enumerations. In 1983 access to 830 village tracts was restricted and another 112 were only partially enumerated. In 2014 enumeration was restricted in Kachin, Kayin, and Rakhine states: The number of nonenumerated village tracts is not documented, but an estimated 1.2 million individuals lived in the nonenumerated areas. In most cases, the Census estimated population figures and demographic characteristics for these townships, but eight townships were excluded completely from data collection during at least one of the two censuses. Data for these townships are not included in our maps. However, as the census records do not identify the townships that were only partially enumerated, we have included them in the analysis.
WorldPop (2017), while generating population estimates for Myanmar, identified several townships and districts requiring adjustment. In their analysis, three townships in Rakhine were merged; two townships and a district were merged in Kachin; and additional mergers of areas took place in Shan state. Limitations on the availability of microdata meant that we could not reconstruct the TFRs of new townships for comparison between the two censuses or derive TFR estimates for the merged geographic areas suggested by WorldPop.
New townships and partially enumerated townships were included in the regression analysis of the district-level 2014 census data. As a check, we reran our model with all districts and excluding those districts for which data might be unreliable. While the coefficient estimates varied slightly, the direction and magnitude of the effects, and the standard errors, were similar with and without the contested districts.
3. Geographical variations in fertility, 1983–2014
Figure 2: Township fertility rates: Myanmar, 1983 (a) and 2014 (b)
(a) 1983 iTFR (b) 2014 TFR
Note: For method of calculation of iTFR for 1983, see Hauer, Baker, and Brown (2013).
Sources: Myanmar Information Management Unit (2007); Immigration and Manpower Department, Ministry of Home and Religious Affairs (1986); and Department of Population, Ministry of Labour, Immigration and Population (2016a).
Figure 3: Estimated change in total fertility rate: Myanmar, 1983 to 2014
Note: The figures mapped here are the absolute differences in each township between the implied total fertility rate in 1983 and the total fertility rate in 2014.
Sources: Myanmar Information Management Unit (2007); and Department of Population, Ministry of Labour, Immigration and Population (2016a).
4. Factors associated with fertility in 2014
were selected because they have either: (1) been found to be associated with fertility in previous work (marriage, female education); (2) are indicators of poverty and living conditions (type of housing, sanitation) or; (3) indicate exposure to mass media and communication. Finally, we used ArcGIS 10.4.1 to calculate the average distance from a road intersection in each district using raster data developed as a part of the Global High Resolution Population Denominators Project (University of Southampton Department of Geography and Environmental Sciences et al. 2018).
Based on preliminary analysis of the correlations between the various measures of digital connectivity, we reduced these measures to two. The first is household access to a radio. The second is the first component from a principal component analysis of the remaining connectivity variables: household ownership of a computer, mobile phone, internet, and television. Each of the different instruments of connectivity loads positively on the component, so high values of the component denote a high level of connectivity. Analysis of DHS data in other countries reveals that the residents of households with televisions are wealthier, older, better educated and more likely to live in urban areas (Westoff and Koffman 2011) than households with access to a radio. It may be, therefore, that access to a radio is measuring a basic level of digital connectivity, whereas the principal component is measuring the extent of connectedness among households beyond a basic level.
We estimated regression models of the district-level TFRs on various characteristics of the districts. The 71 districts are nested within the 15 states/regions. Self-administered regions and zones were not considered for this analysis. We found an inter-cluster correlation for an empty (variance components) model of the TFR clustered on state/region of 0.47, indicating that just under half of the inter-district variation in the TFR was explained by differences between the states/regions. Therefore, our models use district as the unit of analysis, but include a random intercept at state/region level to account for potential state/region characteristics.
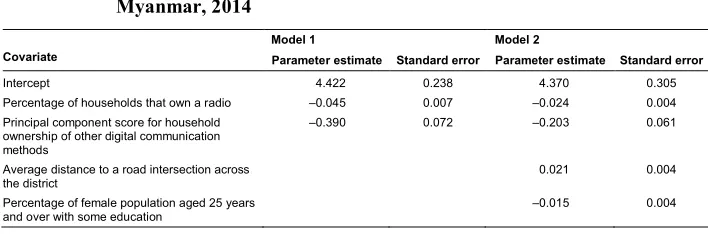
Table 1: Regression of total fertility rate on district-level characteristics: Myanmar, 2014
Covariate
Model 1 Model 2
Parameter estimate Standard error Parameter estimate Standard error
Intercept 4.422 0.238 4.370 0.305
Percentage of households that own a radio –0.045 0.007 –0.024 0.004 Principal component score for household
ownership of other digital communication methods
–0.390 0.072 –0.203 0.061
Average distance to a road intersection across the district
0.021 0.004
Percentage of female population aged 25 years and over with some education
–0.015 0.004
Note: The models include a random intercept at the state/region level.
Source: Department of Population, Ministry of Labour, Immigration and Population (2016a); University of Southampton Department of Geography and Environmental Science et al. (2018).
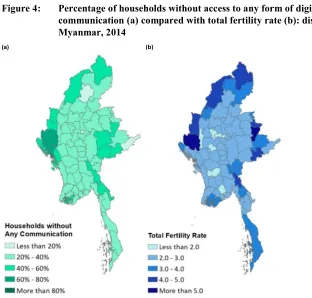
Figure 4: Percentage of households without access to any form of digital communication (a) compared with total fertility rate (b): districts of Myanmar, 2014
(a) (b)
Sources: Myanmar Information Management Unit (2007); and Department of Population, Ministry of Labour, Immigration and Population (2016a).
5. Discussion
The 2014 census came at a time of very rapid change in access to mobile telephones and the internet in Myanmar. It may be that in the future the disparity in access between the central and the peripheral areas will diminish. It is also possible that in 2014 part of the disparity was the result of under-reporting of digital connectivity in conflict zones. However, even if this is so, the 2014 snapshot has illuminated divisions within the country which are closely associated with fertility differentials. The geographical areas that lag behind in terms of fertility transition are remote from the centre of Myanmar geographically, socially, and politically. Similar patterns in fertility decline have been observed in other countries and regions (Watkins 1991; Bongaarts and Watkins 1996; Guilmoto and Rajan 2001; Amin, Basu, and Stephenson 2002; Potter et al. 2010). Physical distance from other communities or urban centres is still important to measuring remoteness, as seen in this analysis, but digital and social remoteness is becoming increasingly important and can be seen as a proxy for an area’s level of development and poverty (Copus 2001; Department of Population, Ministry of Labour, Immigration and Population 2016b). Thus, access to digital communication may be useful as a means of measuring overall remoteness as an alternative to more traditional spatial measures. While the rapid expansion of telecommunications in the country may lead to greater use of mobile technology, internet, and computers in rural parts of the country, evidence from other countries suggests that even when widely available, internet users tend to have higher education levels and come from higher socioeconomic households (Pearce and Rice 2013).
Remoteness affects fertility in several ways. Centrality leads to stability, which can decrease the need for the economic protection provided by having a large family (Cain 1980). Living in well-connected areas improves access to new information and potentially leads to a spread of fertility limiting and spacing behaviour (van de Walle 1992; Casterline 2001; Rosero-Bixby and Casterline 1993). In Myanmar, the central ‘corridor’ is mainly ethnically Burmese. Women living in this part of the country, especially in urban areas, are more likely to speak the official language of the country, to be better educated, and to be engaged in the labour market, all characteristics linked with declining fertility. These characteristics of central Myanmar, which also include nontraditional marriage patterns and socioeconomic development, have been suggested as the main drivers of fertility change (Jones 2007; Chan and Taylor 2013). Finally, a strong association between digital connectivity and fertility is also consistent with the fertility diffusion hypothesis argued by Watkins (1991) and empirically tested by Bongaarts and Watkins (1996).
planning services or health care from one of these areas may mean hours of travel over poorly maintained roads or walking through dense rain forest (Teela et al. 2009). Health workers face additional challenges locating and caring for displaced villagers and ensuring the safety of their staff (Teela et al. 2009; Lee et al. 2006). Furthermore, prolonged conflict itself may have affected fertility in these areas in a number of different ways not explored in this analysis. Finally, language barriers may limit rural populations’ ability to use mobile devices and comprehend health messaging from mobile or online sources, which are unlikely to be in all languages, when it becomes available (Pearce and Rice 2013). Our results suggest that physical and technological isolation have an independent effect on fertility in Myanmar.
While our analysis helps to explain the factors associated with fertility change in Myanmar, we must acknowledge the limitations of the census data. We excluded from the analysis an estimated 1.2 million population living in village tracts and townships not enumerated in the censuses. While the censuses attempted to estimate the populations living in these areas, these estimates assume that these townships behave similarly to those around them. However, the populations of these townships are, in general, highly exposed to conflict and they generally have restricted access to health and technology services. Future analysis of subnational fertility trends in Myanmar would benefit from a deeper examination of the relationship between conflict and fertility.
6. Conclusions
References
Amin, S., Basu, A.M., and Stephenson, R. (2002). Spatial variation in contraceptive use in Bangladesh: Looking beyond the borders. Demography 39(2): 251–267.
doi:10.1353/dem.2002.0014.
Bongaarts, J. and Watkins, S.C. (1996). Social interactions and contemporary fertility transitions. Population and Development Review 22(4): 639–682. doi:10.2307/
2137804.
Cain, M. (1980). Risk, fertility, and family planning in a Bangladesh village.Studies in
Family Planning11(6): 219–223.doi:10.2307/1966379.
Casterline, J. (2001).Diffusion processes and fertility transition: Selected perspectives. Washington, D.C.: National Academy Press.
Chan, M.F. and Taylor, B.J. (2013). Impact of demographic change, socioeconomics, and health care resources on life expectancy in Cambodia, Laos, and Myanmar.
Public Health Nursing 30(3): 183–192.doi:10.1111/phn.12005.
Copus, A.K. (2001). From core-periphery to polycentric development: Concepts of spatial and aspatial peripherality.European Planning Studies 9(4): 539–552. Department of Medical Research, Department of Public Health, Department of Medical
Services, and United Nations Population Fund (2016). 2015 Health facility assessment for reproductive health commodities and services. Yangon: UNFPA.
https://myanmar.unfpa.org/en/publications/2015-health-facility-assessment-reproductive-health-commodities-and-services.
Department of Population, Ministry of Labour, Immigration and Population (2016a). The 2014 Myanmar Population and Housing Census: Thematic report on fertility and nuptiality. Nay Pyi Taw: UNFPA. https://myanmar.unfpa.org/en/ publications/thematic-report-fertility-and-nuptiality.
Department of Population, Ministry of Labour, Immigration and Population (2016b). The 2014 Myanmar Population and Housing Census: Thematic report on mortality. Nay Pyi Taw: UNFPA. https://myanmar.unfpa.org/en/publications/ thematic-report-mortality.
General Administration Department (2018). Total list of districts, townships, sub-townships, towns, wards, village-tracts and villages in regions and states in Myanmar [electronic resource]. Nay Pyi Taw: Government of Myanmar.
Guilmoto, C.Z. and Rajan, S.I. (2001). Spatial patterns of fertility transition in Indian districts. Population and Development Review 27(4): 713–738. doi:10.1111/
j.1728-4457.2001.00713.x.
Hauer, M., Baker, J., and Brown, W. (2013). Indirect estimates of total fertility rate using child women/ratio: A comparison with the Bogue–Palmore method.PLoS ONE 8(6): e67226.doi:10.1371/journal.pone.0067226.
Immigration and Manpower Department, Ministry of Home and Religious Affairs (1986). Burma: 1983 Population Census. Yangon: Ministry of Home and Religious Affairs.
Jones, G.W. (2007). Delayed marriage and very low fertility in Pacific Asia.Population
and Development Review 33(3): 453–478. doi:10.1111/j.1728-4457.2007.
00180.x.
Lee, T.J., Mullany, L.C., Richards, A.K., Kuiper, H.K., Maung, C., and Beyrer, C. (2006). Mortality rates in conflict zones in Karan, Karenni and Mon states in eastern Burma. Tropical Medicine and International Health 11(7): 1119–1127.
doi:10.1111/j.1365-3156.2006.01651.x.
Maung, M.I.K. (1986). The population of Burma: An analysis of the 1973 Census. Honolulu: East–West Population Institute (Papers of the East–West Population Institute 97).
Ministry of Health and Sports and ICF (2017). Myanmar Demographic and Health Survey 2015–16. Nay Pyi Taw and Rockville: Ministry of Health and Sports and ICF.
Ministry of National Planning and Economic Development, Ministry of Health, and UNICEF (2011). Myanmar: Monitoring the situation of children and women: Multiple Indicator Cluster Survey Report 2009–2010. Yangon: Ministry of Health.
Myanmar Information Management Unit (2007). Myanmar states/regions and townships overview map. Yangon: Myanmar Information Management Unit. Myint, N. (1991). Recent levels and trends of fertility and mortality in Myanmar.
Asia-Pacific Population Journal6(2): 3–20.doi:10.18356/013e2459-en.
Pearce, K.E. and Rice, R.E. (2013). Digital divides from access to activities: Comparing mobile and personal computer internet use. Journal of
Potter, J.E., Schmertmann, C.P., Assunção, R.M., and Cavenaghi, S.M. (2010). Mapping of timing, pace, and scale of the fertility transition in Brazil.
Population and Development Review 36(2): 283–307.doi:10.1111/j.1728-4457.
2010.00330.x.
Raleigh, C., Linke, A., Hegre, H., and Karlsen, J. (2010). Introducing ACLED: An armed conflict location and event dataset. Journal of Peace Research 47(5): 651–660.doi:10.1177/0022343310378914.
Rosero-Bixby, L. and Casterline, J. (1993). Modelling diffusion effects in fertility transition. Population Studies 47(1): 147–167. doi:10.1080/
0032472031000146786.
Shadrach, B. (2018). Upgrading Myanmar’s internet connection [electronic resource]. Canberra: East Asia Forum. https://www.eastasiaforum.org/2018/06/16/
upgrading-myanmars-internet-connection (accessed May 19, 2019).
Spoorenberg, T. (2013). Demographic changes in Myanmar since 1983: An examination of official data. Population and Development Review 39(2): 309–
324.doi:10.1111/j.1728-4457.2013.00593.x.
Teela, K.C., Mullany, L.C., Lee, C.I., Poh, E., Paw, P., Masenior, N., Maung, C., Beyrer, C., and Lee, T.J. (2009). Community-based delivery of maternal care in conflict-affected areas of eastern Burma: Perspectives from lay maternal health workers. Social Science and Medicine 68(7): 1332–1340. doi:10.1016/ j.socscimed.2009.01.033.
Tint, W. (1991). Population projections for Myanmar, 1983–2013. Asia-Pacific Population Journal 6(2): 21–54.doi:10.18356/a0f46f35-en.
University of Southampton Department of Geography and Environmental Sciences, WorldPop, Universtiy of Louisville Department of Geography and Geosciences, Université de Namur Département de Géographie, and Columbia University Center for International Earth Science Information Network (2018). Global high resolution population denominators project [electronic resource]. Seattle: Bill and Melinda Gates Foundation. ftp://ftp.worldpop.org.uk/GIS/Covariates/
Global_2000_2020/MMR/OSM/DST/ (accessed February 27, 2019).
van de Walle, E. (1992). Fertility transition, conscious choice, and numeracy.
Demography 29(4): 487–502.doi:10.2307/2061848.
Watkins, S.C. (1991). From provinces into nations: Demographic integration in
Western Europe 1870–1960. Princeton: Princeton University Press.doi:10.1515/
Westoff, C.F. and Koffman, D.A. (2011). The association of television and radio with reproductive behaviour. Population and Development Review 37(4): 749–759.
doi:10.1111/j.1728-4457.2011.00455.x.
World Bank (2016). Data: World development indicators: Myanmar [electronic resource]. Geneva: World Bank Group. http://databank.worldbank.org/data/
reports.aspx?source=2&country=MMR (accessed May 14, 2019).
WorldPop (2017). Myanmar population map metadata report [electronic resource]. Southampton: GeoData Institute, University of Southampton.
https://www.worldpop.org/tabs/gdata/html/57/Myanmar_100m_Population_met