VOLUME 41, ARTICLE 8, PAGES 197
-
230
PUBLISHED 17 JULY 2019
https://www.demographic-research.org/Volumes/Vol41/8/ DOI: 10.4054/DemRes.2019.41.8
Research Article
The health of biracial children in two-parent
families in the United States
Kate H. Choi
Nancy E. Reichman
© 2019 Kate H. Choi & Nancy E. Reichman.
This open-access work is published under the terms of the Creative Commons Attribution 3.0 Germany (CC BY 3.0 DE), which permits use, reproduction, and distribution in any medium, provided the original author(s) and source are given credit.
1 Introduction 198
2 Background 200
2.1 Black-white differences in child health 200 2.2 Health of black/white biracial children 201 2.3 Health differences between children born to black mothers and
white fathers and children born to white mothers and black fathers 203
2.4 Hypotheses 204
3 Data and methods 205
3.1 Data 205
3.2 Sample 206
3.3 Key measures 207
3.3.1 Dependent variable 207
3.3.2 Key independent variable 208
3.3.3 Other variables 209
3.3.4 Analytical strategy 209
4 Results 210
4.1 Descriptive analysis 210
4.1.1 Sample characteristics 210
4.1.2 Disparities in health by children’s racial background 212
4.2 Multivariate analysis 213
4.2.1 Disparities in children’s poor overall health according to their race 213 4.2.2 Disparities in children’s disability according to their racial
background
216
5 Supplementary analyses 219
6 Discussion 220
7 Acknowledgments 223
The health of biracial children in two-parent families
in the United States
Kate H. Choi1
Nancy E. Reichman2
Abstract
BACKGROUND
Over the past few decades, the United States has experienced a dramatic rise in the number of multiracial individuals. The health of this population is vastly understudied because most population-based health surveys do not adequately identify multiracial individuals.
OBJECTIVE
We compare the health of black/white biracial children with that of single-race white and black children and assess the extent to which differences in characteristics of parents who select into the distinct unions and children’s socioeconomic backgrounds explain the observed differences.
METHODS
Using information about the race of coresident mothers and fathers, we classify children into four racial groups – single-race whites (WW), biracial children with white mothers and black fathers (WB), biracial children with black mothers and white fathers (BW), and single-race blacks (BB). We estimate logistic regression models to document variations in rates of poor overall health and disability by children’s racial background.
RESULTS
WW children are less likely than BB children to have poor overall health, but more likely to be diagnosed with a disability. WB children are less likely than BB children, but more likely than WW children, to have poorer health. The disability rates of WB children are similar to those of BB children. Selection and socioeconomic differences explain some of the differences in poor overall health, but suppress differences in disability, between WB and WW children.
1 Department of Sociology, University of Western Ontario, London, Canada. Email:[email protected]. 2 Department of Pediatrics, Robert Wood Johnson Medical School, Rutgers University, New Brunswick,
CONTRIBUTION
This study underscores the importance of considering both maternal and paternal race when studying racial disparities in child health.
1. Introduction
The year 2017 marked the 50th anniversary of Loving vs. Virginia, the landmark
Supreme Court case that declared anti-miscegenation laws unconstitutional in the United States. During the five decades following this decision, the share of newlyweds in interracial unions in the United States increased fivefold, from 3% in 1967 to 17% in 2013 (Parker et al. 2015). The share of children of mixed racial and ethnic heritage in the United States also increased tenfold, from less than 1% in 1970 to 10% in 2013 (Parker et al. 2015). This demographic trend has kindled questions about how the growing number of individuals of mixed racial and ethnic heritage contribute to racial and ethnic inequalities in future populations (e.g., Bratter and Gorman 2011; Campbell and Eggerling-Boeck 2006; Choi and Goldberg 2018).
Despite the increasing demographic salience of the multiracial population, there has been relatively little research on the health of multiracial individuals. This research gap reflects a paucity of population-based health surveys that adequately identify multiracial individuals. Most health surveys assign multiracial individuals to single-race categories using reports about the race that best describes them, combine all multiracial individuals into a single group, or classify them as “other race” (Wey et al. 2018).3
Moreover, the small number of exceptional studies on this topic focuses on the birth outcomes of multiracial infants (see Srinivasjois, Shah, and Shah 2012 for a review), psychological wellbeing during adolescence (Campbell and Eggerling-Boeck 2006), or overall health status of multiracial adults (Bratter and Gorman 2011). As far as we know, no study to date has examined the health of multiracial individuals between birth and adolescence. This gap exists although health has important implications for subsequent health, academic performance, and socioeconomic trajectories (Jackson 2015; Palloni 2006).
Using information available in the household rosters of the 1998–2017 National Health Interview Surveys (NHIS), we examine how the health of black/white biracial children compares with that of single-race white and single-race black children. We
3 The Natality files of the US Vital Statistics data, National Longitudinal Study of Adolescent to Adult
also investigate how the health of children born to white mothers and black fathers compares with that of children born to black mothers and white fathers. We also assess the extent to which differences in (a) the characteristics of parents who select into the distinct unions and (b) children’s socioeconomic circumstances at the time of the survey explain the observed differences. Across all analyses, we define children’s racial background using information about the race of coresident, biological mothers and fathers and characterize child health using two global measures – poor overall health and having a disability.
This study contributes to the literature on racial/ethnic disparities in health in several important ways. First, we focus on biracial individuals. As stated earlier, the health of multiracial individuals is an understudied topic in large part due to the paucity of population-based health surveys that adequately identify this population (Wey et al. 2018). The racial classification system of the NHIS is no exception: it assigns multiracial children into single-race categories using information about the race that best describes the child.4To overcome this data constraint, we make creative use of
information available in the household roster of the NHIS to link children to both coresident, biological/adoptive parents and identify biracial children using information about the races of coresident mothers and fathers. A similar approach was used by Lichter and Qian (2018) in a recent study about the racial/ethnic identity of children from white-minority intermarriages using the American Community Survey (ACS). Second, we focus on children, specifically those between ages 2 and 14 years. Prior work has examined the health of biracial infants, adolescents, and adults, but it has not examined the health of biracial individuals between infancy and adolescence.Finally, we consider how the health of black/white biracial children differs according to the gender of the black parent. Because of the small numbers of black/white biracial individuals available in population-based surveys, prior work has generally treated black/white individuals as a homogeneous group, ignoring differences depending on the gender of the black parent (e.g., Bratter and Gorman 2011; Campbell and Eggerling-Boeck 2006). Because black female/white male couples are more socioeconomically advantaged than white female/black male couples (Choi and Goldberg 2018) and socioeconomic status is associated with health, treating all black/white biracial children as a homogeneous group may mask health differentials between WB and BW children. We address this issue by pooling multiple years of a rich, large national health survey to obtain large samples of black/white biracial children.
2. Background
2.1 Black-white differences in child health
Black-white differences in child health have been extensively documented.5 Infants
born to non-Hispanic black mothers have substantially higher rates of low birthweight and infant mortality rates relative to infants born to non-Hispanic white mothers (Powers et al. 2006; Ridell, Harper, and Kaufman 2017). Non-Hispanic black children are more likely than non-Hispanic white children to have fair or poor health, be overweight or obese, and have asthma (Chen, Martin, and Matthews 2006).
Several potential explanations for black-white differences in child health have been considered. One is that black-white differences in child health emerge in large part because Hispanic black children are disproportionately more likely than non-Hispanic white children to grow up in socioeconomically disadvantaged families (Hummer 1996). Specifically, Hispanic black children are more likely than non-Hispanic white children to be born to unmarried parents (Hummer 1996; Hummer and Hamilton 2010). They are also more likely than non-Hispanic white children to be reared by parents with relatively low levels of education, live in poverty, and reside in unsafe neighborhoods (Bailey, Saperstein, and Penner 2014; Hummer 1996; Hummer and Hamilton 2010). More socioeconomically advantaged parents generally have greater medical knowledge and access to both preventive care and medical services in the event of a child’s illness relative to disadvantaged parents (Link and Phelan 1995). Socioeconomic disadvantages explain a significant portion, but not all, of the black-white disparities in child health (Hummer 1996; Teitler et al. 2007; Williams and Mohammed 2009).
Another potential explanation for black-white disparities in child health involves behavioral or cultural differences. For example, non-Hispanic black individuals, including children, consume fatty foods at higher rates than their non-Hispanic white counterparts (Gans et al. 2003; Hudson 2008; Signorello et al. 2007). They are also less likely than non-Hispanic whites to lead a physically active lifestyle (Berkman and Mullen 1997; Hudson 2008). These differences partially explain why non-Hispanic blacks, including children, have an elevated risk of obesity and cardiovascular disease relative to non-Hispanic whites (Berkman and Mullen 1997; Signorello et al. 2007).
Racial discrimination is yet another potential explanation for black-white disparities in child health. Experiences of racial discrimination are associated with low self-esteem, depression, poor metabolic control, poor cardiovascular health, and obesity
5 We recognize that race is an amalgam of distinct ethnic and racial groups, but we follow the tradition in the
among children (see Pascoe and Smart Richman 2009). Racial discrimination could also indirectly affect children’s health by exposing their parents to uncontrollable and unpredictable stress, which increases their vulnerability to mental and physical illnesses (Gee and Ford 2011; Pascoe and Smart Richman 2009; Williams and Mohammed 2009). Structural racial discrimination also adversely affects child health by hindering the socioeconomic attainment of black families and concentrating them in unsafe areas with poor quality medical facilities (Hummer 1996).
2.2 Health of black/white biracial children
Based on the literature on interracial marriages and the wellbeing of multiracial individuals, it is unclear a priori how the health of biracial children would compare to that of single-race white and black children. Instead, a review of this literature yields three different hypotheses. The first hypothesis is that black/white biracial children will be unhealthier than both single-race whites and single-race blacks. One potential reason is their limited sense of belonging and confusion over one’s racial identity, which may lead to poorer mental health outcomes (Campbell and Eggerling-Boeck 2006). In his seminal paper Human migration and the marginal man, Park (1928: 893) points to biracial individuals as the quintessential example of the “marginal man,” whom he defines as “one who lives in two worlds in both of which he is more or less of a stranger.” According to Park, biracial individuals live in a perpetual state of restlessness, spiritual instability, and intensified consciousness due to their marginal status in multiple racial groups (Park 1928).
Reservation against interracial unions is another reason why black/white biracial children may have worse health relative to single-race white and single-race black children. Although intermarriage has become more accepted over time, some segments of society continue to express strong reservations against interracial unions, particularly when it involves members of their own families (Persons 1987; Parker et al. 2015). Biracial individuals, particularly those of black descent, frequently report experiencing discrimination and harassment because of their mixed racial heritage (Kroeger and Williams 2011; Lee and Bean 2007; Parker et al. 2015). Exposure to discrimination and harassment may take a toll on their mental and physical health.
couples (Kreider 2000). Children born to cohabiting parents are more likely than those born to married parents to experience family instability (see Manning 2015 for a review). Family instability is strongly associated with poor physical health (Schmeer 2011). Biracial children may have poorer health relative to single-race children because higher shares of biracial children are born to cohabiting parents and children born to cohabiting parents have greater exposure to family instability than those born to married parents.
Finally, limited kin support may result in worse health among black/white biracial children compared to single-race white and black children. Interracial unions with black partners frequently evoke strong disapproval from parents, extended kin, and friends (Kroeger and Williams 2011; Lee and Bean 2007). Some parents may express their disapproval by withholding their emotional and monetary support from their adult children and having limited contact with their biracial grandchildren (Bratter and Whitehead 2018; Root 2001). The absence of social support can compromise the health of black/white biracial children by increasing their exposure to economic hardships (Kalil and Ryan 2010) and/or adversely affecting their parents’ relationship quality and mental health (Kroeger and Williams 2011; Lee and Bean 2007).
The second hypothesis is that black/white biracial individuals will have worse health than single-race whites but better health than single-race blacks, in large part due to an ‘in-between’ socioeconomic status of black/white multiracial households. Whites are more socioeconomically advantaged than blacks. If partners in interracial unions pool resources, they will have, on average, fewer socioeconomic resources than same-race white couples but more resources than same-same-race black couples (Campbell and Eggerling-Boeck 2006; Gullickson 2006). Selection into interracial unions may also play a role. Blacks who marry whites, particularly blacks who are foreign-born, are more socioeconomically advantaged than blacks who marry other blacks (Gullickson 2006). In contrast, whites who marry blacks are more disadvantaged than whites in endogamous unions (Choi and Goldberg 2018; Rosenfeld 2005). The union between an advantaged black partner and a disadvantaged white partner will produce a multiracial household with average socioeconomic characteristics that fall between those of same-race white and black couples. Given the strong links between socioeconomic status and health, the ‘in-between’ socioeconomic status of mixed-race households suggests that black/white biracial children will have worse health than single-race whites, but better health than single-race blacks.
single-race “blacks” (Brunsma 2006). According to a recent Pew Report (Parker et al. 2015),58% of black/white biracial adults say that they have a lot more in common with blacks than whites and 69% of black/white biracial adults say that they have more contact with black relatives than with white relatives. These shared experiences suggest that the health of biracial children would be similar to that of single-race black children. Most empirical support is available for the prediction that the health of biracial children falls between that of single-race white and single-race black children (Bratter and Gorman 2011; Collins and David 1993; Parker 2000). For example, rates of low birthweight of black/white biracial children fall between those of single-race white and single-race black children. However, there is also some empirical support for the hypothesis that biracial individuals have worse health than single-race whites and blacks. Campbell and Eggerling-Boeck (2006) found that black/white biracial adolescents feel less socially accepted than single-race whites or blacks. These findings are not necessarily inconsistent, as the net differences will depend on the strength of the different social forces. Moreover, the literature on the health of biracial children is in its infancy, and it is possible that different hypothesized processes apply for different age ranges (e.g., infancy, early/middle childhood, and adolescence), health outcomes, and multiracial groups.
2.3 Health differences between children born to black mothers and white fathers and children born to white mothers and black fathers
mothers and white fathers tend to grow up in more advantaged households and thus may have associated health advantages relative to those with white mothers and black fathers.
Second, racial and gender asymmetries in the mental health consequences of interracial unions may confer health disadvantages to children with white mothers and black fathers compared to children with black mothers and white fathers. Blacks are more likely than whites to report that they “would be fine” if a family member married a spouse from another racial group (Pew Research Center 2012), suggesting that whites with black partners are more likely than blacks with white partners to experience family opposition. Perhaps due in part to these attitudinal differences, partnering with blacks is associated with a higher risk of severe distress and a greater number of depressive symptoms for whites, but partnering with whites has no significant effects on the mental health of blacks (Bratter and Eschbach 2005; Kroeger and Williams 2011). Furthermore, family opposition takes a greater toll on the mental health of white women than that of white men (Bratter and Eschbach 2005). Arguably, children with white mothers and black fathers (WB) could have a health disadvantage relative to children with black mothers and white fathers (BW) because their mothers have poorer mental health and having a parent with poor mental health increases a child’s risk for poor health (Cummings and Davies 1994).
As indicated earlier, few studies have examined how the health of children with white mothers and black fathers compares to that of individuals with black mothers and white fathers. Exceptions are the studies of birth outcomes of black/white biracial children, which indicate that infants with white mothers and black fathers have more favorable outcomes than infants with black mothers and white fathers (Collins and David 1993; Parker 2000). These findings contradict our expectation that children with black mothers and white fathers will be healthier than children with white mothers and black fathers because they grow up in more advantaged households. Whether children with black mothers and white fathers continue to have a health disadvantage relative to children with white mothers and black fathers at older ages and whether this group has disadvantages in other health outcomes remain to be empirically tested.
2.4 Hypotheses
Hypothesis 1a: Black/white biracial children will have worse health than both single-race white and single-race black children.
Hypothesis 1b: Black/white biracial children will have worse health than single-race white children, but better health than single-single-race black children.
Hypothesis 1c: The health of black/white biracial children will be similar to that of single-race black children.
In addition, the literature provides some support for each the following competing hypotheses about how the health of black/white biracial children differs according to the gender of the black parent:
Hypothesis 2a: Biracial children born to white mothers and black fathers (WB) will have worse health than those born to black mothers and white fathers (BW).
Hypothesis 2b: Biracial children born to white mothers and black fathers (WB) will have better health than those born to black mothers and white fathers (BW).
3. Data and methods
3.1 Data
The Sample Child Core Questionnaire of the 1998–2017 NHIS is well suited for this study for several reasons. First, it includes maternal and paternal identifiers in the household roster, which allows us to link children to coresident mothers and fathers. Second, it asks respondents to identify the relationship between each parent and the randomly selected child in the household. This information can be used to limit our analytical sample to children living with two biological or adoptive parents.6 Third, it
collects information on the racial/ethnic identity of all household members. We define children’s racial background using information about the race of coresident biological/adoptive mothers and fathers. Fourth, it asks adult respondents to provide proxy reports about the overall health for all children and disability status for children who participated in the Sample Child Core Questionnaire. As is the case for most national datasets, children’s self-reports about their own health are not available in the NHIS. Finally, the NHIS oversampled black households, which is necessary to obtain a large sample of black/white biracial children. The pooled dataset, before sample restrictions, consisted of 175,604 children between the ages of 2 and 14.
3.2 Sample
Our sample consists of children in the Sample Child Core Questionnaire of the NHIS living with two biological or adoptive parents, both of whom were non-Hispanic white and/or non-Hispanic black. We focus on the health of children ages 2 to 14, as this subpopulation of multiracial individuals has not been previously studied. We restrict our sample to children living in two biological/adoptive parent families because we defined children’s race using information about the racial identity of coresident mothers and fathers. We exclude children who belong to other major racial groups because there are far too few multiracial children in those groups to obtain reliable estimates. We also exclude Hispanic children for several reasons. ‘Hispanic’ is officially an ethnicity independent of race, and Hispanics are a racial heterogeneous group (Logan 2003). A small but growing body of research indicates that socioeconomic profiles, mate selection behavior, and health of Hispanics vary by race (e.g., Borrell and Dallo 2008;
6 The 1998–2012 NHIS distinguished between biological and adoptive parents. For those years, we exclude
Chinn and Hummer 2016; Logan 2003). In terms of health, black Hispanics are generally more likely than white Hispanics to have poorer health outcomes, including higher prevalence of hypertension (Borrell 2006), poor/fair self-rated health (Borrell and Dallo 2008), higher levels of functional limitations (Chinn and Hummer 2016), and worse mental health outcomes (Ramos, Jaccard, and Guilamos-Ramos 2003). Although these studies underscore the importance of examining Hispanics as a racially heterogeneous group, our analytical sample is not large enough to disaggregate biracial children of Hispanic descent by race. Because we excluded all Hispanics, we refer to non-Hispanic whites as ‘whites’ and non-Hispanic blacks as ‘blacks.’
We further limit our sample to children participating in the Sample Child Core Questionnaire for two key reasons. This questionnaire asks respondents whether the randomly selected child in a household has been diagnosed with a developmental disability, an outcome of substantive interest in this study. It also asks respondents to report the relationship between the randomly selected child and the adult who is rating the child’s health. We use this information to restrict our sample to children whose health was reported by a parent, as parents likely have more accurate information about the child’s health than other adults in the household. Like many studies of family demography (e.g., Manning and Cohen 2012; Raley 2001), we assume that the risk of childbearing begins at age 15 and exclude children born to mothers who were younger than 15 years of age. Finally, we exclude respondents with missing information on key covariates. After these restrictions, our analytical sample consisted of 49,267 children.
3.3 Key measures
3.3.1 Dependent variable
We characterize child health using two global measures of health – poor overall health and developmental disability – obtained from reports provided by a biological or adopted parent living with the randomly selected child. We focus on these measures because black-white disparities in poor overall health and developmental disability7 are
well-established (Feinberg et al. 2011; Morgan et al. 2013; Thompson 2017).
Poor overall health: The NHIS asks parents to rate the overall health status of the child as poor, fair, good, very good, or excellent. Parent ratings of their children’s overall health are a strong predictor of physician-assessed child health status as well as specific health-related outcomes (Shrivastava, Murrin, and Kelleher 2014; Spencer and
7 Of note, rates of child disability have increased substantially in the United States over recent decades,
Coe 1996). In line with several prior studies (e.g., Lawrence, Rogers, and Hummer 2018; US HHS 2014), we categorize poor, fair, or good health (i.e., less than very good health) as ‘poor overall health.’
Developmental disability: We distinguish between children diagnosed with a developmental disability and those without any developmental disability. Children are said to have a developmental disability if their parents reported that they are limited in the types or amount of play activities that they could engage in due to a physical, mental, or emotional problem (ages 2–4); they need help meeting their personal care needs (ages 3–14); they need help handling routine needs (ages 5–14); they are limited in any way because of difficulty remembering or because they experience periods of confusion (ages 2–14); they have difficulty walking without equipment due to a health illness (ages 2–14); they were diagnosed by a doctor or a health professional with ADHD, autism, cerebral palsy, intellectual disability, or learning disability (ages 2–14); or they have any other limitation (ages 2–14). This measure is a good predictor of mortality, future limitations, and health care expenditures (Berger et al. 2015). In supplementary models, we test the robustness of our results using several alternate measures of overall health and disability. They yield similar results to those presented in the main text.
3.3.2 Key independent variable
Children’s racial background: The NHIS asks an adult respondent to report the child’s race. When more than one race is reported for the child, respondents are asked to identify the ‘race that best describes the child.’ Multiracial children are assigned to single-race categories using this information. That is, if the respondent selects ‘black’ as the race that best describes a black/white biracial child, NHIS classifies that child as ‘single-race black.’ The assignment of multiracial children into single-race categories understates the number of multiracial children.8 Only when adult respondents do not
report a multiracial child’s primary race is that child classified into the general category of ‘multiracial, no primary group selected.’ As such, this category provides no information about the child’s specific racial background.
To overcome this data constraint, which characterizes many surveys, we use the maternal and paternal identifiers in the household roster files of the NHIS to link children to their coresident biological parents. Based on information about the races of coresident mothers and fathers, we classify children into four racial categories:
single-8 For example, of the 1,009 biracial children with non-Hispanic black and/or non-Hispanic white parents in
race whites (WW), single-race blacks (BB), biracial children with white mothers and black fathers (WB), and children with black mothers and white fathers (BW). A similar approach was used by Lichter and Qian (2018) in a study of the racial identification of biracial children using the American Community Survey (ACS).
3.3.3 Other variables
Characteristics of parents who selected into the distinct unions: Past studies have identified education and nativity status as important correlates of intermarriage (Qian and Lichter 2007). They have also shown evidence of strong associations between parental education and child health as well as parents’ immigration status and child health (Lara et al. 2005; Prickett and Augustine 2016). We consider differences in parental characteristics by adjusting for maternal education (less than high school, high school graduate, some college, college graduate or more), paternal education (less than high school, high school graduate, some college, college graduate or more), and parents’ nativity status (two US-born parents, US-born mother and foreign-born father, US-born father and foreign-born mother, two immigrant parents).
Children’s socioeconomic circumstances at the time of the survey: Family instability and socioeconomic disadvantage are associated with poorer physical health (Manning 2015). We capture family instability using coresident parents’ marital status (married, cohabiting). We capture children’s current socioeconomic circumstances by adjusting for parents’ employment status (neither parent is employed, only father is employed, only mother is employed, both parents are employed), household income (below the poverty line, 100%–199% of the poverty line, 200+% of poverty line), and children’s health insurance coverage (none, public, private).
All models also include basic controls, such as child’s age (in years), child’s gender (male, female), mother’s age when the child was born (<20, 20–34, 35+), number of siblings in the household, and survey year.
3.3.4 Analytical strategy
coefficient from each model and distribution of covariates for single-race whites (WW) to compute the predicted rates of poor overall health and developmental disability.9 We
compare the predicted rates from Models 1 and 2 to assess the extent to which differences in parental educational characteristics and nativity statuses contribute to group disparities in children’s health. We then compare the predicted rates from Models 2 and 3 to assess the extent to which differences in children’s socioeconomic circumstances contribute to group disparities in children’s health. All analyses are weighted. These weights are adjusted to account for the pooling of NHIS data across multiple years. We used thesvy commands in STATA 15 to account for the complex sampling design of NHIS.10
4. Results
4.1 Descriptive analysis
4.1.1 Sample characteristics
Table 1 compares children’s family background characteristics for each of the four comparison groups of children – WW, WB, BW, and BB. Demarcating differences in the distribution of parent’s education are observed between children with white and black fathers. White fathers completed more years of schooling than black fathers. For example, approximately 40% of fathers of WW and BW children graduated from college, which compares with 25%–26% of fathers of WB and BB children. Reflecting the strong preference for educational homogamy (Mare 1991; Schwartz 2013), mothers with white partners have higher levels of education relative to mothers with black partners: 43% of mothers of WW children and 37% of mothers of BW children are college graduates, compared with 26%–28% of the mothers of WB and BB children.
9 Nonlinear binary models do not identify the regression coefficient and error variance separately (Allison
1999; Karlson, Holm and Breen 2012). The error variance varies across models with distinct numbers of covariates. Comparing coefficients across models has the potential to obfuscate the actual coefficient with the error variance. Thus, we compare predicted rates of poor overall health and disability to assess the extent to which selection or children’s socioeconomic background contribute to group disparities in health.
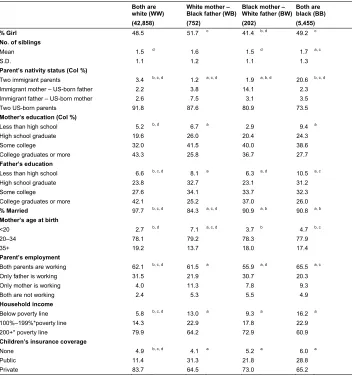
Table 1: Sample characteristics by child’s racial background
Both are
white (WW) White mother –Black father (WB) Black mother –White father (BW)Both areblack (BB)
(42,858) (752) (202) (5,455)
% Girl 48.5 51.7 c 41.4 b, d 49.2 c
No. of siblings
Mean 1.5 d 1.6 1.5 d 1.7 a, c
S.D. 1.1 1.2 1.1 1.3
Parent’s nativity status (Col %)
Two immigrant parents 3.4 b, c, d 1.2 a, c, d 1.9 a, b, d 20.6 b, c, d
Immigrant mother – US-born father 2.2 3.8 14.1 2.3 Immigrant father – US-born mother 2.6 7.5 3.1 3.5
Two US-born parents 91.8 87.6 80.9 73.5
Mother’s education (Col %)
Less than high school 5.2 b, d 6.7 a 2.9 9.4 a
High school graduate 19.6 26.0 20.4 24.3
Some college 32.0 41.5 40.0 38.6
College graduates or more 43.3 25.8 36.7 27.7
Father’s education
Less than high school 6.6 b, c, d 8.1 a 6.3 a, d 10.5 a, c
High school graduate 23.8 32.7 23.1 31.2
Some college 27.6 34.1 33.7 32.3
College graduates or more 42.1 25.2 37.0 26.0
% Married 97.7 b, c, d 84.3 a, c, d 90.9 a, b 90.8 a, b
Mother’s age at birth
<20 2.7 b, d 7.1 a, c, d 3.7 b 4.7 b, c
20–34 78.1 79.2 78.3 77.9
35+ 19.2 13.7 18.0 17.4
Parent’s employment
Both parents are working 62.1 b, c, d 61.5 a 55.9 a, d 65.5 a, c
Only father is working 31.5 21.9 30.7 20.3
Only mother is working 4.0 11.3 7.8 9.3
Both are not working 2.4 5.3 5.5 4.9
Household income
Below poverty line 5.8 b, c, d 13.0 a 9.3 a 16.2 a
100%–199%*poverty line 14.3 22.9 17.8 22.9
200+* poverty line 79.9 64.2 72.9 60.9
Children’s insurance coverage
None 4.9 b, c, d 4.1 a 5.2 a 6.0 a
Public 11.4 31.3 21.8 28.8
Private 83.7 64.5 73.0 65.2
Source: 1998–2017 National Health Interview Survey.
Note: Sample: Children in two-parent families with non-Hispanic white and/or non-Hispanic black parents. Figures are weighted percentages. Ns are not weighted.aSignificantly different from WW; bSignificantly different from WB; cSignificantly different from
BW;dSignificantly different from BB. Statistical significance is determined at α=0.05.
biracial children are more likely than single-race whites and blacks to have mixed-nativity parents: 12% of WB and 17% of BW children versus 5%–6% of single-race white and black children. Because foreign-born blacks cross racial barriers to union formation at higher rates than US-born blacks (Qian and Lichter 2007), BW children are significantly more likely to have immigrant mothers and US-born fathers, whereas, WB children are more likely than BW children to have US-born mothers and immigrant fathers.
WW children grow up in more affluent households relative to children with at least one black parent. WW children are less likely than to live in households with incomes below the poverty line: 6% of WW children versus 9%–16% of children with at least one black parent. Reflecting their more advantaged backgrounds, WW children are more likely than the other children in our study to have private insurance. Over 80% of WW children have private insurance, compared to 65%–73% of children with at least one black parent.
WB children live in more disadvantaged households than BW children. WB children are less likely than BW children to have parents who are married: 84% versus 91%. They are also less likely than BW children to live in a household with income levels more than double the federal poverty line: 64% of WB versus 73% of BW children. WB children are also less likely than BW children to rely on private health insurance coverage: 65% versus 73%.
4.1.2 Disparities in health by children’s racial background
Table 2 documents the rates of poor overall health and developmental disability across the four comparison groups of children. BB children have the highest and WW children have the lowest rate of poor overall health: 18% versus 9%. At 13%, the rate of poor overall health of WB children is higher than that of WW children but lower than that of BB children. At 10%, the rate of poor overall health among BW children is significantly lower than that of BB children. The rate of poor overall health of BW children is not significantly different from the corresponding rates for WW or WB children, which is likely the product of their small size.
Table 2: Health disparities by child’s racial background
Children’s health N % Poor overall health 95th CI
a) Poor overall health
Same-race White (WW) 42,858 9.1 b, d 8.8 9.4
White mother – Black father (WB) 752 13.0 a, d 10.5 16.0
Black mother – White father (BW) 202 10.3 d 6.5 15.9
Table 2: (Continued) b) Any developmental disability
Same-race White (WW) 42,858 12.1 d 11.8 12.5
White mother – Black father (WB) 752 9.4 7.1 12.3 Black mother – White father (BW) 202 12.1 7.0 20.0
Same-race Black (BB) 5,455 9.6 a 8.7 10.5
Source: 1998–2017 National Health Interview Survey.
Note: Sample: Children in two-parent families with non-Hispanic white and/or non-Hispanic black parents. Figures are weighted percentages. Ns are not weighted.aSignificantly different from WW; bSignificantly different from WB; cSignificantly different from
BW; dSignificantly different from BB. Statistical significance is determined at α=0.05.
Clear differences in disability rates are observed between children with black fathers (i.e., WB, BB) and children with white fathers (i.e., WW, BW). In line with past findings on black-white differences in cognitive disability (Morgan et al. 2013), our results show that single-race black children (BB) are significantly less likely than single-race whites (WW) to have a developmental disability: 10% versus 12%. This finding is partially attributable to the socioeconomic disadvantage of BB children and the fact that developmental disability is diagnosed at lower rates among children with a socioeconomic disadvantage (Morgan et al. 2013). The share of WB children who are diagnosed with a developmental disability (9%) is nearly identical to that for BB children. The share of BW children with a disability (12%) is nearly identical to that for WW children.
4.2 Multivariate analysis
4.2.1 Disparities in children’s poor overall health according to their race
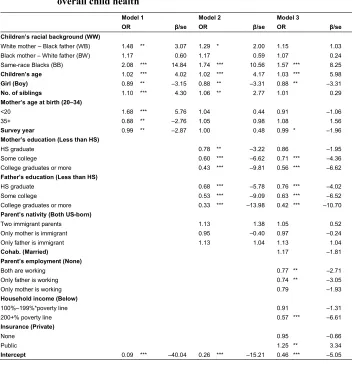
Table 3: Multivariate logistic regression models predicting the odds of poor overall child health
Model 1 Model 2 Model 3
OR β/se OR β/se OR β/se
Children’s racial background (WW)
White mother – Black father (WB) 1.48 ** 3.07 1.29 * 2.00 1.15 1.03 Black mother – White father (BW) 1.17 0.60 1.17 0.59 1.07 0.24 Same-race Blacks (BB) 2.08 *** 14.84 1.74 *** 10.56 1.57 *** 8.25
Children’s age 1.02 *** 4.02 1.02 *** 4.17 1.03 *** 5.98
Girl (Boy) 0.89 ** –3.15 0.88 ** –3.31 0.88 ** –3.31
No. of siblings 1.10 *** 4.30 1.06 ** 2.77 1.01 0.29
Mother’s age at birth (20–34)
<20 1.68 *** 5.76 1.04 0.44 0.91 –1.06
35+ 0.88 ** –2.76 1.05 0.98 1.08 1.56
Survey year 0.99 ** –2.87 1.00 0.48 0.99 * –1.96
Mother’s education (Less than HS)
HS graduate 0.78 ** –3.22 0.86 –1.95
Some college 0.60 *** –6.62 0.71 *** –4.36
College graduates or more 0.43 *** –9.81 0.56 *** –6.62 Father’s education (Less than HS)
HS graduate 0.68 *** –5.78 0.76 *** –4.02
Some college 0.53 *** –9.09 0.63 *** –6.52
College graduates or more 0.33 *** –13.98 0.42 *** –10.70 Parent’s nativity (Both US-born)
Two immigrant parents 1.13 1.38 1.05 0.52
Only mother is immigrant 0.95 –0.40 0.97 –0.24
Only father is immigrant 1.13 1.04 1.13 1.04
Cohab. (Married) 1.17 –1.81
Parent’s employment (None)
Both are working 0.77 ** –2.71
Only father is working 0.74 ** –3.05
Only mother is working 0.79 –1.93
Household income (Below)
100%–199%*poverty line 0.91 –1.31
200+% poverty line 0.57 *** –6.61
Insurance (Private)
None 0.95 –0.66
Public 1.25 ** 3.34
Intercept 0.09 *** –40.04 0.26 *** –15.21 0.46 *** –5.05
Source: 1998–2017 National Health Interview Survey.
Note: Sample: Children in two-parent families with non-Hispanic white and/or non-Hispanic black parents. Reference categories in parentheses. Analyses are weighted. FB denotes foreign-born. USB denotes US-born. ***p<0.001; **p<0.01; *p<0.05.
a portion of the difference between WW and BB children. Overall, WW children continue to have better overall health relative to children with black fathers even after we adjust for differences in parental education and nativity status.
Model 3 accounts for group differences in children’s socioeconomic circumstances at the time of the survey. Parental employment is associated with lower odds of having poor overall health, but differentials are small between single- and dual-earner families and according to the gender of the employed parent. Higher household income is associated with lower odds of poor overall child health, with a noteworthy difference observed between households with income more than double the federal poverty line and those with income below that range. Children with public insurance are more likely than those with private insurance to have poor overall health. With the inclusion of these additional controls, the health differential between WB and WW children becomes statistically insignificant. These controls also explain some of the difference between BB and WW children, which remains statistically significant.
Table 4 presents the predicted rates of poor overall health estimated using the logistic regression coefficients from each model in Table 3 and the distribution of covariates for single-race whites (WW). We focus primarily on statistically significant differences. Differences in the characteristics of parents who select into the distinct unions and children’s socioeconomic characteristics at the time of the survey contribute to group disparities in children’s overall health. Together, these differences explain 68% of the differences in rates of poor overall health between WW and WB children: [100*(1–10.3–9.1
12.9–9.1) ≈ 68%].They explain 47% of the corresponding difference between
WW and BB children and 28% of the corresponding difference between WB and BB children: [100*(1–13.4–9.1
17.2–9.1)=47% of the WW–BB difference; 100*(1– 13.4–10.3 17.2–12.9)=28%
of the WB–BB difference].
Table 4: Predicted rates of poor overall child health by children’s racial background
Model 1: Baseline model Model 2: M1+ Selection Model 3: M2+ Children’s SES
Children’s racial background % Poor 95th CI % Poor 95th CI % Poor 95th CI
Same-race White (WW) 9.1 8.8 9.4 9.1 8.8 9.4 9.1 8.8 9.4 White mother – Black father (WB) 12.9 10.1 15.7 11.4 9.0 13.8 10.3 8.0 12.5 Black mother – White father (BW) 10.5 5.7 15.2 10.4 5.8 15.0 9.6 5.3 13.9 Same-race Black (BB) 17.2 16.0 18.4 14.6 13.5 15.7 13.4 12.3 14.4
Source: 1998–2017 National Health Interview Survey.
Differences in characteristics of parents who selected into the distinct unions (i.e., parental education, parents’ nativity status) are the key reason why children with black fathers have poorer overall health relative to WW children.11 For example, differences
in the characteristics of parents who selected into WB over WW unions explain 39% of the differences in overall health between WW and WB children: [100*(1–11.4–9.1
12.9–9.1)=39%]. In contrast, differences in children’s current socioeconomic
status accounted for 29% of the disparities between WW and WB children: [100*(11.4–9.1 – 10.3–9.1
12.9–9.1 )=29%]. Similarly, parental education and nativity status
explain 32% of the corresponding difference between WW and BB children: [100*(1–14.6–9.1
17.2–9.1)=32%]. In contrast, differences in children’s current socioeconomic
status accounted for 15% of the disparities between them: [100*(14.6–9.1 –(13.4–9.1)17.2–9.1 )=15%].
4.2.2 Disparities in children’s disability according to their racial background
Table 5 presents the results from logistic regression models predicting children’s disability. As was the case for poor overall health, older children are more likely than younger children, and boys are more likely than girls, to have a developmental disability. Unlike for poor overall health, the association between maternal age at birth and odds of having a disability follows a curvilinear pattern, with children born to teenage mothers having the highest odds of disability and children born to mothers ages 20–34 having the lowest odds of disability. Net of demographic controls, BB children have 24% lower odds of having a disability relative to WW children. The corresponding differentials are 20% for WB compared to WW children, but this difference is not statistically significant.
11 Results are largely similar when we conducted Fairlie decomposition models for non-linear models. We
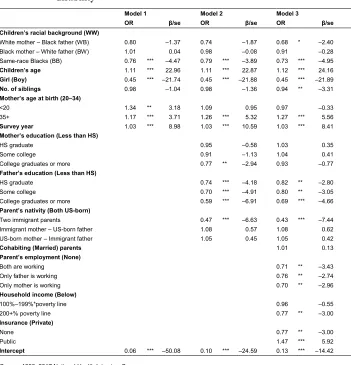
Table 5: Multivariate logistic regression models predicting the odds of child disability
Model 1 Model 2 Model 3
OR β/se OR β/se OR β/se
Children’s racial background (WW)
White mother – Black father (WB) 0.80 –1.37 0.74 –1.87 0.68 * –2.40 Black mother – White father (BW) 1.01 0.04 0.98 –0.08 0.91 –0.28 Same-race Blacks (BB) 0.76 *** –4.47 0.79 *** –3.89 0.73 *** –4.95
Children’s age 1.11 *** 22.96 1.11 *** 22.87 1.12 *** 24.16
Girl (Boy) 0.45 *** –21.74 0.45 *** –21.88 0.45 *** –21.89
No. of siblings 0.98 –1.04 0.98 –1.36 0.94 ** –3.31
Mother’s age at birth (20–34)
<20 1.34 ** 3.18 1.09 0.95 0.97 –0.33
35+ 1.17 *** 3.71 1.26 *** 5.32 1.27 *** 5.56
Survey year 1.03 *** 8.98 1.03 *** 10.59 1.03 *** 8.41
Mother’s education (Less than HS)
HS graduate 0.95 –0.58 1.03 0.35
Some college 0.91 –1.13 1.04 0.41
College graduates or more 0.77 ** –2.94 0.93 –0.77 Father’s education (Less than HS)
HS graduate 0.74 *** –4.18 0.82 ** –2.80
Some college 0.70 *** –4.91 0.80 ** –3.05
College graduates or more 0.59 *** –6.91 0.69 *** –4.66 Parent’s nativity (Both US-born)
Two immigrant parents 0.47 *** –6.63 0.43 *** –7.44 Immigrant mother – US-born father 1.08 0.57 1.08 0.62 US-born mother – Immigrant father 1.05 0.45 1.05 0.42
Cohabiting (Married) parents 1.01 0.13
Parent’s employment (None)
Both are working 0.71 ** –3.43
Only father is working 0.76 ** –2.74
Only mother is working 0.70 ** –2.96
Household income (Below)
100%–199%*poverty line 0.96 –0.55
200+% poverty line 0.77 ** –3.00
Insurance (Private)
None 0.77 ** –3.00
Public 1.47 *** 5.92
Intercept 0.06 *** –50.08 0.10 *** –24.59 0.13 *** –14.42
Source: 1998–2017 National Health Interview Survey.
Note: Sample: Children in two-parent families with non-Hispanic white and/or non-Hispanic black parents. Reference categories in parentheses. Analyses are weighted. ***p<0.001; **p<0.01; *p<0.05.
between children born to mothers who are college graduates and those with lower levels of education. Unlike with poor overall health, having two foreign-born parents is associated with significantly lower odds of the child being diagnosed with a disability. This pattern likely emerges because immigrants have more limited access to health care. With the inclusion of these controls, differences between WB and WW children increase and become marginally significant. Stated differently, WB children would have even lower rates of disability, if it were not for (a) their parents’ lower educational attainment and (b) the fact that relative to WW children, a higher share of WB children was born to two immigrant parents. Controlling for parents’ education and nativity status has little impact on differences in disability between WW children and children with black fathers.
Model 3 controls for children’s socioeconomic circumstances at the time of the survey. As was the case for poor overall health, parental employment, household income, and not having any insurance coverage are associated with lower odds of the child having a disability. In contrast, having public insurance is associated with higher odds of the child having a disability.
Differences in children’s socioeconomic circumstances further suppress differences in the odds of having a disability between WW and children with black fathers. With the inclusion of these controls, the difference between WB and WW increases further and becomes statistically significant. Adjusting for differences in parental characteristics has the same effect on differences between WW and BB children but to a much smaller extent.
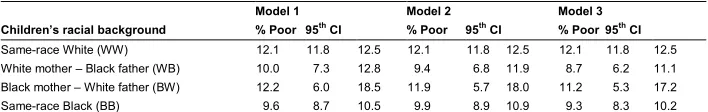
Table 6 shows that both selection and children’s socioeconomic background both suppress disparities in disability rates between WW and WB children. Once we adjust for differences in characteristics of parents who select into distinct unions, disparities in rates of disability between WB and WW children increase by 32%: [100*((12.1–9.4)
(12.1–10.0)– 1)=32%].Controlling for differences in children’ socioeconomic
conditions at the time of the survey further increase differences between WB and WW children by 25%: [100*((12.1–8.7)
(12.1–9.4)– 1)=25%]. Differences in the educational
Table 6: Predicted rates of child disability by children’s racial background
Model 1 Model 2 Model 3
Children’s racial background % Poor 95th CI % Poor 95th CI % Poor 95th CI
Same-race White (WW) 12.1 11.8 12.5 12.1 11.8 12.5 12.1 11.8 12.5 White mother – Black father (WB) 10.0 7.3 12.8 9.4 6.8 11.9 8.7 6.2 11.1 Black mother – White father (BW) 12.2 6.0 18.5 11.9 5.7 18.0 11.2 5.3 17.2 Same-race Black (BB) 9.6 8.7 10.5 9.9 8.9 10.9 9.3 8.3 10.2
Source: 1998–2017 National Health Interview Survey.
Note: Sample: Children in two-parent families with non-Hispanic white and/or non-Hispanic black parents. Predicted rates are computed using the logistic regression coefficients from Table 5 and the distribution of covariates for single-race whites (WW).
5. Supplementary analyses
We conducted a number of supplementary analyses to assess the robustness of the estimates to alternative sample restrictions and measures. These results are available upon request. First, our analytical sample in the main text was limited to children that participated in the Sample Child Core Questionnaire, which randomly sampled a child in each NHIS household. The full NHIS asked about the overall health status of all household members, including all the children in the household. As stated earlier, the full NHIS does not include questions about disability or the relationship between the child and the adult respondent. As a robustness check, we estimated children’s poor overall health using the full NHIS. The sample size was over twice as large as that of our main analytical sample. The estimates were very similar to those presented in Table 3. The only difference between the results obtained using the full NHIS sample and those presented in the main text is that the difference in poor overall health between BW and WW children became statistically significant, owing to the larger number of BW children.
Second, to assess the extent to which the inclusion of children living with adoptive parents after 2012 (see Footnote 6) affected our estimates, we ran all analyses using a sample consisting of children living with adopted and biological children for all years of the NHIS data. Results obtained using this alternative sample were very similar to those presented in the main text, suggesting that the share of adopted children was too small to affect our estimates.
Fourth, we estimated models that excluded father’s education and included a measure that describes the educational resemblance between the child’s parents (the mother has higher education, the father has higher education, parents have the same levels of education). The educational resemblance between parents was not statistically significant and did not improve model fit. That is, the model including maternal and paternal education fits the data better.
Fifth, foreign-born blacks are more socioeconomically advantaged relative to US-born blacks. They are more likely than US-US-born blacks to have college degrees, have higher median household incomes, and are less likely to live in poverty (Andersen 2015). Partly due to their socioeconomic advantage, foreign-born blacks also have a health advantage relative to US-born blacks (Elo, Mehta, and Huang 2011). Controlling for parents’ nativity status may not be sufficient to account for the heterogeneity within the black population. Therefore, we ran all models relying on a sample that excluded all foreign-born blacks. Results from these analyses are largely robust with those presented in the main text.
Finally, in the text, we used predicted probabilities to assess the extent to which selection and children’s socioeconomic circumstances at the time of the survey contribute to group disparities in health. We conducted Fairlie’s decomposition models for binary outcomes to test the robustness of our results. The results from these models are largely robust with those presented in Tables 4 and 6.
6. Discussion
We found that the health of black/white biracial children generally falls between that of single-race white and single-race black children. Consistent with the prediction of Hypothesis 1b, our findings indicate that the rates of poor overall health of black/white biracial children (i.e., WB, BW) were higher than that of single-race white (WW) children, but lower than that of single-race black (BB) children. The rate of disability for children born to white mothers and black fathers (WB) was similar to that of BB children. The disability rate of children born to black mothers and white fathers (BW) is similar to that of WW children. We did not find any evidence in support of the hypothesis that biracial individuals have worse health relative to single-race white and single-race black children (Hypothesis 1a).
Second, BW children have lower rates of poor overall health, but higher rates of disability, relative to WB children. This finding suggests that health conditions are more likely to be diagnosed and managed for BW children than WB children, which would be consistent with their socioeconomic differentials.
Third, the health outcomes of WB children tend to mirror more closely those of BB children, whereas the health outcomes of BW children tend to mirror more closely those of WW children. This finding, which underscores the importance of paternal race for child health, emerges because interracial unions involving black female and white male partners (BW) are more positively selected than interracial unions involving white female and black male partners (WB) (Choi and Goldberg 2018). It may also reflect the fact that family opposition takes a greater toll on whites relative to blacks and on white women relative to white men (Bratter and Eschbach 2005). Overall, these findings suggest that treating black/white biracial children as one racial category masks important heterogeneity within this group and highlight the importance of the gender of the black parent. That said, most of the health disparities between BW children and WB children were not statistically significant, reflecting the small numbers of BW children in our sample. Future work with larger samples of BW children should further explore this suggestive pattern.
Fourth, the educational disadvantage of parents is the primary reason why children with black fathers (i.e., WB, BB) are more likely than WW children to have poor overall health. Parents of children with black fathers complete less schooling than WW children. Lower levels of parental education are associated with higher rates of poor overall health. In contrast, educational differences have minimal impact on differences in rates of poor overall health between BW and WW children.
While this study makes important contributions to the relatively new and emerging literature on the health of biracial individuals as well as the broader and more developed literature on health disparities by race, it is not without limitations. First and foremost, because like many datasets the NHIS assigns most multiracial children into single-race categories, we rely on information about the racial identity of coresident parents to define children’s racial background. The trade-off of this approach is that we needed to limit our sample to children who were living with two biological/adoptive parents. Single parenthood is more common among blacks than among whites (McLanahan 2004). Biracial children are also more likely than single-race children to be born out of wedlock, and interracial unions are typically less stable than same-race unions (Goldstein and Harknett 2006; Kreider 2000). As such, the biracial and single-race black children in our sample may be positively selected in terms of socioeconomic status. Because socioeconomic status is associated with health, we may have underestimated the health disparities between single-race white children and those with at least one black parent. We urge future data collection efforts to report the race of both parents, irrespective of the child’s family structure, and to discontinue the practice of assigning children who report more than one race to single-race categories. That approach would permit the consideration of the racial composition of all biracial children, including those living in single-parent families, and allow for analyses that consider the gender of the black parent (Lichter and Qian 2018; Wey et al. 2018).
Second, although we pooled 20 years of NHIS data and the NHIS oversamples black families, our sample includes a small number of BW children because interracial unions involving black women and white men are relatively rare (Pew Research Center 2012). Owing to sample size constraints, it is hard to establish statistical significance with this group, and our inferences in that regard are thus based on observed patterns. Data collection efforts should consider oversampling this group to allow for more refined analyses of racial inequalities in health and underlying social processes (e.g., selection).
Third, we relied on standard but basic survey questions on children’s poor overall health status and disability. Other relevant health measures in the NHIS, such as obesity, are available only for a subset of the sample that does not provide adequate numbers of biracial children for meaningful analysis. Future work on the health of multiracial individuals should examine a more specific set of health outcomes, including cardiovascular risk factors, for which health disparities by race are particularly prominent, and potentially incorporate biomarker data.
and differential access to medical services contribute to multiracial children’s health. Such analyses can also help develop much-needed theoretical frameworks that guide explanations for disparities between biracial and single-race individuals. The need for the development of such theoretical frameworks has been underscored in several past studies (e.g., Choi and Goldberg 2018; Zhang and Van Hook 2009).
The above limitations notwithstanding, this study makes clear and important contributions to the small nascent literature on multiracial health by investigating the health of biracial children and considering the gender of the black parent. Our findings make clear the importance of paternal race in shaping child health and underscore the importance of considering both paternal and maternal race when attempting to understand racial disparities in children’s health. On a broad level, the findings suggest that the rising numbers and shares of multiracial children in the United States have made the racial disparities more multi-faceted.
7. Acknowledgments
References
Allison, P. (1999). Comparing logit and probit coefficients across groups.Sociological Methods and Research 28(2): 186–208.doi:10.1177/0049124199028002003. Andersen, M. (2015). A rising share of the US black population is foreign born.
Washington, D.C.: Pew Research Center. https://www.pewresearch.org/wp-content/uploads/sites/3/2015/04/2015-04-09_black-immigrants_FINAL.pdf. Bailey, S., Saperstein, A., and Penner, A. (2014). Race, color, and income inequality
across the Americas. Demographic Research 31(24): 735–756. doi:10.4054/ DemRes.2014.31.24.
Bany, J.A., Robnett, B., and Feliciano, C. (2014). Gendered black exclusion: The persistence of racial stereotypes among daters. Race and Social Problems
6(3): 201–213.doi:10.1007/s12552-014-9122-5.
Berger, N., Van Oyen, E., Cambois, T., Fouweather, C., Jagger, W., Nusselder, J., and Robine, J.-M. (2015). Assessing the validity of the global activity limitation indicator in fourteen European countries.BMC Medical Research Methodology
15(1): 1–8.doi:10.1186/1471-2288-15-1.
Berkman, L. and Mullen, J. (1997). How health behaviors and the social environment contribute to health differences between black and white older Americans. In: Martin, L.G. and Soldo, B.J. (eds.).Racial and ethnic differences in the health of older Americans. Washington, D.C.: National Academies Press: 163–182. Blewett, L.A., Drew, J.A.R., Griffin, R., King, M.L., and Williams, K.C.W. (2016).
IPUMS Health Surveys: National Health Interview Survey, Version 6.2 [dataset]. Minneapolis: University of Minnesota.doi:10.18128/d070.v6.2. Borrell, L.N. and Dallo, F.J. (2008). Self-rated health and race among Hispanic and
non-Hispanic adults. Journal of Immigrant Minority Health 10(3): 229–238.
doi:10.1007/s10903-007-9074-6.
Bratter, J.L. and Eschbach, K. (2005). What about the couple? Interracial marriage and psychological distress.Social Science Research35(4): 1025–1047.doi:10.1016/ j.ssresearch.2005.09.001.
Bratter, J.L. and Whitehead, E. (2018). Ties that bind: Comparing kin support availability of mixed-race and monoracial infants. Journal of Marriage and Family 80(4): 951–962.doi:10.1111/jomf.12485.
Brunsma, D.L. (2006). Public categories, private identities: Exploring regional differences in the biracial experience.Social Science Research 35(3): 555–576.
doi:10.1016/j.ssresearch.2004.10.002.
Campbell, M.E. and Eggerling-Boeck, J. (2006). What about the children? The psychological social wellbeing of multiracial adolescent.Sociological Quarterly
47(1): 147–173.doi:10.1111/j.1533-8525.2006.00041.x.
Chen, E., Martin, A.D., and Matthews, K.A. (2006). Understanding health disparities: The role of race and socioeconomic status in children’s health. American Journal of Public Health96(4): 702–708.doi:10.2105/AJPH.2004.048124. Chinn, J.J. and Hummer, R.A. (2016). Racial disparities in functional limitations among
Hispanic women in the United States. Research on Aging 38(3): 399–423.
doi:10.1177/0164027515620244.
Choi, K.H. and Goldberg, R.E. (2018). Fertility of interracial couples. Journal of Marriage and Family80(4): 871–881.doi:10.1111/jomf.12483.
Collins, J.W. and David, R. (1993). Race and birthweight in biracial children.American Journal of Public Health 83(8): 1125–1129.doi:10.2105/AJPH.83.8.1125.
Collins, P.H. (2005). Black sexual politics: African Americans, gender, and the new racism. New York: Routledge.
Cornell, S. and Hartmann, D. (2007). Ethnicity and race: Making identities in a changing world. Thousand Oaks: Pine Forge Press.
Cummings, E.M. and Davies, P.T. (1994). Maternal depression and child development.
Journal of Child Psychology and Psychiatry 35(1): 73–112. doi:10.1111/j.1469-7610.1994.tb01133.x.
Elo, I.T., Mehta, N.K., and Huang, C. (2011). Disability among native-born and foreign-born blacks in the United States. Demography 48(1): 241–265.
doi:10.1007/s13524-010-0008-x.
Gans, K.M., Burkholder, G.J., Risica, P.M., and Lasater, T.M. (2003). Baseline fat-related dietary behaviors of white, Hispanic, and black participants in a cholesterol screening and education project in New England. Journal of the American Dietetic Association 103(6): 699–706.doi:10.1053/jada.2003.50135. Gee, G.C. and Ford, C.L. (2011). Structural racism and health inequalities: Old issues,
new directions. Du Bois Review: Social Science Research on Race 8(1): 115– 132.doi:10.1017/S1742058X11000130.
Goldstein, J. and Harknett, K. (2006). Parenting along racial and class lines: Assortative mating patterns of new parents who are married, cohabiting, dating, and no longer romantically involved. Social Forces 85(1): 121–143. doi:10.1353/ sof.2006.0125.
Gullickson, A. (2006). Education and black/white interracial marriage. Demography
43(4): 673–689.doi:10.1353/dem.2006.0033.
Halfon, N., Houtrow, A., Larson, K., and Newacheck, P.W. (2012). The changing landscape of disability in childhood. The Future of Children 22(1): 13–42.
doi:10.1353/foc.2012.0004.
Herman, M.R. and Campbell, M.E. (2012). I wouldn’t, but you can: Attitudes toward interracial relationships. Social Science Research 41(2): 343–358.doi:10.1016/ j.ssresearch.2011.11.007.
Hudson, C.E. (2008). An integrative review of obesity prevention in African American children. Issues in Comprehensive Pediatric Nursing 31(4): 147–170.
doi:10.1080/01460860802475168.
Hummer, R.A. (1996). Black-white differences in health and mortality: A review and conceptual model. Sociological Quarterly 37(1): 105–125. doi:10.1111/j.1533-8525.1996.tb02333.x.
Hummer, R.A. and Hamilton, E.R. (2010). Race and ethnicity in fragile families.
Future of Children 20(2): 113–131.doi:10.1353/foc.2010.0003.
Jackson, M.I. (2015). Cumulative inequality in child health and academic achievement.
Journal of Health and Social Behavior 56(2): 262–280.doi:10.1177/00221465 15581857.
Kalil, A. and Ryan, R.M. (2010). Mothers’ economic conditions and sources of support
in fragile families.The Future of Children 20(2): 39–61.doi:10.1353/foc.2010.