http: // www.gjesrm.com (C) Global Journal of Engineering Science and Research Management
65
GENERALIZED METHOD FOR ESTIMATING VARIABILITY IN DIRECTLY CONNECTED
IMPERVIOUS AREAS
Ahmed Said
PhD, PE Principal Engineering Consultant, Hydro Assess, Inc.21859 State Road 54, Lutz, FL 33549, USA. *Correspondence Author: Ahmed Said
Keywords:
National land cover data (NLCD)Runoff to rainfall ratio.Abstract
Determining impervious areas is a key factor regarding the expected amount of runoff in an urbanized watershed. Imperviousness occurs from land alterations that change the predevelopment hydrology, especially as relates to land cover and its effects on surface infiltration. An urbanized watershed can be divided into three general types: Directly Connected Impervious Area (DCIA), Non-Directly Connected Impervious Area (NDCIA), and Pervious Area (PA). Runoff from DCIAs is conveyed directly to storm water sewers while runoff from NDCIA may pass through a PA before it reaches the drainage system. The amount of DCIA is highly unknown, yet it is often the dominant factor in most urban environments. Total Impervious Area (TIA) is defined as the sum of DCIA and NDCIA.
In the past, several methods have been applied in the estimation of TIA. Among these methods are direct field measurements, empirical equations, and interpretation of satellite images. While empirical relationships have been developed for different land cover, generalized methods still need to be developed. In this study, DCIA as a function of rainfall depth was estimated. DCIA reaches its maximum value when enough rainfall has occurred to connect runoff from all impervious surfaces (TIA). The new approach was tested with rainfall runoff data on a small, but highly urbanized catchment in Temple Terrace, FL. The result of this research indicated that impervious surfaces become increasingly effective in generating storm water runoff with increased rainfall depth and decreased infiltration. The results of this research can be used to study the impact of urbanization on storm water runoff and improve hydrologic modeling.
Introduction
Methods for calculating flows from small urban catchments, where no measurements of flow are available, consider the fraction of the contributing area that generates most of the storm water runoff. For example, procedures such as the rational method indicate that if the area is impervious the runoff coefficient is close to unity and most precipitation runs off. In reality not all the impervious areas are effective in generating runoff. A large fraction of impervious surfaces may not directly connect to a conveyance system (i.e., impervious areas may flow over PAs). TIA can be divided into Directly Connected Impervious Area (DCIA) and Non-Directly Connected Impervious Area (NDCIA). Measuring DCIA can be complicated because it requires identifying and adding all impervious surfaces that flow directly into a conveyance system (Alley and Veenhuis, 1983; Laenen, 1983; Prysch and Ebbert, 1986). Very often the specific area results are applied as a correlation between the resultant DCIA and TIA to a representative land cover. Impervious areas are also considered to be directly connected if runoff occurs as a concentrated shallow flow that is conveyed through a pervious area, such as a roadside swale before it reaches a drainage system (USDA, 1994). High resolution remote sensing methods (LiDAR and Color Spectral Analysis) have promise, but still have items that need to be addressed.
Impervious surfaces in urban catchments influence hydrology by increasing runoff through a decrease in infiltration and evaporation. Even when inception losses may be increased. Quantifying impervious surface coverage is therefore crucial to managing storm water in urban areas. Generally, non-urbanized basins have greater interception. While urbanized basins have a higher peak discharge, more runoff volume, higher velocity, shorter time of concentration, and more pollutant loads to surface water syst ems. Results from four sites in South Florida indicated that DCIAs were responsible for 50 to 100% of the total runoff and that DCIA runoff generally exceeds all other runoff for most landuse types. Specifically, for the highway environment studied, the DCIA represented only 18% of the total land area while yielding 80% of the total runoff. For commercial areas, the DCIA represented 98% of the total land area and essentially 100% of the total runoff volume (Lee and Heaney, 2003). Fankhauser (1999) used color and infrared aerial photos to classify impervious surfaces at 0.25 and 0.75 m resolution based on classification algorithms. Estimated impervious surfaces based on color photo analysis were within 90% agreement of field observation measurements of impervious surfaces. Dufour and Wright (2008) compared the USGS 2001 National Land Cover Data (NLCD) TIA estimates with three local agency estimates of TIA in the San Francisco Bay area and adjusted the NLCD-derived TIA estimates to be consistent with local agency estimates. They also conducted a reality check on the contribution of runoff from the impervious areas derived from the three different methods.
Many storm water models that require data on impervious surfaces do not distinguish between DCIA and NDCIA areas. The total impervious area (TIA) is often the parameter normally used to characterize urban development in hydrologic models.
http: // www.gjesrm.com (C) Global Journal of Engineering Science and Research Management
66
percent of impervious area in the contributing watershed has been carefully documented in a review article by Schueler (1995) but several issues remain ambiguous. The TIA is the fraction of the watershed covered by constructed, non-infiltrating surfaces such as concrete, asphalt, and buildings (Hill et al, 2003). Hydrologically, this definition may not be sufficient to estimate runoff from impervious surfaces for two reasons. First, it ignores nominally “pervious” surfaces that are sufficiently compacted or otherwise so low in permeability that the rate of runoff from them is similar or indistinguishable from pavement. For example, Wigmosta et al (1994) found that the impervious area runoff was only 20 percent greater than that from low permeable pervious areas, primarily thin-sodded lawns over glacial till in a western Washington residential subdivision (Burges et al, 1989). Secondly, TIA includes some paved surfaces that contribute nothing to the storm water runoff response of a downstream channel. For example, an isolated area in the middle of a previous area probably will impose no hydrologic changes into the catchment except a much-localized elevation of soil moisture at the edge of its roof. A rooftop that drains by pipe systems to previous areas is another example. These previous areas may be connected and generate runoff under some rainfall threshold. To reflect the varying degree of connectivity between impervious surfaces, it is important to consider rainfall depth, which often controls the degree of connectivity of impervious surfaces. Most hydrologists believe that NDCIA will contribute storm water runoff for large rainfall events, when runoff over these surfaces flows over saturated pervious surfaces before reaching the storm water system. Currently, we do not have a systematic methodology to estimate the effective contribution of these areas into urban runoff.
The objective of this study is to review and compare existing methods to estimate DCIA and to develop and test a new approach based on rainfall depth. TIA was estimated from the 2001 NLCD for three counties in west Florida, and one watershed were selected to compare the NLCD-derived DCIA/TIA. For the three counties, the DCIA was estimated using empirical methods based on the percentage of TIA.
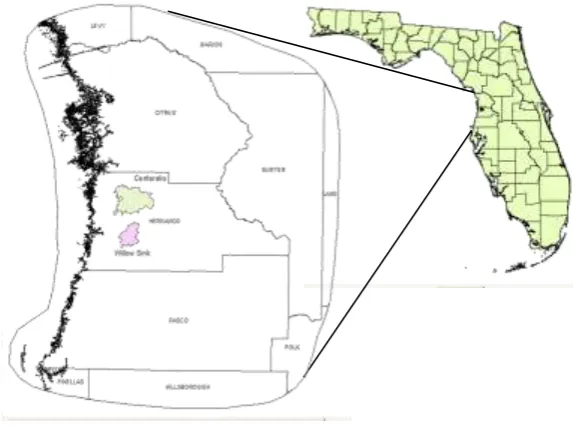
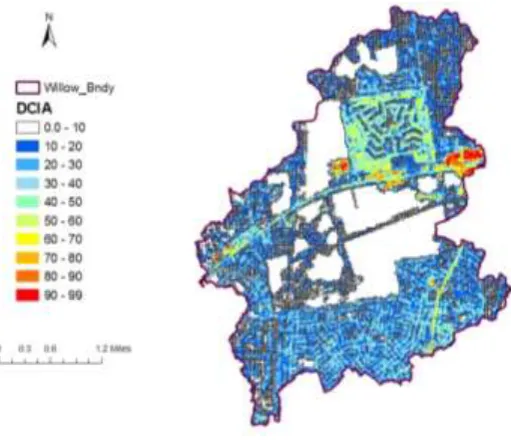
The study area is within the central-west Florida coastal region that includes Pasco, Citrus, and Hernando counties. The specific study area includes Willow Sink watershed located in Hernando County (Figure 1). Willow Sink covers 15.6 km2 (9.7 mile2) In Willow Sink watershed, the topography is higher than in the eastern parts and gradually dips westward towards Gulf of Mexico.
Methodology
County data
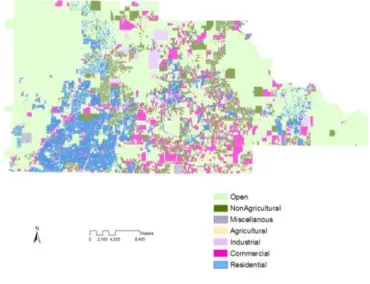
Detailed data from the Hernando County Tax Assessors office was obtained that included all structures (e.g., house areas, detached carports, detached garages, porches, sheds, etc.) and features (e.g., attached garages, carports, pools, driveways, etc.). The data was classified into five general categories: residential, commercial, agricultural, nonagricultural, golf courses, miscellaneous (e.g., schools, churches, etc.), and open space (Figure 2). Roads were classified as paved and road right-of-way areas, which includes roadside shoulders, ditches, public utilities, and sidewalks.
National land cover data (NLCD)
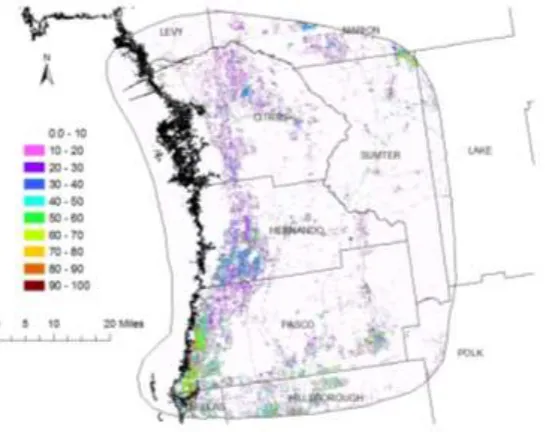
Land cover was developed using circa-2001 Landsat 7 remote-sensing data. The NLCD grouped the 76 standard NLCD mapping zones into 15 larger zonal areas for easier distribution and download. The data used in this study was downloaded for Zone 14. The NLCD 2001 includes significant advances over the 1992 data set. In addition to land cover, NLCD 2001 provides distribution of the percent of tree cover, and percent of impervious surface at 30 m resolution as shown in Figure 3.
Runoff to rainfall ratio
According to Dayaratne (2000), the area of an urban catchment can be divided into three significant catchment surfaces: hydraulically connected impervious area, supplementary area, and pervious area. Supplementary areas are impervious surfaces not directly connected to the drainage system (NDCIA), but runoff from these areas flows over pervious surfaces before reaching the drainage system. When runoff from the NDCIA reaches the storm water system via overland flow the areas become connected and contribute urban storm water runoff. Therefore, the DCIA is expected to increase with time during a storm as:
P
Q
DCIA
(1)Where ΔQ and ΔP are changes in urban storm water runoff and precipitation, respectively.
Empirical Methods to Estimate DCIA
http: // www.gjesrm.com (C) Global Journal of Engineering Science and Research Management
67
Veenhuis and Sutherland estimates are greater for roads, which then result in 17 to 39 percent DCIA (Dufour and Wright, 2008). The following is an empirical equation from Alley and Veenhuis in a study of highly urbanized watersheds (R2 = 0.98):
41 . 1
15
.
0
TIA
DCIA
(2)Note DCIA and TIA are expressed as percentages of catchment area in equation 2. Laenen (1983) developed another empirical relationship based on work completed in urban areas in Oregon on 40 watersheds. This equation is:
MIA
DCIA
3
.
6
0
.
43
(3)Where MIA is mapped urban impervious area. This equation implies that there will always be some connected impervious areas (3.6%) even though no impervious urban areas may be mapped; especially in areas with volcanic rock outcrops. The data used by Laenen to develop Equation (3) was re-analyzed by Sutherland (2000) and a series of equations were developed to provide estimates of DCIA values for input into hydrologic models. For extremely disconnected basins, with either extensive infiltration measures or basin serviced predominantly open conveyance systems such as ditches/swales:
0 . 2
01
.
0
TIA
DCIA
(4)To compare with earlier results, the TIA in this study is calculated from the detailed county data that contains all the structure information associated with a parcel in a feature class. SAS code was written to calculate the percent impervious and percent of DCIA for different land cover categories using equations 2 through 5.
Typical land use values
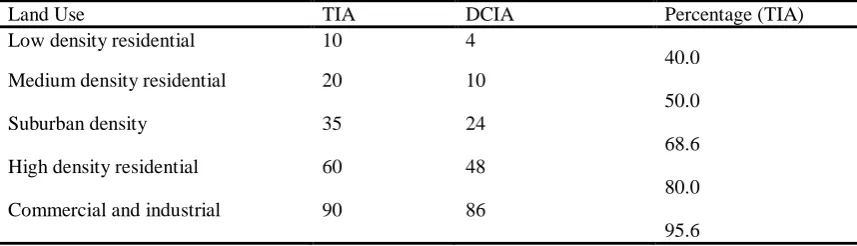
Instead of empirical equations, Dinicola (1989) compiled the findings of numerous earlier studies and tabulated recommendations on DCIA based on land use categories. The results are shown in Table 1.
New approach for variable DCIA
While impervious surfaces draining directly to storm water inlets and culverts respond immediately to small rainfall (1.27 cm or 0.5 inch), NDCIA may contribute runoff later as the rainfall event progresses. The physical connection between various impervious areas and a storm water drainage system is a function of many factors. When rain starts, it gradually connects impervious areas via shallow overland or concentrated flow as surface saturation expands over the catchment. Obviously, if the rain or runoff saturates or exceeds the infiltration capacity of the upper soils, then all impervious surfaces will be connected and runoff will continue at some rate from these surfaces.
Many examples in nature show that when the environment is constant, a variable will fluctuate up to the maximum functional capacity of the environment. For instance, most hydrological and biological processes can be presented by power or exponential function. Both the power and exponential equations share the characteristic of being nonlinear. The exponential and power graphs can demonstrate the characteristics of hydrological fluxes in terms of increasing/decreasing faster in the beginning, while having asymptotic rate as time approaches infinity. An example is Horton's Equation for infiltration, which is an exponential decay function giving higher values for infiltration when the ground is dry and asymptotically approaching the infiltration rate for a saturated wetting front.
Fluxes modeled by power functions can look like those modeled by exponential and logarithmic functions Power functions are the most dominant behavior in biological and geomorphological processes. First order mathematic models are of fundamental importance since many processes in environmental engineering and hydrology can be modeled with this kinetics. DCIA increases as a first order function of rainfall depth. As more impervious surfaces connect to the storm water system, runoff will occur at a rate that is a function of the ultimate TIA. Therefore, we propose to use the following relation between variable DCIA and TIA:
)
10
-1
(
-xrTIA
DCIA
(5)Where percent of imperviousness and r = rainfall depth in inches
Runoff from NDCIA is associated with larger storms. For example, much of the rain that falls on roofs of residential areas drains to the grass, and infiltrates, and does not contribute to storm water runoff for small rain events. For larger events, runoff from these surfaces is large enough to overwhelm the PA infiltration capacity and discharges to the storm water system, increasing impervious area, and its contribution to storm water runoff.
http: // www.gjesrm.com (C) Global Journal of Engineering Science and Research Management
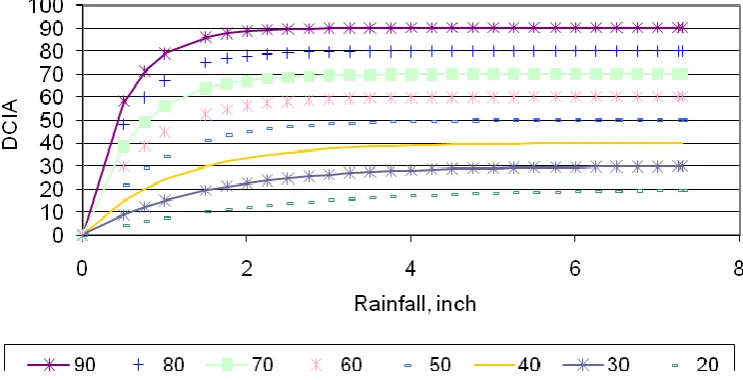
68
areas decrease as TIA increases, as shown in Figure 4. For example, commercial areas with high TIA (90% line) would require less rainfall to connect the various impervious surfaces.
Results
Comparison of existing empirical methods
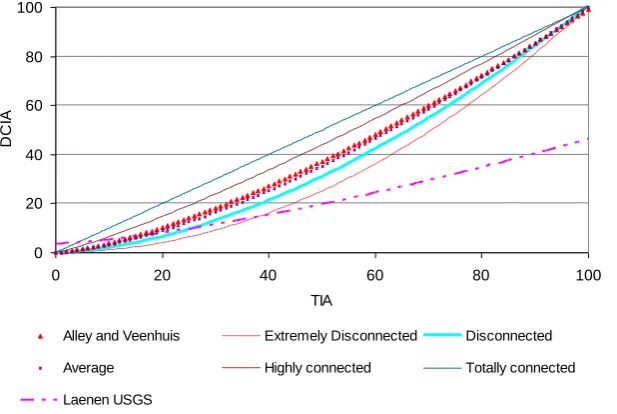
Figure 5 compares existing empirical equations to estimates of DCIA from TIAs. In all these equations, the DCIA is assumed as a fixed percentage of the TIA of catchment area. In addition, the level of connectivity of impervious surfaces is qualitative and independent of rainfall depth. Most of the equations show that if a drainage area comprises 100 percent imper vious area, 100 percent of these areas would be an Effective Impervious Area (EIA). The method by Laenen (1983) is the only exception as its application is limited to catchments with 10 to 50 percent TIA.
National land cover data allows the determination of the percent of impervious surfaces without specific reference categories (e.g., residential, commercial, etc.). Without knowledge of the land use category, a single empirical equation is required to convert TIA to DCIA. At the watershed scale, Figure 6 shows Willow Sink watershed DCIA based on NLCD.
Empirical methods using county data
County data accounts for different categories of land use at county and watershed levels. Structure and feature areas were added together to get the square footage of all impervious surfaces that potentially could flow directly into a conveyance storm water system as shown in Figure 7. Impervious surfaces are principally comprised of rooftops and conventional pavements. Impervious surfaces that are not directly connected to a conveyance system are not included in the calculation of DCIA.
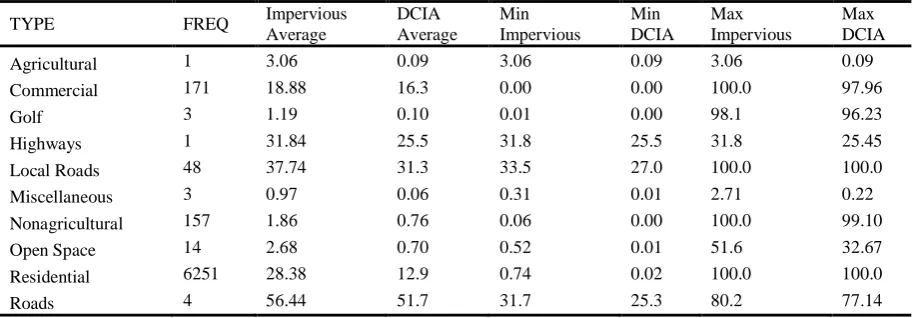
The FREQ in Table 2 is the number of parcels in the categories. There are a minimum and maximum of impervious percentages and DCIAs for each category. Maximum average DCIA was found in state and county roads and minimum DCIA was found in miscellaneous and golf lands. The maximum DCIA in the last column is the maximum for some parcels in the same category.
Variable DCIA
The new variable DCIA Equation (5) was tested for different TIA and rainfall. It suggests that in order to convert all TIA areas into DCIA there should be enough rainfall to hydraulically connect (via surface overland flow) impervious surfaces. Figure 7 shows the relation between DCIA and TIA for a 1-inch (2.54 cm) and 1.5-inch (3.81 cm) storm. The following equations were fitted of Equation 5 these storms and a 2-inch (5.08 cm) of rainfall.
4 . 1
12
.
0
TIA
DCIA
(6)3 . 1
25
.
0
TIA
DCIA
(7)2 . 1
4
.
0
TIA
DCIA
(8)The triangles are data points from Equation (2), the open circles are Typical Land Use Values from Table 1, and the solid line is Equation (7).
The only difference between existing empirical equations and the new variable DCIA approach is that is that the new approach allows DCIA to vary with rain depth. Using the variable DCIA approach, equations similar to the empirical equations in the literature can be generated. Indeed, Equation (5) is similar to Alley and Veenhuis (1983) and Sutherland (2000) for average basins. Equation (7) is identical to Sutherland (2000) for highly connected basins. This indicates that a 2-inch (5.08 cm) rainfall event connects NDCIA and converts the TIA from average to highly connected impervious area. Equation 6 matches the typical land use values in Table 1.
Case study
http: // www.gjesrm.com (C) Global Journal of Engineering Science and Research Management
69
the area under the hydrograph for each storm, and the percentage of DCIA was determined using Equation 8. Figure 8 shows DCIA versus rainfall depth in cm for the storms observed. Clearly, the DCIA increases nonlinearly with rainfall depth indicating a higher fraction of area producing runoff for larger rainfall events. Although the new proposed Equation 5 is shown to capture well t he variability of DCIA with rainfall depth, deviations between the model and observations can be attributed to several factors, including rainfall variability, non-uniformity, measurements errors, antecedent conditions, etc.
Discussion and Conclusion
An approach to estimate connected impervious areas based on rainfall depth has been developed. Previous methods included empirical equations, runoff-rainfall relationship, and satellite images such as the National Land Cover Data (NLCD). In this study, several methods have been applied on two watersheds located in west Florida. Using NLCD is more suitable for regional applications while county data is more suitable for watershed levels. The new approach produces an equation for each rainfall depth. An urban watershed can be divided into three significant catchment surfaces: impervious area directly connected (DCIA), impervious area that is not directly connected to the storm drain system (NDCIA), and pervious area (PA). An impervious area is considered to be directly connected (DCIA) if runoff from the area flows directly into the drainage conveyance system. Impervious areas are also considered directly connected if runoff from the area occurs as a concentrated shallow flow that is conveyed t hrough a pervious area. In the approach introduced, the connectivity of impervious areas is a variable that depends on storm rainfall depth and percent of imperviousness. Connectivity of impervious areas increases with rainfall depth, as saturated surfaces allow overland and concentrated flows to reach the storm water system.
At a theoretical level, the nature and extent of this method requires further investigation. The new method provides some real advantages. The results of this research can be used for better understanding of the effect of urbanization on storm water runoff. However, available data is not reflective of detailed observations and can lead to modeling and other errors. Detailed impervious surface area information is lacking for most cases, especially concerning how those areas are connected to the drainage system.
Pervious and impervious areas can connect to each other and contribute to runoff. For example, most of the storm water runoff from freeways is collected by the combined sewer system; whereas, swales collect the greater portion of the runoff in many suburban areas. If pavement runoff can be directed first to adjacent pervious areas, such as filter strips on the highway embankment, the pavement changes in classification from DCIA to NDCIA. However, non-porous roads and highways are the dominant sources of impervious runoff in urban areas and runoff from them is unavoidable. However, pervious areas can contribute to runoff. Fo r example, Dunne et al., 1975 suggested that storm runoff is produced on small portions of a catchment, which varies during and between storms. They found that subsurface storm flow occurs where rainwater saturates a zone of a permeable soil displacing the soil water to the stream at rates which make an important contribution to the storm hydrograph in the channel (see also Whipkey, 1965; Dunne and Black, 1970). In some cases, subsurface flow dominates the hydrograph volumetrically (e.g., hill slope with permeable soils) but may emerge from the ground surface over a limited zone of the catchment. Surface runoff may occur widely within a watershed, and sometimes in locations far removed from stream channels (Ward, 1984; Amerman, 1965). In natural areas of humid regions, effective surface runoff is often generated in saturated areas around drainage ways expand from these areas along hollows or areas where the water table is close to the surface (Chorley, 1978; Hewlett and Hibbert, 1967). When NDCIA occupies a significant portion of urban land it increases the saturation of the surrounding pervious areas, thereby producing most of the storm runoff in humid areas as water rises to the soil surface. Storm flow hydrographs are generated from small but consistent areas that constitute no more than 10% and usually 1-3% of the drainage basin (Freeze 1974). In other words, in humid regions a disproportionate percentage of the runoff is generated in small areas (often around drainage ways) and as the watersheds increase in size, the surface runoff and non-surface runoff producing areas tend to balance each other out. Studies in the Pacific Northwest have shown that native vegetation and undisturbed ground cover can absorb 100% of a 1” storm with no resulting surface runoff. Typical urban development usually results in the near total removal or compaction of native ground cover, producing the dramatic increases in surface runoff and modified hydrology in receiving streams. In nature only about 10 percent of all precipitation becomes runoff. However, in developed areas 55-100% of all precipitation wills runoff depending on the amount of impervious surface area. Experimental studies by Ragan (1967) showed that only small but “variable” proportion of the watershed contributed flow to the storm hydrograph. This portion can be either DCIA or behaves as DCIA but it is variable in area. Dunne and Black (1970) suggested that the major portion of storm runoff seems to be produced as overland flow on small-saturated areas close to streams. The remainder of the watershed acts as a reservoir during storms and between storms; it supplies base flow and maintains the wet areas that produce storm flow. Runoff from different NDCIA connects them together passing over pervious areas as sheet flow.
Acknowledgements
http: // www.gjesrm.com (C) Global Journal of Engineering Science and Research Management
70
References
1. Alley, W. M., and Veenhuis, J. E. (1983). Effective impervious area in urban runoff modeling. Journal of Hydraulic Engineering, 109(2), 313-319.
2. Amerman, C.R. (1965). The use of unit-source watershed data for runoff prediction, Water Resour. Res., 1, 499-507. 3. Burges, S. J., B. A. Stoker, M. S. Wigmosta, and R. A. Moeller (1989). Hydrological information and analyses required for
mitigating hydrologic effects of urbanization. University of Washington, Department of Civil Engineering, Water Resources Series Technical Report No. 117, p. 131.
4. Chorley, R.J. (1978). The hill slope hydrological cycle. In Hill slope hydrology. Edited by M.J. Kirkby. John Wiley and Sons, New York, N.Y. pp. 1–42.
5. Dayaratne, S. T. (2000). Modeling of Urban Storm water Drainage Systems Using ILSAX, Thesis, and Victoria University of Technology, Australia.
6. Dinicola, R. S. (1989). Characterization and simulation of rainfall-runoff relations for headwater basins in western King and Snohomish Counties, Washington state. U. S. Geological Survey Water-Resources Investigation Report 89-4052, p. 52.
7. Dufour, A., and D. Wright (2008). Evaluating Methods to Estimate Total and Directly-Connected Impervious Areas. In Urban Watersheds - AWRA’S 2008 Spring Specialty Conference “GIS and Water Resources V”, March 17 – 19, 2008 San Mateo, CA.
8. Dunne, T., and R. D. Black (1970) Partial area contributions to storm runoff in a small New England watershed: Water Resources Research, v. 6, p. 1296-1311.
9. Dunne, T., T.R. Moore and C. H. Taylor (1975). Recognition and Prediction of Runoff-Producing Zones in Humid Regions. Hydrol. Sci. 20(3):305-327.
10. Fankhauser, R. (1999). Automatic determination of imperviousness in urban areas from digital orthophotos. Water Sci. Technol. 39(9), 81-86.
11. Freeze, A.R. (1974). Stream flow Generation. Reviews of Geophysics and Space Physics 12(4):627-647.
12. Hewlett, J.D. and A. R. Hibbert (1967). Factors affecting the response of small watersheds to precipitation in humid areas, In: W.E. Sopper and H.W. Lull (eds), Forest Hydrology, Pergamon Press, 275-290.
13. Hill, K., E. Botsford, and D. B. Booth (2003). A Rapid Land Cover Classification Method for Use in Urban Watershed Analysis. University of Washington, Department of Civil and Environmental Engineering, Water Resources Series, Technical Reports No. 173.
14. Laenen, A. (1983). Storm runoff as related to urbanization based on data collected in Salem and Portland and generalized for the Willamette Valley, Oregon. USGS Water Resources Investigations Open File Report 83-4143.
15. Lee, J. G., and J. P. Heaney (2003). Estimation of urban imperviousness and its impacts on storm water systems. Journal of Water Resources Planning and Management-ASCE 129(5), 419-426.
16. Prysch, E. A., and J. C. Ebbert (1986). Quantity and quality of storm runoff from three urban catchments in Bellevue, Washington. U. S. Geological Survey Water-Resources Investigations Report 86-4000, p. 85.
17. Ragan, R.M. (1967). An experimental investigation of partial area contribution. In International Association of Scientific Hydrology Proceedings of the Berne Symposium. International Association of Scientific Hydrology Proceedings.
18. Schueler, T. (1995). The importance of imperviousness. Watershed Protection Techniques 1(3), 100-111.
19. Sutherland, R.C. (2000). Methods for Estimating the Effective Impervious Area of Urban Watersheds, Article 32 in: The Practice of Watershed Protection, pp. 193-195.
20. USDA. (1994). Planning and Design Manual for the Control of Erosion, Sediment, and Storm water, edited by Mississippi department of environmental quality, Etats-Unis Soil conservation service, 1994, First Edition.
21. Ward, R. C. (1984) On the response to precipitation of headwater streams in humid areas. Hydrol. 171-189.
22. Whipkey, R. Z. (1965) Measuring subsurface storm flow from simulated rainstorms—a plot technique. U.S. Dept. Agr., Forest Service, Cent States Forest Expt. Sta., U.S. Forest Serv. Res. Note CS-29, 6 pp.
http: // www.gjesrm.com (C) Global Journal of Engineering Science and Research Management
71
http: // www.gjesrm.com (C) Global Journal of Engineering Science and Research Management
72
http: // www.gjesrm.com (C) Global Journal of Engineering Science and Research Management
73
http: // www.gjesrm.com (C) Global Journal of Engineering Science and Research Management
74
http: // www.gjesrm.com (C) Global Journal of Engineering Science and Research Management
75
Figure 5. Change in DCIA with TIA using empirical equations 2 through 8.
0 20 40 60 80 100
0 20 40 60 80 100
TIA
D
C
IA
Alley and Veenhuis Extremely Disconnected Disconnected
Average Highly connected Totally connected
http: // www.gjesrm.com (C) Global Journal of Engineering Science and Research Management
76
http: // www.gjesrm.com (C) Global Journal of Engineering Science and Research Management
77
Figure 7. The Relationship between DCIA and TIA for 1-inch (2.54 cm) and 1.5-inch (3.81 cm) storm 0
20 40 60 80 100
0 20 40 60 80 100
TIA
D
C
IA
http: // www.gjesrm.com (C) Global Journal of Engineering Science and Research Management
78
Figure 8. Fit of Eq.(10) to rainfall-runoff data collected at USF campus
Table 1. Presumed Relationship between Imperviousness and Land Use (Dinicola, 1989)
Land Use TIA DCIA Percentage (TIA)
Low density residential 10 4
40.0
Medium density residential 20 10
50.0
Suburban density 35 24
68.6
High density residential 60 48
80.0
Commercial and industrial 90 86
95.6 0
0.1 0.2 0.3 0.4 0.5 0.6 0.7 0.8 0.9 1
0 1 2 3 4 5 6
D
C
IA
/T
IA
http: // www.gjesrm.com (C) Global Journal of Engineering Science and Research Management
79
Table 2. Impervious Areas in Various Land Uses using County Level Data for Willow Sink
TYPE FREQ Impervious
Average
DCIA Average
Min Impervious
Min DCIA
Max Impervious
Max DCIA
Agricultural 1 3.06 0.09 3.06 0.09 3.06 0.09
Commercial 171 18.88 16.3 0.00 0.00 100.0 97.96
Golf 3 1.19 0.10 0.01 0.00 98.1 96.23
Highways 1 31.84 25.5 31.8 25.5 31.8 25.45
Local Roads 48 37.74 31.3 33.5 27.0 100.0 100.0
Miscellaneous 3 0.97 0.06 0.31 0.01 2.71 0.22
Nonagricultural 157 1.86 0.76 0.06 0.00 100.0 99.10
Open Space 14 2.68 0.70 0.52 0.01 51.6 32.67
Residential 6251 28.38 12.9 0.74 0.02 100.0 100.0