ISSN 0000 ©2013 WEJ Journal
Predicting the effect of temperature on leaf
appearance in seven spring bread wheat genotypes
1 2 3 4
Department of Agronomy, Faculty of Agriculture, Cairo University, Giza, Egypt.
Corresponding author email: [email protected], [email protected].
ABSTRACT: Field experiments were conducted at the Faculty of Agriculture, Cairo University, Agriculture Experiment and Research Station, during two successive seasons starting with 2010/2011 in Giza, Egypt. The study aimed to determine the effect of temperature (by sowing dates) on leaf appearance and growth of seven spring bread wheat genotypes. Linear response was found
o o
d. Mean final leaf number on the main stem ranged from 8.5 to 11.5 and it was highly correlated with thermal time (r=0.99**). Genetic constitution of genotypes had larger effect on number of leaves per main-stem than temperature. These results suggests that, to model leaf appearance and canopy development in wheat, genotypic coefficients of phyllochron need to be determined in relation to growing environment temperature.
Keywords: Phyllochron; Leaf number; Thermal time; Triticum aestivum L.
INTRODUCTION
Growth and development of leaves are important determinants of economic yield of crops because dry matter accumulation depends on the number and area of leaves that intercept light (Ishag et al., 1998). Generally, growth and development occur simultaneously inclusive nor exclusive. Under specific conditions, development may occur without the growth and vise versa. Sometime development may be advance, while growth stopped due to environmental stress frequencies (Wilhelm and McMaster, 1995). An example of simultaneous development and growth is Haun stage. Because most Haun development stages are defined by the ratio of leaf length, if leaves do not grow, there is no change in lengths, so there are no measurements of development. Several terms have been used to detect rate of leaf appearance: plastochron, auxochron, and phyllochron. The first plastochron was defined by Askenasy (1880), then cited by Erickson and Michelini (1957), as the interval between formation of two successive internode cells in Nitella flexilis. Later, the term was expanded in definition to: the time interval between the initiation of successive primordial on shoot apex (Esau, 1965; Milthorpe, 1956). However, some investigators (Erickson and Michelini, 1957) have attempted to further expanded the definition to include any other stage of development as a reference point. Hancock and Barlow (1960) suggested the term auxochron as the interval between comparable stages on successive leaves on a stem. This term has been little use. Bunting and Drennen (1966) proposed the term phyllochron as the interval
Mohamed A . Abd El-Shafi and Ashraf A . Abd El-Mohsen
between rate of leaf appearance and thermal time. Phyllochron ranged between 108 C d and 122 C
between appearance of successive leaves on a clum or stem. The phyllochron interval ( C d leaf ) is a more-1 accurate measure of stem and tiller development (Klepper et al., 1982) than earlier systems of accessing development (e.g., Zadoks et al., 1974).
The phyllochron can be determined in many ways, such as documenting the time of appearance of successive leaves on a Culm or measuring the time it takes for an individual leaf to grow (Wilhelm and McMaster, 1995). The latter method assumes that the leaf grows within the time of one phyllochron, which may be the case in some species, but not in others. That is, in some species leaf n+1 may appear before leaf n has completed growth. In practice, the Haun scale (Haun, 1973) is often used to determine the phyllochron during vegetative development of grasses. However, the interval between the events may be measured either in time, thermal time or other meaningful measurements of time. Development and growth of grasses are characterized by the repeated formation of a basic unit, the phytomer. There is an intrinsic relationship between the concepts of phytomer unit and the phyllochron. So, development can be conceptualized by the addition of successive phyllochron units (Wilhelm and McMaster, 1995).
increase phyllochron. For the influence of salt Maas and Grieve, 1990 found increasing salt lead to increase phyllochron. Also there was no change in phyllochron by increasing CO (Boone and Wall, 1990 b).
The purpose of this paper is to present the role temperature (by sowing dates) and plant genetic in determining the phyllochron of seven spring bread wheat genotypes and to predict the impact of temperature on leaf appearance.
MATERIALS AND METHODS
Experimental practices
Experiments were conducted at the Faculty of Agriculture, Cairo University, Agriculture Experiment and Research Station, during two successive seasons starting with 2010/2011 in Giza Governorate (30.029°N 31.207°E)., Egypt. The soil texture was silt-loam (21% clay, 54% silt and 25% sand) with 3.2% organic matter and a pH of 7.84. Absorbable N, P and K were 1.12%, 0.08% and 0.20%, respectively.
Weather
Daily temperature (maximum and minimum) during the 2010/2011 and 2011/2012 growing seasons were obtained from the Central Laboratory for Agriculture Climate (CLAC), A.R.C. Egypt, and are shown in Fig. 1. Daily maximum temperature fluctuated more than minimum temperature. Maximum and minimum temperatures were usually high, but were cooler from mid-December till the end of January. Warm air temperatures persisted longer in 2011/2012 compared to season 2010/2011.
2
Figure 1. Daily temperature (maximum and minimum) during the 2010/2011 and 2011/2012 growing seasons.
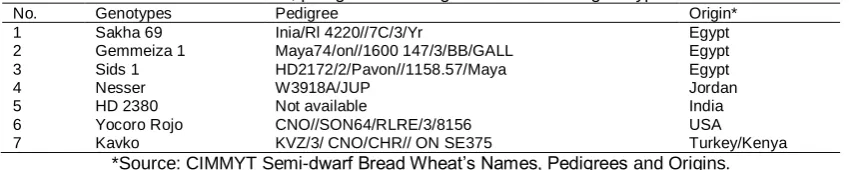
Seven bread wheat genotypes were chosen for study based on their reputed differences in yield performance and maturity. The pedigree and origin of the studied genotypes are listed in Table 1 Two sowing dates for the two growing seasons were as follows: 2010/2011: 21 November; and 20 December 2011/2012: 20 November; and 20 December. Each plot consisted of four rows, 3 m long and spaced 20 cm apart. The two central rows were used for yield measurements and observations. All genotypes were sown by a seed drill at a
- 1
replications.
Table1. Names, pedigrees and origins of the studied genotypes.
seed rate of 150 kg ha . The experiment was managed in randomized complete block design with four
No. Genotypes Pedigree Origin*
1 Sakha 69 Inia/Rl 4220//7C/3/Yr Egypt
2 Gemmeiza 1 Maya74/on//1600 147/3/BB/GALL Egypt
3 Sids 1 HD2172/2/Pavon//1158.57/Maya Egypt
4 Nesser W3918A/JUP Jordan
5 HD 2380 Not available India
6 Yocoro Rojo CNO//SON64/RLRE/3/8156 USA
7 Kavko KVZ/3/ CNO/CHR// ON SE375 Turkey/Kenya
*Source: CIMMYT Semi-dwarf Bread Wheat’s Names, Pedigrees and Origins.
Sampling procedures and measurements
Stages on Haun (1973) growth scale were established on five tagged plants in each replicate every 4 or 5 days; the number of emerged leaves on the main stems were recorded at the same time. Leaf appearance was calculated by plotting the number of emerged leaves against accumulated thermal time. Thermal time or growing degree days (GDD) was computed from the following equations:
t base
max min
T
T
.2
T
T
0.0 5.0 10.0 15.0 20.0 25.0 30.0 35.0 40.0 45.0
Nov Nov Dec Dec Jan Jan Jan Feb Feb Mar Mar
Max
Min 2011/2012 2010/2011
0.0 5.0 10.0 15.0 20.0 25.0 30.0 35.0 40.0
Nov Nov Dec Dec Jan Jan Jan Feb Feb Mar Mar
Te
m
pe
r
a
t
ur
e
(
oC
)
Max
Where T is the daily maximum air temperature, T is the daily minimum air temperature, and T is the temperature below which the process of interest does not progress.
Phyllochron interval (PI) was calculated as the reciprocal of the slope of the linear regression of Haun-scale growth units against accumulated thermal time (GDD) (Baker et al., 1986).
In order to phyllochron measurement during growth season each 3 days one time existing leaves numbers in three plants from main lines each plot was calculated when every leaf minimum 1 centimeter of length had. Meanwhile three selective plants were marked by color string and every leaf was marked by color pen after counting. Leaf appearance rate was calculated by the following equation:
Leaf appearance rate =
max min base
n
phyllochro
1
Finally, the data were statistically analyzed by MSTAT-C V.2.1 (Russel, 1994). The mean differences among the treatments were compared by least significant difference test at 5% level of significance (Steel et al., 1997).
RESULTS AND DISCUSSIONS
Phyllochron
o
growing seasons as affected by sowing dates and genotypes. Results revealed that phyllochron values were highly significant different between sowing dates and genotypes in both growing seasons.
o o
seasons. This response agrees with the finding of Cao and Moss, 1989. However, the values of Phyllochron interval (PI) during the two growing seasons for genotypes ranged from 108 to 121 with an average of 166. HD 2380 was the lowest value for PI in both seasons, while Kavko has the same value of PI in both seasons (121). Generally, Gemmeiza 1, Sids 1, HD 2380 and Kavko were lower in PI for first seasons comparing to second seasons. On the contrary, Sakha 69 and Nesser were higher in PI for first seasons comparing to second
o o
o o o
study, PI of the studied genotypes was 114 for first season and 117 for the second season with an average
o
the growing seasons. However, these results were in harmony with those obtained by Ishag et al., 1998
o
larger PI than those grown in low temperature. The significant differences of genotypes for PI and the average
o o
the genotypes had an effect may larger on PI than temperature.
o
2011/2012 seasons as affected by sowing dates and genotypes.
Data in Table 2 show mean phyllochron ( C d) from sowing to appearance of flag leaf during studied
Phyllochron values for the first date (121 C d) was higher than the second date (110 C d) in both
seasons. Previously reported phyllochron of wheat was 77 C d (Frank and Bauer, 1995), 80 C d (Bauer et al., 1984), 101 C d (Kirby, 1988), 105 C d (Biscoe and Willington, 1985) and 124 C d (Baker et al., 1986). In this
116 C d. All previous results were higher than reported may be due to high temperature that occurred during
(122 C) and Cao and Moss 1994 were they indicated that plants of winter wheat grown at high temperature had
air temperature during the period fluctuated considerably, from 6 C to 35 C indicated that genetic constitution of
Table 2. Mean phyllochron ( C d) from sowing to flag leaf for seven spring bread wheat genotypes during 2010/2011 and
Season
2010-2011 2011-2012 Mean
Sowing dates Novmber Decmber
108 112
6.18 4.87
Genotypes Sakha 69 Gemmeiza 1 Sids 1
Nesser 113 121
HD 2380 Yocoro Rojo
115 113
LSD at 5%
121 121
108 117
11.57 9.11
120 123
LSD at 5%
120 114
119 124
Kavko
104 112
121
110
3.13
117
117
122
114
108
121
112
5.86
Regression of number of leaves in the main culm vs. thermal time and the intercept, slope and correlation coefficient are given in Table 3. The correlation between appearance of leaves and thermal time was highly significant (r =0.99, p<0.01) and appearance rate of leaves was almost constant at 0.008-0.009
o
Table 3. Intercept (a), slope (b), and correlation coefficient (r) of regression lines for number of leaves on the main stem culm of wheat genotypes against thermal units as affected by sowing dates and seasons.
Sowing Intercept Slope Correlation
Dates (a) (b) Coefficient ( r )
November
2010/2011 1.293 0.008 0.99
2011/2012 1.418 0.008 0.99
December
2010/2011 - 0.504 0.009 0.99
2011/2012 - 0.245 0.009 0.99
Number of leaves
Number of leaves per culm was linearly related to the accumulated degree-days (r=0.99). Cao and Moss, 1989 and Mosaad, 1995 reported that the relationship between the number of leaves on main stem and accumulated degree-days is linear in cereals.
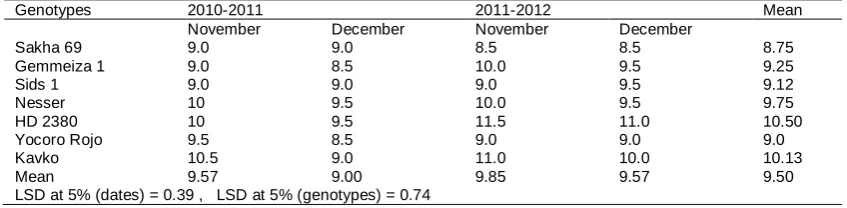
The mean number of leaves ranged from 8.5 to 11.5 (Table 4 and Fig. 2). Differences between season's dates and genotypes were significant and more leaves were produced in 2011/2012, also, December sowing had fewer leaves than the November sowing. Genotypes differed in total number of leaves at anthesis and leaf emergence rates. However, HD 2380 was the highest in final leaves with insignificant different with Kavko, this results agrees with obtained by Cao and Moss, 1991 and Mosaad 1995.
CONCLUSION
In total, on the basis of the results of the study, it can be concluded that linear response was found between rate of leaf appearance and thermal time. Also, genetic constitution of genotypes had larger effect on phyllochron and number of leaves per main-stem than temperature. So, more studies should hold to detect genetic control of phyllochron.
11
10
9
8
Sakha 69 Gemmiza 1 Sids 1 Nesser HD 2380 Yocoro Rojo Kavko
Fna
l
num
be
r
of l
e
a
f
2010-2011 November 2010-2011 December Mean
11
10
9
8
Sakha 69 Gemmiza 1 Sids 1 Nesser HD 2380 Yocoro Rojo Kavko
F
in
al n
u
m
b
er
o
f
leaves
2011-2012 November 2011-2012 December 2011-2012 Mean
Figure2. Effect of planting dates and seasons on final leaf number of wheat genotypes during 2010/2011 and 2011/2012 seasons.
LSD5% (year) = 1.21 LSD5% (dates) = 0.39 LSD5% (genotypes) = 0.74
11.5
11
10.5
10
9.5
9
8.5
8
Sakha 69 Gemmiza 1 Sids 1 Nesser HD 2380 Yocoro Rojo Kavko
F
in
al n
u
m
b
er
o
f
leaves
Table 4. Effect of sowing dates and seasons on final leaf number of wheat genotypes at anthesis during 2010/2011 and 2011/2012 seasons.
Genotypes 2010-2011 2011-2012 Mean
November December November December
Sakha 69 Gemmeiza 1 Sids 1 Nesser HD 2380 Yocoro Rojo Kavko Mean
LSD at 5% (dates) = 0.39 , LSD at 5% (genotypes) = 0.74
9.0 9.0 8.5 8.5 8.75
9.0 8.5 10.0 9.5 9.25
9.0 9.0 9.0 9.5 9.12
10 9.5 10.0 9.5 9.75
10 9.5 11.5 11.0 10.50
9.5 8.5 9.0 9.0 9.0
10.5 9.0 11.0 10.0 10.13
9.57 9.00 9.85 9.57 9.50
REFERENCES
Askenasy E.1880.Uber eine neue methods, um die vertheilung der wachsthumsintintensitat in wachsendentheilen zu bestimmen. Verhandlungen. Naturhistorisch-Medizinischer Verein zu Heidelberg. 2, 70-153.
Baker JT, Printer PJ, Reginato RJ, Kanemasu ET.1986. Effects of temperature on leaf appearance in spring and winter wheat cul tivars. Agron. J. 78: 605-613.
Bauer A, Frank AB, Black AL.1984. Estimation of leaf growth and anthesis from air temperature. Agro n. J. 76:829 - 835.
Biscoe PV, Willington VBA.1985. Crop physiological studies in relation to mathematical models. In: Day, W., Atkin, R.K. (Eds.), Wheat Growth and Modeling. Plenum Press, New York, pp. 257-269.
Boone MYL, Rickman RW, Whisler FD.1990 a. Leaf appearance rate of two winter wheat cultivars under high carbon dioxide conditions. Agron. J., 82:718-724.
Boone MYL, Wall GW.1990 b. CO enrichment and temperature effects on spring wheat. IV phyllochron intervals. P. 14 In Agronomy abstracts. ASA, Madison, WI.
Bunting AH, Drennen DSH.1966. Some aspects of the morphology and physiology of cereal in the vegetative phase. P. 20 - 38. In F.L. th
Nottingham, Nottingham, England. 1965. Butterworths, London.
Cao W, Moss DN.1989. Temperature effect on leaf emergence and phyllochron in wheat and barley. Crop Sci., 29:1018-1021. Cao W, Moss DN.1991. Pyllochron changes in winter wheat with planting date and environmental changes. Agron. J., 83:396-401. Cao W, Moss DN.1994. Sensitivity of winter wheat phyllochron to environment changes. Agron. J. 86:63 -66.
Erickson RO, Michelini FJ.1957. The plastochron index. Am. J. Bot., 44:297- 305. Esau K.1965. Pl ant anatomy. John Wiley & Sons, Inc., New York.
Frank AB, Bauer A.1982. Effect of temperature and fertilizer N on apex development in spring wheat. Agron. J., 74:504 - 509. Frank AB, Bauer A.1995. Phyllochron differences in wheat, barley and forage grasses. Crop Sci., 35:19-23.
Hancock CR, Barlow HWB.1960. Short-term fluctuations in leaf and internode growth in the apple root stock crab C. New Phytol., 59:227-237.
Haun JR.1973. Visual quantification of wheat development. Agron. J., 65:116-119.
Ishag HM, Mohamed BA, Ishag KHM.1998. Leaf development of spring wheat cultivars in an irrigated heat-stressed environment. Field Crops Res., 58:167-175.
Kirby EJM.1988. Analysis of leaf, stem and ear growth in wheat from terminal spikelet stage to anthesis. Fi eld Crop. Res., 18:127-140. Klepper B, Rickman RW, Peterson CM.1982. Quantitative characterization of vegetative development in small grain cereals. Agron. J.,
74:789-792.
Longnecker N, Kirby EJM, Robson A.1993. Leaf emergence, tiller growth, and apical development of nitrogen-deficient spring wheat. Crop Sci., 33:154-160.
Maas EV, Grieve CM.1990. Spike and leaf development in salt-stressed wheat. Crop Sci., 30, 1309-1313.
Masle J, Doussinault G, Farquhar GD, Sun B.1989. Foliar stage in wheat correlates better to photothermal time than to thermal time. Plant Cell Environ., 12: 235-247.
Milthorpe FL.1956. The relative importance of the different stages of leaf growth in determining the resultant area. P. 141 - 148. In F.L. rd
England.1956. Butterworths Scientific Publications, London.
Mosaad MG, Ferrara GO, Mahalakshmi V, Fischer RA.1995. Phyllochron Response to Vernalization and Photoperiod in Spring. Crop Sci., 35: 168-171.
Russell OF.1994. MSTAT-C v.2.1 (a computer based data analysis software). Crop and Soil Science Department, Michigan State University, USA.
Steel RGD, Torrie JH, Dickey DA.1997. Principles and procedures of statistics: A biometrical approach. McGraw Hill Book International Co., New York.
Wilhelm WW, McMaster GS.1995. Importance of the phyllochron in studying development and growth in grasses. Crop Sci., 35:1-3. Zadoks JC, Chang TT, Konzak CF.1974. A decimal code for the growth stages of cereals. Weed Res. 14:415-421
2
Milthorpe and J.D. Ivins (ed.) The growth of cereal and grasses. Proc. 12 Easter School in Agriculture Science. Univ. of