Structural Changes and Dielectric Relaxation Behavior of
Uniaxially Oriented High Density Polyethylene
Edin Suljovrujic, Maja Micic, Dejan Milicevic
Vinca Institute of Nuclear Sciences, University of Belgrade, Belgrade, SERBIA
Correspondence to:
Edin Suljovrujic email: [email protected]
ABSTRACT
The molecular relaxation behavior of an ice-quenched high density polyethylene (HDPE) subjected to solid-state stretching at elevated temperature (100 °C) to various draw ratios (up to λ=13.7) was examined by means of dielectric spectroscopy. All relaxation zones (, and , in order of decreasing temperature) between 25 K and melting temperature were studied in the frequency range from 1 kHz to 1 MHz. The changes observed in different dielectric relaxations were related to the orientation-induced modifications of the structural and morphological parameters. In order to investigate orientation-induced structural changes, optical microscopy (OM), scanning electron microscopy (SEM), wide angle X-ray scattering (WAXS), and differential scanning calorimetry (DSC) were employed. Herman's orientation function (fc) was
used to quantify the degree of crystal orientation. Complete disappearance of the already weak relaxation with orientation is attributed to the increase in crystallinity, but the contribution due to a more restricted chain segment mobility in the interlamellar regions of oriented specimens should also be taken into account. Presented results also reveal two different orientation-induced dynamics in the evolution of the dielectric and relaxations connected with the main transformation stages in the drawing of crystalline polymers. The transformation of the initial isotropic into a fully oriented fibrillar structure introduces large changes in the dielectric relaxation spectra of HDPE, especially in the relaxation zone; by contrast, with further increase in the draw ratio much smaller changes are observed due to the deformation of the fiber structure by longitudinal sliding motions of microfibrils and/or by fibrils slipping past each other.
INTRODUCTION
Orientation of an isotropic polymer, aligning the polymer macromolecules parallel to the direction of greatest anticipated stress, usually by drawing, rolling or extrusion, produces a material with a high degree of anisotropy in its physical properties due to molecular chain orientation [1-4]. For instance,
oriented structures are affected in large measure by the portion of the taut-tie molecules in the amorphous regions of microfibrils.
Polyethylenes have excellent mechanical and dielectric properties and therefore a wide variety of industrial applications, including electrical ones. Due to their low dielectric loss and good heat resistance, they have been widely used as electrical insulation [16,17]. Considering the molecular structure of apolar hydrocarbon polymers, such as polyethylene and polypropylene, the dipole moments of the (C-H apolar) groups contained in these polymers are very low, of the order of 0.1 debye, and hardly detectable by the usual dielectric techniques [17]. Despite this, apolar polymers exhibit measurable dielectric spectra corresponding to the transitions measured by the mechanical relaxation techniques. The measurable dielectric relaxations and losses are generally ascribed to impurities and to the fact that these polymers are always slightly oxidized and thus contain polar groups. Among impurities, residual catalysts and antioxidants have been reported to affect the dielectric properties. However, for the electrical application of such polymers it is of essential interest to understand their dielectric behavior. Furthermore, dielectric measurements can give valuable information about the structure and dynamics of materials. It is well known that the dielectric response can be used as an indicator of the condition and ageing processes occurring in polymer insulation [18,19].
In dielectric and mechanical relaxation studies, polyethylene (PE) displays three characteristic relaxation zones; these have conventionally been designated as , , and relaxations, in order of decreasing temperature. Although some detailed molecular assignments are still open to debate, the reality of the basic relaxation processes is clear; these have been well summarized by Boyd [20,21]. The and relaxations are commonly attributed to the relaxation mechanisms in the crystalline and amorphous phases [22-24], respectively; the relaxation, according to different authors, is due to the localized motions of either chain ends or branches associated with the amorphous phase [22,23,25], although originally it was also proposed to arise from the crystalline phase [26,27]. In order to better investigate the molecular relaxations, structural and morphological modifications were performed in the past by thermal treatment, irradiation, ageing, drawing, and doping the polymer matrix with polar molecules and particles as probes [28-32]. Even though the effects of orientation on the structure and properties of PE have received considerable attention
in the past, and several comprehensive reviews are available on this topic [1,2,8], the influence of orientation and the role of fibrillation on the molecular relaxations and dielectric behavior have not been resolved to an appreciable extent [20,33-40]. As far as we know, there is no published data concerning the influence of orientation at elevated temperatures on the molecular relaxation behavior of polyethylene. The aim of this work was to draw a complete dielectric relaxation map of virgin HDPE and HDPE uniaxially oriented via solid-state stretching at an elevated temperature to different draw ratios, and to establish a connection between the evolution of the dielectric relaxations and the orientation-induced changes in the structure. A variety of supplementary measurements were made to qualitatively determine the orientation-induced changes in the structure. The results obtained by optical microscopy (OM), scanning electron microscopy (SEM), wide angle X-ray scattering (WAXS), and differential scanning calorimetry (DSC) were compared with the orientation-induced changes in the dielectric relaxation spectra, with the changes in the intensity, position, and activation energy of dielectric relaxations.
EXPERIMENTAL Sample Preparation
The polymer used in the present study was HDPE Hiplex HHM 5502 (=0.955 g/cm3, M
w=300 000).
Isotropic sheets of different thickness were prepared by 20 min compression molding in a Carver laboratory press at 160 °C and a gradual increase in pressure up to 3.28 MPa. This was followed by quenching in an ice-water mixture. Uniaxial orientation was performed at elevated temperature (100 °C) on a Zwick tensile testing machine, at a slow cross head speed of 5 mm/min, to different draw ratios λ (up to λ = 13.7). The (macroscopic) orientation of the samples is characterized by the parameter λ=l/l0, where l is the final and l0 is the
initial length of the drawn sample. Larger draw ratios from λ = 13.7 could not be prepared because of tearing of the HDPE samples. After achieving the desired draw ratio, the stretched specimens were relaxed without unloading to ambient temperature. Then they were further kept under tension for 2 h at room temperature. The drawn and undrawn samples with the same final thickness (0.28 ± 0.02 mm) were used for further characterization.
Characterization
Optical and Scanning Electron Microscopy
photomicrographs were captured and analyzed by a high resolution microscopy camera (AxioCam, Carl Zeiss) and an image processing software (AxioVision, Carl Zeiss). For SEM analyses, the surface of the etched samples was covered by a thin layer of gold. All specimens for OM and SEM were etched; the etching procedure and recovery of the specimens were described in our previous paper [41].
Wide-Angle X-Ray Measurements
Wide-angle X-ray diffractograms of the samples were obtained using a Bruker D8 Advance Diffractometer (in normal mode, with Cu Kα emission). The parallel beam optics were adjusted with a parabolic Göbel mirror (push plug Ni/C) with a horizontal grazing incidence soller slit of 0.12° and a LiF monochromator. For all oriented samples, diffractometer scans were taken in the angular range of 2θ =10° - 45°, with a step size of 0.02°, and 10 s exposition per step for polar angles (φ) of 0° and 90° (φ = 0° corresponding to the drawing direction). The position of the diffraction maximum for each reflection of interest was determined from these curves, and the polar scans were then performed at these 2θ values, from -90° to +90°, at a scan speed of 10°/min and an increment of 1°. All scans were recorded by the symmetrical reflection/transmission techniques. To quantify the degree of molecular orientation, the crystalline orientation function (fc)
was used. Herman's method for calculating the crystalline orientation function, described for polyolefins in detail by Lafrance [42,43], was used in this study. Furthermore, crystallinity was evaluated from diffraction curves by resolving multiple peak data into individual crystalline peaks and an amorphous halo. Quantitative analysis was performed using standard software for fitting the experimental spectra.
Differential Scanning Calorimetry
For differential scanning calorimetry (DSC) measurements, a Perkin-Elmer DSC-7 with nitrogen as the purge gas was used. Samples of 7-8 mg, cut from the middle of the neck, were analyzed by heating from 320 to 450 K at a rate of 10 K/min, and their heats of fusion (Hf) and peak melting
temperature (Tm) were derived. The degree of
crystallinity was then calculated as:
=Hf/Hf0 (1)
where Hf0 is the heat of fusion of a perfectly
crystalline PE (Hf0 = 289 J/g [44,45]).
Dielectric Spectroscopy
The dielectric loss spectra of the samples in the form of discs 1.3 cm in diameter were measured on a Digital LCR Meter 4284A coupled with a 22C-kriodin(R) cryosystem, as a function of temperature (25-400 K) and in the frequency range 1 kHz to 1 MHz. A special chamber for dielectric measurements was constructed and used in order to protect the oriented samples from shrinking at elevated temperatures.
Dielectric measurements were taken at temperature increments of approximately 2 K during a heating run from 25 to 400 K, with a heating rate of 1.7 Kmin-1
between equilibrated temperatures. At each equilibrated temperature, measurements of capacitance and tan δ were taken at frequencies of 1, 2, 5, 10, 20, 50, 100, 200, 500 and 1000 kHz; data acquisition over the frequency range (10 frequencies) required about 5 min. at each equilibrated temperature.
RESULTS AND DISCUSSION Dielectric Relaxation Spectra
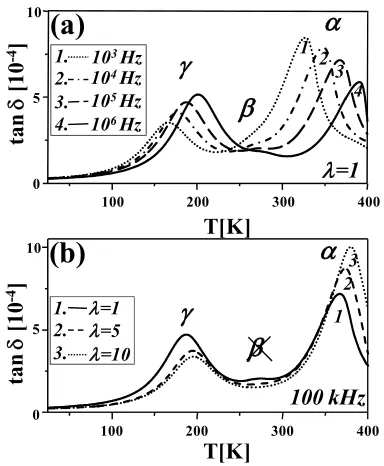
Dielectric loss spectra for virgin and oriented HDPE samples are shown in Figure 1. The α and γ relaxation transitions are seen as prominent loss peaks, while the third, less visible peak in dielectric spectra of virgin HDPE sample is assigned to the β transition.
ta
n
[1
0
-4]
ta
n
[1
0
-4]
10
=1100 200 300 400
(a)
0
5 4
103Hz
104Hz
105Hz
106Hz
2. 3. 4. 1.
3 2 1
T[K]
0 5 10
100 200 300 400
(b)
100 kHz
32 1 2.
3.
1. =1
=5
=10
T[K]
FIGURE 1. (a) Dielectric loss (tan ) versus temperature for virgin
HDPE, at several frequencies from 1kHz to 1MHz; (b) dielectric
loss (tan ) versus temperature for virgin and oriented HDPE
α relaxation
The α relaxation is universally observed in crystalline polymers and is usually attributed to the motion of chain units within the crystalline portion. It has been reported [46,47] that the incorporation of structural and chemical factors into the chains, such as chlorination, branching, or copolymerization with non-crystallizable units, decreases the intensity of this transition and in some cases, with high chlorine or co-unit concentration, the relaxation even disappears [48]. The mechanically active α process, although it requires the presence of the crystal phase, has its relaxation strength attributed to the amorphous component and involves softening or deformation of the latter [20]. The participation of the amorphous phase in the mechanical α relaxation is consistent with the broad distribution of characteristic times observed for this case, in contrast to a quasi-Debye behavior for the dielectric α relaxation [49]. There is strong evidence, from dielectric and NMR measurements, that the α process is dielectrically active due to the reorientation of carbonyl groups in the chains in the crystalline phase [22]. Boyd and Mansfield have proposed that the dielectric α process can be represented by the propagation process of a twisted defect along a chain within the crystal lattice, leading to reorganization of the crystal surface [21,50]. Although the relaxation times are longer mechanically than dielectrically and the mechanical process is much broader in relaxation times than the dielectric one, the activation energies are similar; the activation energy for the central relaxation time is 100-120 kJmol-1 [20]. Most authors claim a complex
nature for the mechanical α relaxation zone consisting of two or even three independent relaxation processes [51-54], but in general admit that the dielectric α relaxation zone is formed by a single relaxation [22,49,55,56]. Ribes-Greus and Diaz-Calleja [53] have observed that this relaxation zone is formed by two dielectric relaxations (α and α’ processes, in order of decreasing temperature) in both the high and low density PEs. According to them, the position of the dielectric α’ relaxation on the temperature axis does not depend on the average thickness of the crystallites and the participation percentage of carbonyl groups in this relaxation increase with the amorphous content; thus, the dielectric α’ relaxation may be associated with the molecular movements of the main chains in the amorphous phase [53]. On the other hand, the position of the α process seems to be governed by the mean thickness of the crystallites and this relaxation may be attributed to the molecular movements of the main chains, which form the crystalline phase. It has been demonstrated by Popli et al. [57], Mansfield and Boyd [50] and Nitta and Tanaka [58] that the
temperature of this transition increases with the crystallite thickness for a series of branched, linear and metallocene catalyzed PEs. This is true both dielectrically and mechanically and the observation holds for both bulk crystallized specimens and single crystal mats [21].
γ relaxation
The γ relaxation has its origins in the amorphous fraction, although it has been proposed that this relaxation takes place at least in part due to the motion of defects in the crystalline regions [23,59] or/and the motion of disordered chain segments at the surfaces of polymer crystals [60]. The discussion is widened because of the possible presence of many processes in this relaxation and due to their localization. Many studies indicate that the mechanical and/or dielectric γ relaxation zone contains two or even more sub-relaxations of different origins, relaxation times and activation energies [22,53,61-65]. According to Stehling et al. [25] and Alberola et al. [61,62], the γ relaxation is related to the glass transition, and for others, this relaxation can be regarded as a sub-glass transition attributed to the local motion of the central C–C bond of short chain segments (by crank-shaft [66] or flip-flop mechanism [67]) and/or the local motion of loose chain ends in the amorphous phase [68]. Khanna et al. pointed out that this relaxation involves the motion of a short segment (e.g. three to four CH2)
belonging to the amorphous phase, but also the chain ends within the crystalline or amorphous phases [69]. In general, it is presumed to involve more localized motions than the β process [68,70]. The reported activation energies for the relaxation are usually low (10-80 kJ mol-1) [22,66,68], but higher values
(up to 170 kJmol-1) have also been reported [61,62].
β relaxation
(VTF) temperature dependence, observed by some authors, indicates co-operative behavior related to the glass transition, too [29]. On the other hand, 13C
NMR measurements have shown that there is no direct correlation between the temperatures of glass transition and β relaxation [72,73]. Significant differences between the reported activation energies of 50-115 kJmol-1 [28,68] and 180-500 kJmol-1
[40,74] suggest that in the former case the relaxation in PE should be treated as a motion in interfacial regions, and in the latter as a highly cooperative process such as the glass transition. The β relaxation in branched PE is quite prominent [75], but in HDPE it is much less so (Figure 1a). There are three reasons for this. The first and main reason is connected with the amorphous nature of this relaxation - its magnitude decreases with increasing crystalline fraction. The second concerns the effect of the semi-crystalline environment. The presence of the crystal surfaces and the connections of the amorphous chains to them have an immobilizing effect on the β relaxation. Kinetically, the distribution of relaxation times is broadened in comparison with an unconstrained, completely amorphous polymer. It is also shifted to longer times isothermally or to higher temperatures isochronally. The strength of the relaxation, an equilibrium property, is also affected. The constrained chains are unable to relax completely; the relaxation strength is reduced. The third reason is connected with the time temperature behavior in comparison with the other relaxations. The β process is well resolved from the γ relaxation at moderate frequencies. However, this is not the case with the α process. The α process occurs at a higher temperature than the β process, but its activation energy is lower. This means that the α and β processes become better resolved in isochronal scans as frequency increases. Thus, there is a relatively limited window of frequency and temperature where the β process can be observed in HDPE [56]. However, objective values for the temperatures of the β process were obtained from dielectric spectra using curve fitting. The loss map for the β relaxation is a little bent, indicating some cooperative behavior (Figure 2a). Despite this, the β relaxation can be successfully fitted by the Arrhenius equation:
)
exp(
, max maxkT
E
f
f
a (2)
where fmax,∞ is a dimensional parameter, Ea is the
activation energy and k is Boltzmann′s constant. The correlation coefficient of linear regression is close to one (≥0.98) and the calculated apparent activation energy is Ea=280 kJ/mol. This value is much higher
than in the case of LDPE (Ea=185 kJ/mol) and
LLDPE (Ea=210 kJ/mol) investigated in our previous
studies [31,75,76]. It is apparent that the connections to the crystal surface have a substantial constraining effect on the dynamics in the β relaxation zone, as it is suggested by Graff et al. [56].
Microstructure
Detailed morphological studies, combining wide and small angle X-ray scattering (WAXS, SAXS), differential scanning calorimetry (DSC) and electron microscopy (EM), have shown conclusively that, during drawing, the initial spherulitic structure is transformed into a fibrillar structure and, in general, three main stages in the drawing of semicrystalline polymers are proposed. Peterlin [8], Keller [77] and Ward [1,2] contributed significantly to our understanding in this area. Deformation initially proceeds in an inhomogeneous fashion via the processes of interlamellar shear, intralamellar shear and interlamellar separation, depending on the local orientation of lamellae. At larger strains, microfibrils are formed from the destruction of individual lamellae by incorporating blocks of folded chains. Namely, the micronecks transform every single lamella into microfibrils, e.g. oriented stacks of crystalline lamellae, separated by the amorphous phase and with folded chains (c-axis) in the crystalline phase preferentially along the draw direction. The aligned microfibrils are integrated as bundles into fibrils, which are the main constituents of the polymer fiber. According to different authors, for polyolefins, the transformation of the initial isotropic into the fully oriented fibrillar structure is essentially completed by deformation ratios between 5 and 9 [1,78-80], after which the third stage deformation proceeds in a more continuous manner. The deformation of the new fiber structure can proceed by fibrils slipping past each other and/or by longitudinal sliding motions of microfibrils, a process limited by interfibrillar tie molecules. However, further deformation of the highly oriented structure can lead to bond breakage, microcrack formation, and failure.
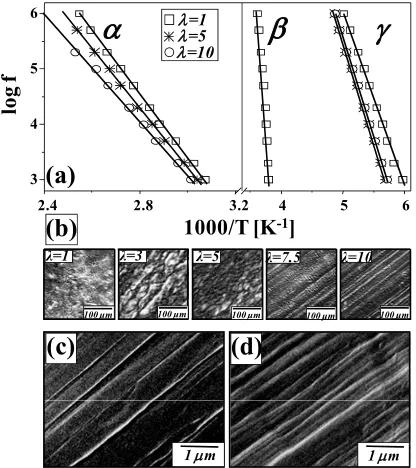
reveal fibrillar structure. Images of surface and cross-section of oriented (λ=7.5) HDPE sample are presented in Figure 2c and Figure 2d, respectively.
100 μm
λ=5
100 μm
λ=7.5
100 μm
λ=10
100 μm
λ=3
100 μm
λ=1
1 m 1 m
(d)
(c)
(b)
1000/T [K-1]3 4 5 6
2.4 2.8 3.2 4 5 6
(a)
lo
g f
=1=5 =10
FIGURE 2. (a) Loss map for the dielectric α, β, and γ processes.
Arrhenius fits are presented by full curves; (b) evolution of HDPE microstructure (OM images) with draw ratio; SEM images of
surface (c) and cross-section (d) of oriented (λ=7.5) HDPE sample.
Herman's Orientation Function and Crystallinity Following the pioneer work of Wilchinsky [81], WAXS has been used in numerous studies aimed at the evaluation of the crystal orientation in polymers. The characterization of the crystal orientation was performed through the determination of Herman's orientation function:
2
/
)
1
)
(cos
3
(
)
(cos
22
P
f
(3)Its limiting values, taking φ=0° as the deformation direction, are -0.5 for a perfect perpendicular orientation and +1.0 for a perfect parallel orientation [42]. An unoriented material gives <P2> = 0.
According to Lafrance at al. [43], the
c
P
2(cos
)
values describing the c axis or molecular orientation distribution can be computed from different planes for uniaxially oriented samples: the correlation between the coefficients thus calculated is excellent. To see the molecular chain orientation more clearly, the corresponding azimuthal scans of the (hkl) planes have been carried out; the selected azimuthal scans of the (110) reflection of highly oriented (λ=10) HDPE sample is shown as Insert in Figure 3a. From the integration of intensity over azimuthal angles, Herman’s orientation function(fc) was calculated by the hk0 average method, from
two intense (hk0) reflections (110 and 200), which are most often used in orientation studies of PE. The calculated results are shown in Figure 3a. Changes in the crystal orientation indicate that the preferred direction of the crystallite-chain axis does not coincide with the direction of elongation after the initial stretching, but is inclined towards it. As the elongation is increased, the crystallite orientation rapidly increases up to elongations of about 650% (draw ratios λ=7.5) when the chain axes practically coincide with the starching direction (fc >0.95); the fc
coefficient gets close to its limiting value, indicating completion of the transformation from the lamellar to the fibrillar structure [82]. Therefore, the WAXS results reinforce the morphological evidence from OM and SEM.
0 5 10 15
Draw ratio (λ)
In te n sity (a .u .)
10 20 30 40
2θ(degree)
(110)
(200)
λ=1
λ=10
(a)
Draw ratio (λ)
4 8 12
0.6 0.8 1.0
(110)
Polar angle, -90 φ0(degree) 90
λ=10 In te n si ty ( a.u .)
(b)
360 400 T[K] endo(c)
H/ T [J g -1s -1]5 Jg-1s-1
λ=1 λ=5 λ=10 Herm an o ri en t. fu n ct ., fc DSC WAXS
(d)
C ry st allin it y [% ] 50 60 70 80 400 405 4100 5 10 15
Draw ratio (λ)
(e)
m
[T]
α
[T]
m[T]
404 408 412
370 380
FIGURE 3. (a) Crystalline orientation function (fc) versus draw
ratio. Shown by the Insert is the WAXS azimuthal scan of the
(110) reflection for oriented (λ=10) HDPE sample; WAXS
diffractograms (b) and melting endotherms (c) of virgin and oriented HDPE samples; (d) crystallinity as a function of draw ratio calculated from WAXS and DSC data; (e) relationship
between the temperature of the dielectric α relaxation (Tα) at 100
kHz and melting temperature (Tm), observed for HDPE samples
with different draw ratios.
associated with the elevated drawing temperatures that enabled short time relaxations [83] and lamellae thickening during fibrillation [83-85]. Also, the number of defects in the crystal structure decreases with drawing at elevated temperatures. The flow of the amorphous phase due to the orientation process makes possible the crystallization on the already existing lamellae, too. In Figure 3d and Figure 3e it can be observed that the increase in the degree of crystallinity and melting temperature is largest for small draw ratios (λ≤7.5). Due to this it can be concluded that the transformation of the initial HDPE structure into the fully developed fibrillar structure gives the largest contribution to the mentioned changes. With further elongation and increase in the draw ratios (λ>7.5), the changes in the degree of crystallinity and melting temperature are relatively small.
Orientation-Induced Evolution of the Relaxations By comparing dielectric loss scans for virgin and oriented samples (Figure 1b), it can be concluded that orientation significantly changes the β relaxation zone of HDPE. Complete disappearance of the already weak dielectric β relaxation is clearly evident with orientation. Such orientation-induced behavior of this relaxation in HDPE is also observed by dynamic-mechanical measurements [40]. This can be expected taking into account the fact that this relaxation is entirely connected with the interlamellar content. Restricted chain mobility in interlamellar regions as a consequence of orientation, together with much lower interlamellar content in oriented samples, leads to the disappearance of the relaxation with drawing at elevated temperature.
Contrary to the weak dielectric relaxation and its complete disappearance with orientation, the α and γ relaxations are clearly evident (Figure 1). The decrease in the magnitude of the γ relaxation is connected with lower interlamellar content in oriented samples. On the other hand, the increase in the magnitude of the dielectric α relaxation can be connected with the fact that this process in polyethylene originates directly in the crystals. Since the carbonyl dipole direction is normal to the chain direction in the planar zig-zag, a relaxation originating in the crystal should be intense in the direction normal to the c axes and of zero strength parallel to this direction [20]. In general, both the intensity and the location of the α loss peak were found to be sensitive to the crystallinity and the crystal morphology; good correlation between the mean crystal thickness and the α loss peak location was postulated by others and our data, too, confirm such behavior. One way of calculating the mean thickness of the crystallite is from calorimetric
measurements, because the mean thickness governs in turn the position of the fusion peaks [53]. Thus we have related the position of the dielectric α peak on the temperature axis (Tα) to the melting temperature
(Tm) of oriented samples. Linear dependence can be
observed between the temperature of the dielectric α peak (at 100 kHz) and the melting temperature (Insert in Figure 3e).
Besides the changes in the relaxation intensity, orientation also induces changes in the distribution of relaxation times, peak position and activation energy. The different origin/nature of the dielectric α and γ relaxations leads to different evolutions with orientation, but the complex nature can be confirmed for both relaxations by the presence of a shoulder (asymmetry) at lower temperatures (Figure 1). These results are in agreement with some other results found in the literature [53,55,63,86] and confirm that these dielectric relaxation zones are probably formed by at least two overlapped sub-relaxations. According to Ribes-Greus and Diaz-Calleja [53], the dielectric γ relaxation zone in PEs is composed of two relaxations (γI and γII, in order of decreasing
temperature). The shoulder at lower temperatures (γII
relaxation) is more evident in LDPE. On the other hand, the activation energy of the dielectric γI
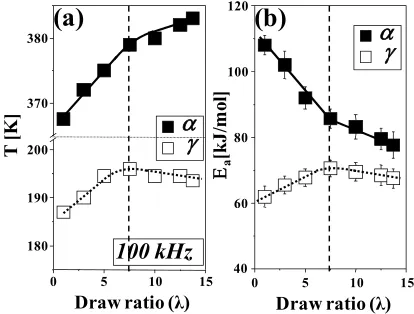
As in the case of the γ relaxation, the α relaxation was found to have similar asymmetry at lower temperatures (Figure 1) which implies existence of dielectric α’ relaxation process [53]. This asymmetry becomes less prominent with orientation (Figure 1b). Since the dielectric α’ relaxation is associated with molecular movements of the main chains in the amorphous phase, this can probably be connected with the orientation-induced decrease in the amorphous content. However, the separation from the α relaxation looks almost impossible and hereinafter the focus will be on the main relaxation. The variations in the position and activation energy of the main α relaxation with draw ratio are shown in Figure 4.
(b)
a
[k
J/
m
ol
]
0 5 10 15
Draw ratio (λ)
40
60 80 100 120
(a)
T [K]
180 190 200 370 380
0 5 10 15
Draw ratio (λ)
100 kHz
FIGURE 4. (a) Temperature of the dielectric α and γ relaxation
loss maxima versus draw ratio measured at a frequency of 100
kHz; (b) activation energy (Ea) for the α and γ processes versus
draw ratio.
The position of the α relaxation is significantly shifted to higher temperatures at lower draw ratios (λ≤7.5) and a good correlation between the mean crystal thickness and the α loss peak location is observed (Insert in Figure 3e). Thus, this shift, together with the large initial decrease in activation energy, can probably be attributed to the significant changes in the crystalline phase (e.g. increase in crystalline content, size and perfection of crystallites) at lower draw ratios (λ≤7.5) induced by the lamellar to fibrillar transformation at elevated temperature (100 °C). According to Stadler et al. [87], the decrease in the activation energy of this process can be explained by the increase in perfection of the crystal lamellae. Additionally, the decrease in the apparent activation energy with orientation can also be connected with a lower cooperative character of this relaxation process in the anisotropic material [49]. This behavior suggests a decrease of complexity (number of conformational arrangements) of the activated state of the motions associated with the α
relaxation in oriented HDPE [49]. The activation energy is a measure of the potential barrier hindering the molecular motion. Chains (c-axis) in the crystalline phase become more parallel to the orientation direction, thus facilitating rotations of the carbonyl dipole around the c-axis with orientation, since the carbonyl dipole direction is normal to the chain direction in the planar zig-zag structure. For higher draw ratios (λ>7.5) only small changes in temperature and activation energy for this relaxation are evident (Figure 4). However, for both (α and γ) relaxations the changes observed in the dielectric spectra can be well connected with the orientation-induced changes in the HDPE structure, but the dielectric α relaxation shows a much larger sensitivity to these changes.
Besides others, the application of PE oriented materials includes electrical/electronic applications such as cable sheathing and insulation nets. Furthermore, high thermal conductivity observed for highly crystallized and highly oriented polymers combined with good electrical insulation capability could make polyethylene fibrous materials useful for dissipating heat in many applications such as conduction-cooled high temperature superconducting (HTS) coils, high temperature superconducting solar hot water collectors, heat exchangers and electronics [88,89]. Therefore, the knowledge of the evolution of the structure and especially dielectric properties with fibrillation of this material is essential for such applications. All presented data indicate that the transformation of the initial isotropic into the fully oriented fibrillar structure in the case of the good isolating material such as HDPE can be followed by means of dielectric relaxation spectroscopy. Despite the fact that orientation introduces significant modification of the structure of HDPE, desirable dielectric properties remain well preserved.
CONCLUSION
The dielectric relaxation behavior of HDPE, oriented via solid-state stretching at an elevated temperature, was investigated. Different techniques were used to determine the orientation-induced changes in structure and properties. The orientation-induced changes in the microstructure and an overall morphological picture of the main transformation stages in drawing of crystalline polymers were obtained by OM and SEM microscopies. Changes in the crystal orientation (through Herman’s orientation function) and in crystalline phase are observed by WAXS. At elongations of about 650% (draw ratios λ=7.5), the chain axes practically coincide with the starching direction (fc >0.95); the fc coefficient
of the transformation from the lamellar to the fibrillar structure. Therefore, the WAXS results reinforce the morphological evidence from OM and SEM. Besides the WAXS, changes in crystallinity and, additionally, in the melting temperature are investigated by DSC. The largest increase in the degree of crystallinity and melting temperature is observed for small draw ratios (λ≤7.5), e.g. for the lamellar to fibrillar transformation. For higher draw ratios (λ>7.5) the changes in the degree of crystallinity and melting temperature are relatively small; plastic deformation of the fiber structure introduces only minor changes in these values.
Presented results also reveal that orientation at elevated temperature introduces significant changes in the dielectric , and relaxation behavior of HDPE, too. Complete disappearance of the already weak relaxation with orientation is attributed to the increase in crystallinity, but the contribution due to the orientation-induced chain segment mobility in the interlamellar regions should also be taken into account. Furthermore, the changes observed in the dielectric α and γ relaxations can be well connected with the orientation-induced changes in structure. The orientation-induced transformation of the initial HDPE structure into the developed fibrillar structure gives a large contribution to the changes in the magnitude, temperature, and activation energy of the dielectric α and γ relaxations. On the other hand, with further increase in the draw ratio (λ>7.5) the deformation of the new fiber structure, which can proceed only by fibrils slipping past each other and/or by longitudinal sliding motions of microfibrils, introduces much smaller changes in these values. It is observed that the orientation at elevated temperature more significantly affects the dielectric α relaxation zone. The dielectric α relaxation shows larger sensitivity to orientation at elevated temperature due to its origin/nature and as a consequence of large orientation-induced changes in the crystalline phase.
All presented data indicate that the transformation of the initial isotropic into the fully oriented fibrillar structure in the case of a good isolating material such as HDPE can be followed by means of dielectric relaxation spectroscopy. Despite the fact that orientation introduces significant modification in the HDPE structure, desirable dielectric properties remain well preserved.
ACKNOWLEDGEMENTS
This work has been supported by the Ministry of Education and Science of the Republic of Serbia (grant No. 172026).
REFERENCES
[1] Ward, I.M., Developments in oriented polymers. Vol 1, Applied Science Publishers, London, 1982.
[2] Ward, I.M., Developments in Oriented Polymers. Vol 2, Applied Science, London, 1987.
[3] Ajji, A., Dumoulin, M.M.; Very high modulus high-density polyethylene and high-modulus polypropylene obtained by solid-state roll drawing; Journal of Applied Polymer Science 2006, 102, 3391-3399.
[4] Ward, I.M., Hadley, D.W., An Introduction to the Mechanical Properties of Solid Polymers, John Wiley& Sons, Chichester, UK, 1993. [5] Amornsakchai, T., Songtipya, P.; On the
influence of molecular weight and crystallisation condition on the development of defect in highly drawn polyethylene; Polymer 2002, 43, 4231-4236.
[6] Jiang, Z., Tang, Y., Rieger, J., et al.; Structural evolution of tensile deformed high-density polyethylene at elevated temperatures: Scanning synchrotron small- and wide-angle X-ray scattering studies; Polymer 2009, 50, 4101-4111.
[7] Addiego, F., Dahoun, A., G'Sell, C., et al.; Characterization of volume strain at large deformation under uniaxial tension in high-density polyethylene; Polymer 2006, 47, 4387-4399.
[8] Peterlin, A.; Molecular model of drawing polyethylene and polypropylene; Journal of Materials Science 1971, 6, 490-508.
[9] De Candia, F., Romano, G., Baranov, A.O., et al.; Dynamic-mechanical behavior of highly drawn isotactic polypropylene; Journal of Applied Polymer Science 1992, 46, 1799-1806.
[10] Strauch, V., Schara, M.; E.p.r. study of the orientation of polymer segments induced by cold drawing of a low density polyethylene; Polymer 1995, 36, 3435-3438.
[12] Zhu, P.-W., Tung, J., Phillips, A., et al.; Morphological Development of Oriented Isotactic Polypropylene in the Presence of a Nucleating Agent; Macromolecules 2006, 39, 1821-1831.
[13] Hu, X., Alcock, B., Loos, J.; The influence of drawing temperature on mechanical properties and organization of melt spun polyethylene solid-state drawn in the pseudo-affine regime; Polymer 2006, 47, 2156-2162. [14] Penning, J.P., Van der Werff, H., Roukema, M.,
et al.; On the theoretical strength of gelspun/hotdrawn ultra-high molecular weight polyethylene fibres; Polymer Bulletin (Berlin) 1990, 23, 347-352.
[15] Egorov, E.A., Tshmel, A.E., Zhizhenkov, V.V.; Structure of the tie chains in oriented polyethylene: dependence of all-trans stem lengths on draw ratio; Polymer 1998, 39, 497-499.
[16] Fukuda, T.; Technological progress in high - voltage XLPE power cables in Japan - Part I; IEEE Electrical Insulation Magazine 1988 4, 9-16.
[17] Hedvig, P., Dielectric Spectroscopy of Polymers, Academia Kiado, Budapest, 1977. [18] Fouracre, R.A., MacGregor, S.J., Judd, M., et
al.; Condition monitoring of irradiated polymeric cables; Radiation Physics and Chemistry 1999, 54, 209-211.
[19] Given, M.J., Fouracre, R.A., MacGregor, S.J., et al.; Diagnostic dielectric spectroscopy methods applied to water-treed cable IEEE Transactions on Dielectrics and Electrical Insulation 2001, 8, 917-920.
[20] Boyd, R.H.; Relaxation processes in crystalline polymers: experimental behavior - a review; Polymer 1985, 26, 323-347.
[21] Boyd, R.H.; Relaxation processes in crystalline polymers: molecular interpretation - a review; Polymer 1985, 26, 1123-1133.
[22] Ashcraft, C.R., Boyd, R.H.; A dielectric study of molecular relaxation in oxidized and chlorinated polyethylenes; Journal of Polymer Science: Polymer Physics Edition 1976, 14, 2153-2193.
[23] Hoffman, J.D., Williams, G., Passaglia, E.; Analysis of the α, β and γ relaxations in polychlorotrifluoroethylene and polyethylene: Dielectric and mechanical properties; Journal of Polymer Science, Part C 1966, 11, 173-235.
[24] Alberola, N., Cavaille, J.Y., Perez, J.; Mechanical spectrometry of alpha relaxations of high-density polyethylene; Journal of Polymer Science, Part B: Polymer Physics 1990, 28, 569-586.
[25] Stehling, F.C., Mandelkern, L.; The glass temperature of linear polyethylene; Macromolecules 1970, 3, 242-252.
[26] Suljovrujic, E., Kostoski, D., Kacarević-Popovic, Z., et al.; Effect of gamma irradiation on the dielectric relaxation of uniaxially oriented low density polyethylene; Polymer International 1999, 48, 1193-1196. [27] Zhou, H., Wilkes, G.L.; Orientation anisotropy
of the mechanical α relaxation of high-density polyethylene films having a well-defined stacked lamellar morphology; Macromolecules 1997, 30, 2412-2421.
[28] Boiko, Y.M., Kovriga, V.V.; Relaxation behavior of polyethylene oriented by various techniques; International Journal of Polymeric Materials 1993, 22, 209-217.
[29] Frubing, P., Blischke, D., Gerhard-Multhaupt, R., et al.; Complete relaxation map of polyethylene: filler-induced chemical modifications as dielectric probes; Journal of Physics D: Applied Physics 2001, 34, 3051-3057.
[30] Suljovrujic, E., Kacarević-Popovic, Z., Kostoski, D., et al.; Effect of ageing on the dielectric relaxation of oriented and gamma irradiated LDPE; Polymer Degradation and Stability 2001, 71, 367-373.
[31] Suljovrujic, E.; Some aspects of structural electrophysics of irradiated oriented LLDPE; Nuclear Instruments & Methods in Physics Research, Section B: Beam Interactions with Materials and Atoms 2005, 236, 399-406. [32] Kolesov, I.S., Androsch, R., Radusch, H.-J.;
Effect of crystal morphology and crystallinity on the mechanical α-and β-relaxation processes of short-chain branched polyethylene; Macromolecules 2005, 38, 445-453.
[33] Kramer, S., Nowak, H., Springer, H., et al.; Dielectric relaxation of polar aromatics in unoriented and oriented linear low-density polyethylene; Journal of Applied Polymer Science 2001, 79, 1278-1282.
[34] Boiko, Y.M., Sherman, M.Y.; Dynamic mechanical behavior of oriented films of high-density polyethylene; Polymer Science, Series A 1998, 40, 143-149.
[35] Danch, A., Osoba, W., Stelzer, F.; On the α relaxation of the constrained amorphous phase in poly(ethylene); European Polymer Journal 2003, 39, 2051-2058
[37] Alon, Y., Marom, G.; On the β transition in high density polyethylene: The effect of transcrystallinity; Macromolecular Rapid Communications 2004, 25, 1387-1391.
[38] Davies, G.R., Ward, I.M.; The anisotropy of dielectric relaxation in oxidized low density polyethylene; Polym. Lett. 1969, 7, 353-360. [39] Vaisman, L., González, M.F., Marom, G.;
Transcrystallinity in brominated UHMWPE fiber reinforced HDPE composites: morphology and dielectric properties; Polymer 2003, 44, 1229-1235.
[40] Matthews, R.G., Unwin, A.P., Ward, I.M., et al.; Comparison of the dynamic mechanical relaxation behavior of linear low- and high-density polyethylenes; Journal of Macromolecular Science, Part B: Physics 1999, 38, 123-143.
[41] Milicevic, D., Trifunovic, S., Popovic, M., et al.; The influence of orientation on the radiation-induced crosslinking/oxidative behavior of different PEs; Nuclear Instruments & Methods in Physics Research, Section B: Beam Interactions with Materials and Atoms 2007, 260, 603-612.
[42] Lafrance, C.P., Pezolet, M., Prud'homme, R.E.; Study of the distribution of molecular orientation in highly oriented polyethylene by x-ray diffraction; Macromolecules 1991, 24, 4948-4956.
[43] Lafrance, C.P., Prud'homme, R.E., Brisson, J.; On the calculation of Pn(cosχ) coefficients from X-ray diffraction measurements made on hkl reflections; Polymer 1996, 37, 1509-1512.
[44] Atkinson, C.M.L., Richardson, M.J.; Thermodynamic Properties of Ideally Crystalline Polyethylene; Trans. Faraday Soc. 1969, 65, 1764-1773.
[45] Osugi, J., Hara, K.; High-pressure melting in polyethylene The review of physical chemistry of Japan 1966, 36, 28-34
[46] Nielsen, L.E.; Transitions in ethylene polymers; Journal of Polymer Science 1960, 42, 357-366.
[47] Popli, R., Mandelkern, L.; The transition in ethylene copolymers: The β-transition; Polymer Bulletin (Berlin) 1983, 9, 260-267. [48] Pereña, J.M., Fatou, J.G., Guzmán, J.; Dynamic
mechanical behaviour of chlorinated polyethylene; Makromolekulare Chemie 1980, 181, 1349-1356.
[49] Mano, J.F.; Cooperative in the crystalline α-relaxation of polyethylene; Macromolecules 2001, 34, 8825-8828.
[50] Mansfield, M., Boyd, R.H.; Molecular motions, the relaxation, and chain transport in polyethylene crystals; Journal of Polymer Science: Polymer Physics Edition 1978, 16, 1227-1252.
[51] Simanke, A.G., Galland, G.B., Freitas, L.L., et al.; Dynamic-mechanical properties of ethylene/α-olefin copolymers prepared by a metallocene catalyst; Macromolecular Chemistry and Physics 2001, 202, 172-179. [52] Nakayasu, H., Markovitz, H., Plazek, D.J.; The
frequency and temperature dependence of the dynamic mechanical properties of a high density polyethylene; Journal of Rheology 1961, 5, 261-283.
[53] Ribes-Greus, A., Diaz-Calleja, R.; Dielectric relaxations of high and low density irradiated polyethylene; Journal of Applied Polymer Science 1989, 38, 1127-1143.
[54] Ohta, Y., Yasuda, H.; Influence of short branches on the α, beta and γ-relaxation processes of ultra-high strength polyethylene fibers; Journal of Polymer Science, Part B: Polymer Physics 1994, 32, 2241-2249.
[55] Kakizaki, M., Hideshima, T.; Multiple relaxation in a- and g-loss bands of polyethylene Journal of Macromolecular Science, Part B: Physics 1973, 8, 367 - 387. [56] Graff, M.S., R.H., B.; A dielectric study of
molecular relaxation in linear polyethylene; Polymer 1994, 35, 1797-1801.
[57] Popli, R., Glotin, M., Mandelkern, L., et al.; Dynamic mechanical studies of α and b relaxations of polyethylenes; Journal of Polymer Science: Polymer Physics Edition 1984, 22, 407-448.
[58] Nitta, K.-H., Tanaka, A.; Dynamic mechanical properties of metallocene catalyzed linear polyethylenes; Polymer 2001, 42, 1219-1226. [59] Sinnott, K.M.; Mechanical Relaxations in
Single Crystals of Polyethylene; Journal of Applied Physics 1966, 37, 3385-3400.
[60] Fischer, E.W., Peterlin, A.; Kernresonanzmessungen zur untersuchung der kettenbeweglichkeit in polyäthylen-einkristallen; Makromolekulare Chemie 1964, 74, 1-28.
[62] Alberola, N., Cavaille, J.Y., Perez, J.; Mechanical γ and β relaxations in polyethylene-I. Glass transitions of polyethylene; European Polymer Journal 1992, 28, 935-948.
[63] Laredo, E., Suarez, N., Bello, A., et al.; α, β and γ relaxations of functionalized HD polyethylenes: a TSDC and a mechanical study; Polymer 1999, 40, 6405-6416.
[64] Sáenz de Juano-Arbona , V., Ribes-Greus, A., Diaz-Calleja, R., et al.; Dynamic mechanical relaxations in annealed and irradiated polyethylenes; Journal of Non-Crystalline Solids 1994, 172-7, 1072-1077.
[65] Sáenz de Juano-Arbona, V.S., Vallés-Lluch, A., Contat-Rodrigo, L., et al.; Chemical and thermal characterization of high- and low-density irradiated polyethylenes; Journal of Applied Polymer Science 2002, 86, 1953-1958.
[66] Perepechko, I.I., An Introduction to Polymer Physics, Mir Publishers Moscow, 1981.
[67] Boyd, R.H., Breitling, S.M.; The conformational analysis of crankshaft motions in polyethylene Macromolecules 1974, 7, 855-862.
[68] Matsuo, M., Bin, Y., Xu, C., et al.; Relaxation mechanism in several kinds of polyethylene estimated by dynamic mechanical measurements, positron annihilation, X-ray and 13C solid-state NMR; Polymer 2003, 44, 4325-4340.
[69] Khanna, Y.P., Turi, E.A., Taylor, T.J., et al.; Dynamic mechanical relaxations in polyethylene Macromolecules 1985, 18, 1302-1309.
[70] Corrales, T., Villavieja, M.M., Peinado, C., et al.; β- and γ-relaxations of low density polyethylene: Study by fluorescent probes; Journal of Photochemistry and Photobiology, A: Chemistry 2006, 182, 52-59.
[71] Yamamoto, K., Kato, K., Sugino, Y., et al.; ESR study on segmental motion of polyethylene in amorphous region, dependent on crystallinity, molecular weight, and labeled site; Macromolecules 2005, 38, 4737-4743.
[72] Dechter, J.J., Axelson, D.E., Dekmezian, A., et al.; An analysis of the b transition of linear and branched polyethylenes by carbon-13 NMR; Journal of Polymer Science: Polymer Physics Edition 1982, 20, 641-650.
[73] Axelson, D.E., Mandelkern, L.; An upper limit to the glass temperature of linear polyethylene as determined by high-field carbon-13 Fourier transform nuclear magnetic resonance; Journal of Polymer Science: Polymer Physics Edition 1978, 16, 1135-1138.
[74] Pegoretti, A., Ashkar, M., Migliaresi, C., et al.; Relaxation processes in polyethylene fibre-reinforced polyethylene composites; Composites Science and Technology 2000, 60, 1181-1189.
[75] Suljovrujic, E.; Dielectric studies of molecular β-relaxation in low density polyethylene: the influence of drawing and ionizing radiation; Polymer 2002, 43, 5969-5978.
[76] Suljovrujic, E.; Some aspects of structural electrophysics of irradiated polyethylenes; Polymer 2005, 46, 6353-6359.
[77] Hay, I.L., Keller, A.; A study on orientation effects in polyethylene in the light of crystalline texture; Journal of Materials Science 1967, 2 538-558.
[78] Amornsakchai, T., Olley, R.H., Bassett, D.C., et al.; On the influence of initial morphology on the internal structure of highly drawn polyethylene; Polymer 2000, 41, 8291-8298. [79] Furuta, M., Kojima, K.; Morphological study of
deformation process for linear polyethylene; Journal of Macromolecular Science, Part B: Physics 1986, 25, 349-364.
[80] Suljovrujic, E.; The influence of molecular orientation on the crosslinking/oxidative behaviour of iPP exposed to gamma radiation; European Polymer Journal 2009, 45, 2068-2078.
[81] Wilchinsky, Z.W.; Determination of orientation of the crystalline and amorphous phases in polyethylene by X-ray diffraction; Journal of Polymer Science, Part A-2: Polymer Physics 1968, 6, 281-288.
[82] Milicevic, D., Micic, M., Stamboliev, G., et al.; Microstructure and crystallinity of polyolefins oriented via solid-state stretching at an elevated temperature; Fibers and Polymers 2012, 13, 466-470.
[84] Lagarón, J.M., López-Quintana, S., Rodriguez-Cabello, J.C., et al.; Comparative study of the crystalline morphology present in isotropic and uniaxially stretched “conventional” and metallocene polyethylenes; Polymer 2000, 41, 2999-3010.
[85] Bershtein, V.A., Egorov, V.M., Differential Scanning Calorimetry of Polymers. in: Kemp, T.J., (Ed.), Physics, chemistry, analysis, technology, Ellis Horwood, New York, 1994, pp. 1–253.
[86] Pechhold, W., Stoll, B.; Theory of dielectric relaxation in PE; Physical Chemistry Chemical Physics 1970, 74, 887-896.
[87] Stadler, F.J., Kaschta, J., Münstedt, H.; Dynamic-mechanical behavior of polyethylenes and ethene-/α-olefin- copolymers. Part I. α′-relaxation; Polymer 2005, 46, 10311-10320.
[88] Shen, S., Henry, A., Tong, J., et al.; Polyethylene nanofibres with very high thermal conductivities; Nature Nanotechnology 2010, 5, 251-255.
[89] Yamanaka, A., Takao, T.; Thermal Conductivity of High-Strength Polyethylene Fiber and Applications for Cryogenic Use ISRN Materials Science 2011, 2011, Article ID 71876.
AUTHORS’ ADDRESS Edin Suljovrujic Maja Micic Dejan Milicevic
Vinca Institute of Nuclear Sciences University of Belgrade