ORIGINAL PAPER
Evolving base for the fuel consumption optimization in Indian air
transport: application of structural equation modeling
Vedant Singh&Somesh K. Sharma
Received: 12 February 2013 / Accepted: 20 January 2014 / Published online: 20 February 2014
#The Author(s) 2014. This article is published with open access at Springerlink.com
Abstract
Introduction The article aims to evolve the base for fuel consumption optimization (FCO) in Indian air transport in-dustry. The objective of this paper is to design the methodol-ogy and to develop five facet model of fuel consumption optimization (FCO). Limited researches have been conducted to explore influencing factors for FCO in air transport indus-try. To fill this gap, this study proposes the model of FCO, and investigates key factors affecting FCO.
MethodologyThe research steps included exploratory factor analysis, confirmatory factor analysis, and testing of structural model. In the first stage exploratory factor analysis (EFA) was used to provide the grouping of variables underline the com-plete set of item based upon the strong correlation. In the second stage, a confirmatory factor analysis (CFA) was used to specify and estimate of one or more hypothetical models of factor structure, each of which propose a set of latent variables to account for covariance within a set of observed variables. In the third stage, we used the Structural Equation Modeling (SEM) technique and empirically tested the relationships be-tween fuel consumption optimization and aircraft operations (AO), aircraft technology & design (ATD), social-economic & political (SEP), aviation infrastructural (AI), and alternate fuels & fuel properties (AFP).
Results The results and applications of structural equation modeling (SEM) evolve variety of findings. (1) Aircraft oper-ations (AO), aircraft technology & design (ATD), socio-eco-nomic & political issues (SEP), aviation infrastructure (AI),
and alternative fuels & fuel properties (AFP) are proved to be the five key influence factors with respect to the Indian con-text and have positive effect on FCO. (2) Among the five influence factors for FCO, aircraft technology & design ex-hibits the strongest effect on FCO, followed by aircraft oper-ation, alternative fuels & fuel properties, socio-economic & political, and aviation infrastructure. (3) The highest squared correlation was observed between aircraft technology & de-sign and aircraft operations.
Conclusions and future work This study has provided empir-ical justification for the proposed research framework which describes the relationships between FCO and its dimensions. This has developed an integrated model of FCO, with the purposes of identifying the key factors affecting the FCO. The knowledge of relationship among variables can lead to frame objective function, constraints, and set of equations pertaining situations with regard to Indian scenario. To con-stitute the equations the data of identified critical factors with regard to Indian scenario can be utilized which will lead to develop optimization based model for fuel consumption that leaves the scope for further study. This study produces the results which represent the base for optimum solution of fuel consumption on which future researchers can target.
Keywords Air transport industry . Aviation turbine fuel (ATF) . Fuel consumption optimization (FCO) . Structural equation modeling (SEM)
1 Introduction
Air transport industry is catalyst for economic development and trade in an increasingly globalised world where people and goods are moving father, faster and cheaper than ever. Today the growth of the Indian air transport industry is in-creasing at rapid rate due to the various economical and V. Singh (*)
Department of Mechanical Engineering, Vaishno College of Engineering, Kangra 176403, HP, India
e-mail: [email protected]
S. K. Sharma
technological reasons. Due to the adaption of the open sky policy in 1990 and several other liberalization policies by the Indian government causes the rapid changes and rapid trans-formation in the airline industry. The Indian civil aviation too is presently witnessing a boom with a host of private airlines taking to the skies. Beside this growth the Indian airline industry also facing some of the major challenges like high aviation turbine fuel prices, overcapacity, huge debt, poor infrastructure, employees’shortage, reserve routes and intense competition [1, 2]. After the liberalization in Indian civil aviation industry increased airlines choice, reduced fares, and increased routes were the major advantages. But the most restricted industry faced the some serious problem after liber-alization and these were infrastructure bottleneck, traffic jam, taxation policy, and productivity [3].
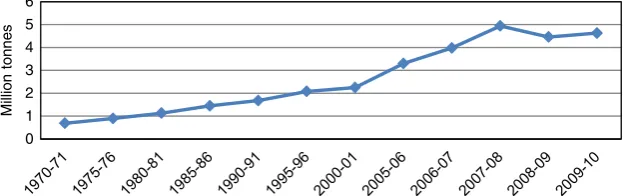
Indian civil aviation has experienced a greater growth rate since middle of the past decade and the domestic traffic tripled from approximately 15 to 45 million passengers in the period between 2004 and 2010. Global aircrafts fuel consumption is expected to rise by 3 % to 3.5 % and reach between 461Mt and 541Mt in 2036. Domestic and international operations ac-counts for 38 % and 62 % of global fuel consumption respec-tively. Due to higher rate of growth in air transportation network in India resulted in increased fuel consumption of ATF and it went up by about 40 % from 3.3 Mt to 4.6 Mt between 2005 and 2010 [4]. Figure 1 shows trends in fuel consumption of aviation turbine fuel (ATF). It shows contin-uously increased fuel consumption from 1970 to 2010 and 3.86 % growth rate of 2009–10 over 2008–09 [5].
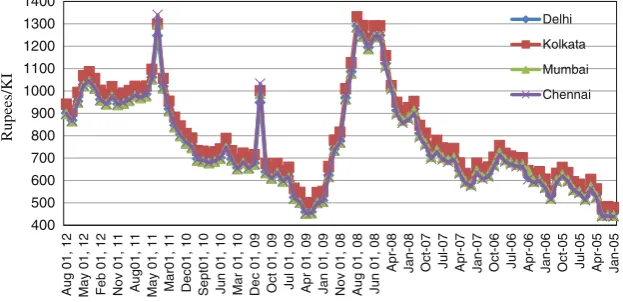
Escalating fuel prices is the challenge for the Indian airline. ATF rise has direct impact on the airline industry in India. Economy of a country largely depends on fuel prices. In-creases in fuel prices affect the airlines in two ways; direct impact on the operating cost, and declines the demand for air travel and air cargo. Figure2shows the ATF Prices at 4 metros including sales tax for domestic airlines and Fig.3shows the ATF Prices at 4 metros excluding sales tax for international airlines are as under [Sales Tax is not applicable to interna-tional airlines] [7] . Figure4shows comparison of ATF rates (Rupees/KI) from 2004 to 2007. It showed that the ATF rates of Indian airline are higher than the Bangkok, Singapore, Kuala Lumpur, and Sharjah airlines [9].
Aviation turbine fuel (ATF) is one of major direct operating cost parameter in the air transport industry [10,11]. Airbus [12] predicted that in 2003, fuel represented about 28 % of total operating cost for a typical A320 family operator. By 2006 fuel prices had more than doubled, meaning that fuel now represented about 43 % of all operating costs. According to Majka et al. [13] at one time fuel extraction cost and availability had little impact on the evolution of aviation industry but today fuel conservation is one of most critical concern to aviation industry [13–15]. Economy of a country largely depends on fuel prices. Increases in fuel consumption affect the airlines in two ways; direct impact on the cost of operation, and decline in demand for air travel and air cargo. Today most of the airlines are struggling to keep their financial viability and facing operational difficulties. Therefore in such a highly competitive environment in order to reduce the direct operating cost of an aircraft, the optimization of fuel consump-tion is essential. Optimizaconsump-tion of fuel consumpconsump-tion in aviaconsump-tion industry will further help in economic and social develop-ment, reduce the fuel consumption, conserve the aviation fuel, enhance the efficiency of aviation operations, and reduce the cost of air travel. Many research studies are going on for the optimization of fuel consumption in aviation industry but these study deals with separate aspects like optimized design, optimized operations, alternative fuels, and aviation infra-structure etc. several model have been proposed and some study suggests the fuel saving & conservation measures. While the researchers have made the significant effort on new technology & product design, optimized operations, and alternate fuels etc. for the optimization of fuel consump-tion in aviaconsump-tion industry, certain important issues remain un-explored. But a collectively effort is still needed to blend all these aspects in a customized manner [14,15].
Therefore this article aims to bridge this research gap and therefore evolves a base which could be utilized for optimiz-ing fuel consumption exercise. This study aims to evolve the set of variables for FCO and explore relationships among them with respect to FCO. Summarily, this study attempt to identify, evaluate and governs the relationships among the decision variables that affect fuel consumption with regard to Indian air transport. It will act as a base to the development of model for FCO.
0 1 2 3 4 5 6
Million tonnes
The content of this paper is organized as follow: First an integrated model of FCO is constructed to explore what influ-ence factors affect FCO and how that influinflu-ence is exerted which is discussed in Section 2. Section 3 discusses the construct measures and sampling techniques adopted in this study. Section4 discusses the results and findings of EFA, CFA, and structural equation model. Finally, the conclusions, limitations and future research directions are provided in Section5.
2 Proposed model and theoretical background
2.1 Proposed model of fuel consumption optimization (FCO) in air transport
In the highly competitive environment in order to reduce the direct operating cost of an aircraft, the optimization of fuel consumption is essential. Optimization of fuel consumption in aviation industry will further help in economic and social development, reduce the fuel consumption, conserve the avi-ation fuel, enhance the efficiency of aviavi-ation operavi-ations, and reduce the cost of air travel. Progresses in literature related to fuel consumption have been started since after 1973–74 Arab oil embargoes. After 1970s oil crises fuel conservation and
efficiency became the main focus of the aviation industry. And in light of the aforementioned issues pertaining to the fuel consumption in commercial aviation where we observe con-trasting trends, it means best possible use of fuel, complying with availability and environmental concerns and at the same time sustaining the growth of the sector.
Literature suggests that fuel consumption belongs to the individual areas of the airline industry. Studies [6,16–37], indentifies the: Aircraft technology & design, aircraft opera-tions, alternate fuels & fuel properties, social-economic & political, aviation infrastructural as the potential areas effecting the fuel consumption in the aviation industry.
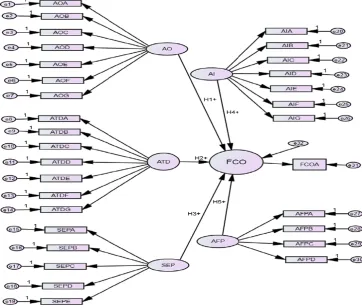
To illuminate the interrelationship between the identified factors and FCO, a theoretical model of FCO is proposed (Fig.5). As shown it is a structural equation model with six constructs. Aircraft technology & design, aircraft operations, alternate fuels & fuel properties, social-economic & political, aviation infrastructural are posited as predictor variables, while FCO is assigned as dependent variable. In the current study, the proposed model is based on the assumption that the five predictor variables are all positively correlated with FCO. Briefly there are five path hypotheses(H1,H2,H3,H4,H5) among the five influencing factors and FCO, and each path represents a casual relationship with the direction of effect identified as either positive (+) or negative (−). Because the six
20000 30000 40000 50000 60000 70000 80000 90000 Aug 16, 2012 Ju n16 , 20 12 Apr 1 6 , 2 012 M a r 01 , 20 12 Ja n01 , 20 12 Nov 01, 201 1 S e pt 1 6 , 2 0 11 Ju l 1 6 , 20 11 M a y 1 6 , 2 011 M a r16, 201 1 Ja n16 , 20 11 Nov 16, 2010 Sep t16, 2010 Ju ly 16, 201 0 M a y 1 6 , 2 010 M a r16, 201 0 Ja n16 , 20 10 Nov16, 2009 S e pt 1 6 , 2 0 09 Ju ly 16, 200 9 M a y 1 6 , 2 009 M a r 16 , 20 09 Ja n16 , 20 09 Nov 16, 200 8 S e pt 0 1 , 2 0 08 Ju n01 , 20 08 Feb -08 Oc t-07 Ju n-07 Feb -07 Oct-0 6 Ju n-06 Feb -06 Oc t-05 Ju n-05 Feb -05 Rupees/KI Delhi Kolkata Mumbai Chennai Fig. 2 ATF prices at 4 metros
including sales tax for domestic airlines, source: Indian Oil [6]
400 500 600 700 800 900 1000 1100 1200 1300 1400 Aug 01, 12 Ma y 01 , 12 Feb 01, 12 Nov 01, 11 Aug 0 1, 1 1 Ma y 01 , 11 M a r01, 11 Dec 01, 10 Sep t01, 10 Ju n 0 1 , 10 M a r 01 , 10 Dec 01, 09 Oct 0 1 , 0 9 Ju l 0 1 , 09 Apr 0 1 , 0 9 Ja n 0 1 , 09 Nov 01, 08 Aug 01, 08 Ju n 0 1 , 08 Apr-0 8 Ja n-08 Oct-0 7 Ju l-07 Apr-0 7 Ja n-07 Oct-0 6 Ju l-06 Apr-0 6 Ja n-06 Oct-0 5 Ju l-05 Apr-0 5 Ja n-05 Rupees/KI Delhi Kolkata Mumbai Chennai
constructs in the proposed model of FCO are latent variables, impossible to observe directly, 31st observed variable is de-signed as survey instruments instead.
2.2 Theoretical background of constructs and hypotheses
2.2.1 Aircraft operational area
Aircraft consumes large amount of fuel during its takeoff, climb, cruise, descent, and landing phases of flights. The amount of fuel consumed by an aircraft during its operation from one airport to another depends upon several factors and parameters. Most of the factors are directly controlled by airlines with proper operations planning and strategies. Good flight planning, correct aircraft loading, proper maintenance, flight procedures, and fuel tankring etc. have significant impact on aircraft fuel
consumption during its operations. Operational improvements increase the performance of any of the aircraft. Airline efficiency can be increased by managing the aircraft operations properly. Through proper flight planning aircraft fuel consumption can be reduced. Weight, speed, and wind resistance are the major parameters which effect the fuel consumption to a greater extent during the operations of aircraft. Reducing the weight will reduce the fuel consumption because for lighter the engine will work less. There are several methods which reduces the weight of the aircraft. This includes the using one engine while taxing, using ground tugs for aircraft movement on ground, using ground electric power instead of onboard power, removing non essential items, and proper fuel tankering etc.
David A. Pilati [20] explained the energy use and conserva-tion alternative for airplanes. Study evaluated the fuel saving for various energy conservation strategies and he discussed 10000
15000 20000 25000 30000 35000 40000
Bangkok Singapore Kuala Lumpur Sharjah India
Rupees/KI
April, 04 March , 05 March, 06 March, 07
Fig. 4 Comparative ATF rates Rupees/KI (2004–2007), source: FIA [8]
Fig. 5 Proposed model of FCO; Notes:AOAfuel tankring,AOB
fuel weight,AOCstage length,
AODpayload weight,AOE
aircraft altitude,AOFaircraft speed,AOGaircraft extra weight,
ATDAengine types,ATDB
lift/drag,ATDCengine by pass ratio,ATDDdesign range,ATDE
engine thrust,ATDFnew aircraft,
ATDGstructural weight,SEPA
fuel price,SEPBticket price,
SEPCaircraft scheduling,SEPD
government regulations,SEPE
charges & taxes,AIArunway,AIB
weather conditions,AICflight profile,AIDterminal area,AIE
block hours,AIFtaxiway,AIG
fuel procurement,AFPAboiling point,AFPBalternate fuel type,
how to implement these fuel saving strategies. John W. Drake [29] suggested the slower cruise speed, flight profile optimiza-tion, and reduced fuel tanking for fuel consumption reduction. D. N. Dewees and L. Waverman, [21] highlighted the energy conservation policies for the transport sector and they evaluated the conservation policies for railroads, trucking, bus, and in-cluding airlines. D. Wayne Darnell and Carolyn Loflin [38], Barry Nash [39], John S. Stroup and Richard D. Wollmer [40], Zouein, Abillama and Tohme [41], Khaled Abdelghany [42] developed the fuel management models and all these models resulted in fuel saving. R. R. Covey [43] explained the opera-tional energy conservation strategies in commercial aviation, he explained the twelve fuel conservation strategies and these strategies were resulted in fuel saving. Henry S. L. Fan [44] discussed the fuel conservation during the ground operations. He discussed the fuel saving during single engine taxiing, and towing the aircraft between terminal area and runways. Raffi Babikian [34], Filippone [45], Joosung Lee [31] explored the operational parameters which effect the aircraft fuel consump-tion. These studies suggest that aircraft operations have the significant impact on the fuel consumption optimization. On the basis of this the first hypothesis is proposed:
H1 (AO)-There is a positive relationship between aircraft operations and FCO
2.2.2 Aircraft technology & design
Today technology development is going on at a rapid rate and we can effectively make use of this technological revolution to reduce the fuel consumption of a commercial aircraft. Improve-ment in aircraft fuel efficiency depends upon the design of the engine and airframe products. Aircraft design has long been recognized as one of the most difficult and challenging prob-lems in aviation industry. This study tries to review the aircraft design & technology parameters which effect the fuel con-sumption. David L. Greene [22] examined the technological potential to improve commercial aircraft energy efficiency and suggested that the fuel consumption reduction is possible by reducing the drag and weight of aircraft. Greene pointed out some major improvement in the fields of engine efficiencies, aerodynamic, and structural changes of aircraft. Lee [30] and Raffi Babikian [34] studied the technological influence on the energy usage on the basis of engine efficiencies, structural technology, and aerodynamic efficiencies.
Evolutionary developments of engine and airframe technol-ogy have resulted in a positive trend of fuel efficiency improve-ments. Design features are generally related to the products and aircraft configuration. The merging technology and design feature finally leads to the fuel consumption optimization. New material technology has also high impact on fuel con-sumption. The reduction of aircraft weight can be achieved by
the introduction of new material technology and advance struc-tural design. For an aircraft a lot of energy is wasted in over-coming the resistance offered by the ambient air during the flight. This resistance is termed as drag. An efficient design can reduce the amount of drag and thus reduce the fuel consump-tion of the aircraft. To deal with the improvement of external design of the aircraft to reduce the drag, a field of science called aerodynamics comes in picture. Aerodynamics is extensively used in the design of an aircraft. An aircraft can be designed for high speed or low speed. A high speed aircraft comes with a high fuel usage and a low speed aircraft with low fuel usage. For slow speed aircrafts larger wing area is required to produce the necessary lift which in turn increases the frontal cross sectional area leading to an increase in drag. Therefore an optimum balance is required in such situation to increase the fuel efficiency. To achieve this optimum balance, design of the aircraft should have good aerodynamics. Propulsion technolo-gy used in the aircraft is also one of the major factors deciding the efficiency of the aircraft. More efficient turbofan engines can reduce the fuel usage. A lot of research is going on to improve the design of the turbofan engines used in aircrafts for the efficient utilization of the fuel. An aircraft designer faces many tradeoffs for example, there is tradeoff between fuel and time, tradeoff between cruise performance and takeoff and landing performance [8, 46]. Pant and Fielding [47] studied the aircraft configuration and flight profile optimization using simulated annealing and resulted fuel saving. Similar Antoine & Kroo [48], Ryan P. Henderson [49], Alonso et al. [8] and Vankan et al. [36] studied the aircraft design optimization and resulted in fuel consumption reduction. These studies develop a technology & design framework for fuel consumption optimi-zation. Thus, we hypothesize that:
H2 (ATD)-There is a positive relationship between aircraft technology & design and FCO
2.2.3 Socio-economic, & political
smaller, older aircraft which may burn less fuel, proba-bilistic tanning planning also saves the fuel. Also the rise in fuel prices and taxes reduces the fuel consump-tion. The social, political, and economic factors needs to be expressed convincingly which will provide the input for optimal fuel consumption in airline industry.
John W. Drake [29] studied the fuel saving measures and constraints in airline fuel optimization of airline operation, training, maintenance and reservation policies, scheduling, planning and routes, airways and labour. He also explained, how the Government approved collusion among the compet-itor for route swapping and labour flexibility. All these mea-sure were for the reduction of fuel consumption. All these measure were for reducing fuel consumption. Mazraati and Alyousif [50] explained the effect of jet fuel prices, airline ticket prices on the fuel consumption and travel demand. Joosung J. Lee [31] suggested the social pressure and public awareness for fuel burn and emission reduction. Austin & Hogan [51] optimized the procurement of aviation fuel for defense industry. D. N. Dewees and L. Waverman [21] studied the recent government policies and fuel taxes for the fuel conservation of airline and transport sector. Based on the above analysis, the third hypothesis can be enunciated as follow:
H3 (SEP)-There is a positive relationship between socio-economic & political issues and FCO
2.2.4 Aviation infrastructural area
Aviation infrastructure also plays an important role in fuel consumption optimization. Infrastructure improvements pres-ent a major opportunity for fuel consumption reduction in aviation. Airport congestion and improper air traffic man-agement increases the fuel consumption. Airport conges-tion occurs whenever the actual traffic demand is greater than what the system can handle without the delay. Better airport design and route redesign can also reduce the fuel consumption. A new form of Air Traffic Management is being introduced, with the aim of redesigning routes around the performance of the flight, managing the opti-mized use of airspace. Scientists and aviation experts worldwide are investigating improved air traffic manage-ment, route redesign, better airport design, and fuel acqui-sition to reduce the fuel consumption.
David A. Van Cleave [52] suggested the reduction in the level-offs of terminal airspace and using cross runways in the airports for reducing the fuel burn. Anderson R. Correia [53] suggested that the airport’s design, influences the air-craft fuel consumption in maneuvering on the airport between the runways and terminals. Kazda & Caves [54] suggested that the optimum design of taxiways
reduces the fuel consumption of aircrafts. All these studies explore the several parameters effecting the aviation fuel consumption. Senzig et al. [55] modeled the terminal area fuel consumption and resulted in fuel consumption reduction. Based on the above another hypothesis is put forward as follows:
H4 (AI)-There is a positive relationship between aviation infrastructural area and FCO
2.2.5 Alternate fuels & fuel properties
Aviation alternative fuels can also play an important for the optimization of aviation fuel consumption. Since the energy crises of 1970s, all the aircraft companies, aviation sectors, engine companies, and other government organization are working for practicality of using alternative fuel in aircraft. A viable alternative aviation fuel can stabilize fuel price fluctuation and reduce the reliance from the crude oil. Due to the high growth rate of aviation sector, supply security of fuel, and environmental impact of fuel has caused the aviation industry to investigate the potential use of alternative fuels. But now due to increase of oil prices and fuel consumption the research in this field has been became important. Jet fuel is going to deplete sooner or later, therefore we are looking for alternative fuels. Today numbers of flying aircrafts and fuel con-sumption has been doubled and it is difficult to maintain the future crude oil demand. Therefore it is essential that alternatives to crude oil be developed to reduce the fuel consumption and fuel prices. There are numbers of alter-native fuel options for aviation such as synthetic liquid fuels, bio-jet fuel, ethanol, fuel and hydrogen. The most likely alternatives for aviations are those which are having similar properties like conventional fuel. Jet fuel should be very energy dense because the aircraft has limited volume and weight capacities. The fuel having less energy content reduces the aircraft range. High volumetric energy content maximizes the energy that can be stored in a fixed volume and thus increase the flight range. Aviation fuel also needs to be ther-mally stable, to avoid freezing at low temperature and to satisfy other requirement in term of ignition properties, surface tension, and compatibility with the aviation material. Best alternative fuel amongst the alternative fuels can be compared on the basis of compatibility with current systems, fuel pro-duction technology, chemical, physical, and thermal proper-ties of fuel. This study tries to identify the various aviation alternative fuels of present term, midterm, future fuels, and their properties which effect the fuel consumption in aviation industry.
concluded that hydrogen has the best characteristic and Robert O. Price [56] explained the potential of liquid hydrogen relative to conventional jet fuel. Edwards [57] described the composition and selected properties of kerosene fuel for use in aerospace application. Military jet fuels JP-5, 7, 8 and T-6, commercial jet fuels jet A, jet A-1 and TS-1, and kerosene rocket- propellants RP-1 and RG-1 were discussed. The properties which were studied include the approximate formula H/C ratio, boil-ing range, freeze point, flash point, and specific gravity. He also calculated the heat of formation of these fuels. Kazuhiro Tsuchida [32], Daggett et al. [58], Hileman et al. [59] studied the alternatives fuels and their prop-erties. Simon Blakey, Lucas Rye, and Christopher Willam Wilson, studied the aviation gas turbine alterna-tive fuels and their properties. The previous study ar-gued that alternative fuel & fuel properties have direct relationship with fuel consumption optimization in avi-ation. On the basic of this the fifth hypothesis can be formulated:
H5 (AFP)-There is a positive relationship between alternate fuel & fuel properties and FCO
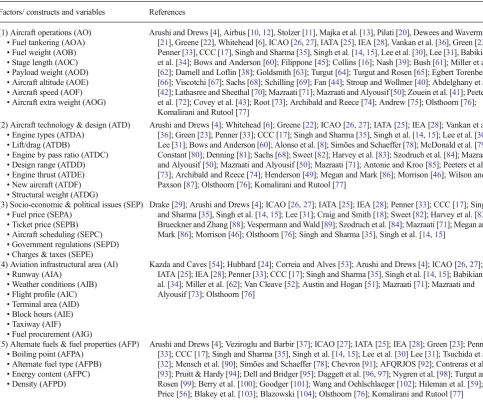
This study attempts to determine the FCO predictors as elaborate in Fig. 1. The research framework reveals that aircraft technology & design, aircraft operations, aviations alternative fuels & fuel properties have a positive and direct effect on, FCO. Table1shows the studied literature for the proposed hypotheses.
3 Research methodology
3.1 Sample and data collection
A survey instrument was developed in order to test the research model. Although the items and questions in the proposed questionnaire were adopted from existing stud-ies, the questionnaire was pre-tested with several senior academicians and experts from aviation industries to en-sure that the wording and format of the questions were appropriate. The data for this study were collected via a questionnaire survey. It was distributed to the 503 respon-dents and 257 was completed and returned. The responses rate was 51 % and out of 257 respondents 38 question-naires were excluded due to missing data. So numbers of valid sample were 219. The 118 respondent were from education and research institutes and 101 were from avi-ation industry. The respondents were the senior’s official, practitioners of aviation industries and top educational institutes of India and world. We used convenience sam-pling method for distributed the questionnaire.
3.2 Construct measures
In total, 31 questions were used to measure the six constructs. Since the six constructs in the proposed model of FCO are latent variables, observed variables are designed as survey instrument to measure the six constructs. Content validity was ensured through a comprehensive review of the literature and interviews with practitioners [105–108] and discussion number of researchers and experts of fuel optimization. Responses to the questions were based on a five-point Likert scale, ranging from 1= strongly disagrees to, 5= strongly agree).
3.3 Research steps
Based on the studies of Chin-Shan Lu et al. [106], Koufteros [109], Koufteros et al. [110] and Gerbing et al. [111] our research steps included exploratory factor analysis, confirma-tory factor analysis, and testing of structural model. In the first stage exploratory factor analysis (EFA) was used to provide the grouping of variables underline the complete set of item based upon the strong correlation [106,110]. EFA assesses the construct validity during the initial development of an instru-ment. After developing an initial set of items, researchers apply EFA to examine the underlying dimensionality of the item set. Thus, they can group a large item set into meaningful subsets that measure different factors. The primary reason for using EFA is that it allows items to be related to any of the factors underlying examinee responses [112]. Here EFA using principal component analysis (PCA) with varimax rotation were used on five (AO, ATD, SEP, AI, and AFP) constructs of FCO. PCA is a method of data reduction. Exploratory techniques can help us to develop the hypothesized models and that can be tested using confirmatory factor analysis (CFA).
In the second stage, a confirmatory factor analysis (CFA) was used to specify and estimate of one or more hypothetical models of factor structure, each of which propose a set of latent variables to account for covariance within a set of observed variables [109]. Several researchers have sug-gested the use of CFA with a multiple-indicator to access the unidimensionality. Unidimensionality refers to the exis-tence of the single constructs underlying a set of measures (Gerbing et al. [111]).
exogenous variables and, therefore, explain the entire set of relationships [113].
4 Results and findings
4.1 Exploratory factor analysis and results
Exploratory factor analysis (EFA) was used to provide the grouping of variables underline the complete set of item based upon the strong correlation [106, 110]. EFA assesses the construct validity during the initial development of an instru-ment. After developing an initial set of items, researchers apply EFA to examine the underlying dimensionality of the item set. Thus, they can group a large item set into meaningful subsets that measure different factors. The primary reason for using EFA is that it allows items to be related to any of the factors underlying examinee responses [112]. Principle
component factor analysis (EFA) with varimax- rotation was performed on five FCO constructs in order to extract the dimension underlying the each construct. The EFA of 30 items were loaded into the 5 FCO dimensions (Aircraft operations- 7 items, Aircraft technology & design-7 items, alternate fuels & fuel properties- 4 items, social-economic & political- 5 items, aviation infrastructural- 7 items). Table2shows the result of EFA, and reliability analysis.
Corrected item- total correlations (CITC) were used to check the consistency of the score with the average behaviour of the others [114]. A small correlation value indicates that item is not measuring the same construct as measured by the others and so it can be neglected. Item not having the CITC and factor loadings above 0.5 were the candidates for deletion [106,108, 113]. The items AOG, ATDA, SEPC, AIF, and AIG had CITC, and factor loadings less than 0.5 were re-moved from the scale. Eigen-values and % of variance for each constructs are shown in the Table1which were above the
Table 1 Studied literature for the proposed hypothesis of FCO
Factors/ constructs and variables References
(1) Aircraft operations (AO)
•Fuel tankering (AOA)
•Fuel weight (AOB)
•Stage length (AOC)
•Payload weight (AOD)
•Aircraft altitude (AOE)
•Aircraft speed (AOF)
•Aircraft extra weight (AOG)
Arushi and Drews [4], Airbus [10,12], Stolzer [11], Majka et al. [13], Pilati [20], Dewees and Waverman [21], Greene [22], Whitehead [6], ICAO [26,27], IATA [25], IEA [28], Vankan et al. [36], Green [23], Penner [33], CCC [17], Singh and Sharma [35], Singh et al. [14,15], Lee et al. [30], Lee [31], Babikian et al. [34]; Bows and Anderson [60]; Filippone [45]; Collins [16]; Nash [39]; Bush [61]; Miller et al. [62]; Darnell and Loflin [38]; Goldsmith [63]; Turgut [64]; Turgut and Rosen [65]; Egbert Torenbeek [66]; Viscotchi [67]; Sachs [68]; Schilling [69]; Fan [44]; Stroup and Wollmer [40]; Abdelghany et al. [42]; Lathasree and Sheethal [70]; Mazraati [71]; Mazraati and Alyousif [50]; Zouein et al. [41]; Peeters et al. [72]; Covey et al. [43]; Root [73]; Archibald and Reece [74]; Andrew [75]; Olsthoorn [76]; Komalirani and Rutool [77]
(2) Aircraft technology & design (ATD)
•Engine types (ATDA)
•Lift/drag (ATDB)
•Engine by pass ratio (ATDC)
•Design range (ATDD)
•Engine thrust (ATDE)
•New aircraft (ATDF)
•Structural weight (ATDG)
Arushi and Drews [4]; Whitehead [6]; Greene [22]; ICAO [26,27]; IATA [25]; IEA [28]; Vankan et al. [36]; Green [23]; Penner [33]; CCC [17]; Singh and Sharma [35], Singh et al. [14,15]; Lee et al. [30]; Lee [31]; Bows and Anderson [60]; Alonso et al. [8]; Simões and Schaeffer [78]; McDonald et al. [79]; Constant [80]; Denning [81]; Sachs [68]; Sweet [82]; Harvey et al. [83]; Szodruch et al. [84]; Mazraati and Alyousif [50]; Mazraati and Alyousif [50]; Mazraati [71]; Antonie and Kroo [85]; Peeters et al. [73]; Archibald and Reece [74]; Henderson [49]; Megan and Mark [86]; Morrison [46]; Wilson and Paxson [87]; Olsthoorn [76]; Komalirani and Rutool [77]
(3) Socio-economic & political issues (SEP)
•Fuel price (SEPA)
•Ticket price (SEPB)
•Aircraft scheduling (SEPC)
•Government regulations (SEPD)
•Charges & taxes (SEPE)
Drake [29]; Arushi and Drews [4]; ICAO [26,27]; IATA [25]; IEA [28]; Penner [33]; CCC [17]; Singh and Sharma [35], Singh et al. [14,15]; Lee [31]; Craig and Smith [18]; Sweet [82]; Harvey et al. [83]; Brueckner and Zhang [88]; Vespermann and Wald [89]; Szodruch et al. [84]; Mazraati [71]; Megan and Mark [86]; Morrison [46]; Olsthoorn [76]; Singh and Sharma [35], Singh et al. [14,15]
(4) Aviation infrastructural area (AI)
•Runway (AIA)
•Weather conditions (AIB)
•Flight profile (AIC)
•Terminal area (AID)
•Block hours (AIE)
•Taxiway (AIF)
•Fuel procurement (AIG)
Kazda and Caves [54]; Hubbard [24]; Correia and Alves [53]; Arushi and Drews [4]; ICAO [26,27]; IATA [25]; IEA [28]; Penner [33]; CCC [17]; Singh and Sharma [35], Singh et al. [14,15]; Babikian et al. [34]; Miller et al. [62]; Van Cleave [52]; Austin and Hogan [51]; Mazraati [71]; Mazraati and Alyousif [73]; Olsthoorn [76]
(5) Alternate fuels & fuel properties (AFP)
•Boiling point (AFPA)
•Alternate fuel type (AFPB)
•Energy content (AFPC)
•Density (AFPD)
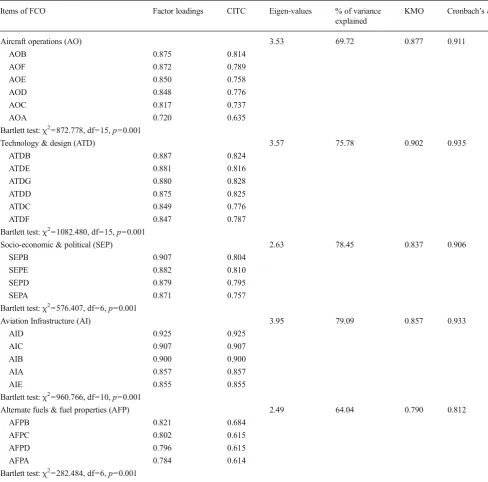
1 and 60 % [113]. Bartlett test of sphericity provides the statistical significance that the correlation matrix has signifi-cant correlations among at least some of variables. Bartlett test of sphericity the significant values for all the constructs (Ta-ble1) were less than the 0.05 the minimum limit. Kaiser-Meyer-Olkin (KMO) measure of sampling adequacy was used to access the suitability of respondent data for factor analysis. KMO measure provides a measure of extent to which vari-ables are belong together and thus appropriate for factor analysis [115]. KMO measure of sampling adequacy values for constructs; AO=0.877, ATD=0.902, SEP=0.837, AI=
0.857, and AFP=0.790 all the values were exceed the mini-mum limit 0.50 [113]. Final five factor model was estimated with remaining 25 items.
The reliability of the measurements in the survey was tested using Cronbach’s alpha (α). Reliability coefficients (α) of each of dimensions were as follows: aircraft operations (6 items,α=0.911), Technology & design (6 items,α=0.935), socio-economic & political (4 items,α=0.906), aviation infra-structure (5 items,α=0.918), and alternate fuels & fuel prop-erties (4 items,α=0.812). According to Hair et al. [113] and Cortina [116] the value of Cronbach’s alpha > 0.70 goes
Table 2 Exploratory factor analysis (EFA) of FCO
Items of FCO Factor loadings CITC Eigen-values % of variance explained
KMO Cronbach’sα
Aircraft operations (AO) 3.53 69.72 0.877 0.911
AOB 0.875 0.814
AOF 0.872 0.789
AOE 0.850 0.758
AOD 0.848 0.776
AOC 0.817 0.737
AOA 0.720 0.635
Bartlett test:χ2=872.778, df=15,p=0.001
Technology & design (ATD) 3.57 75.78 0.902 0.935
ATDB 0.887 0.824
ATDE 0.881 0.816
ATDG 0.880 0.828
ATDD 0.875 0.825
ATDC 0.849 0.776
ATDF 0.847 0.787
Bartlett test:χ2=1082.480, df=15,p=0.001
Socio-economic & political (SEP) 2.63 78.45 0.837 0.906
SEPB 0.907 0.804
SEPE 0.882 0.810
SEPD 0.879 0.795
SEPA 0.871 0.757
Bartlett test:χ2=576.407, df=6,p=0.001
Aviation Infrastructure (AI) 3.95 79.09 0.857 0.933
AID 0.925 0.925
AIC 0.907 0.907
AIB 0.900 0.900
AIA 0.857 0.857
AIE 0.855 0.855
Bartlett test:χ2=960.766, df=10,p=0.001
Alternate fuels & fuel properties (AFP) 2.49 64.04 0.790 0.812
AFPB 0.821 0.684
AFPC 0.802 0.615
AFPD 0.796 0.615
AFPA 0.784 0.614
uninterrupted. As the Cronbach’s alpha (α) value ranged from 0.829 to 0.925, so all the factors are accepted and reliable [117].
4.2 Confirmatory measurement analysis of FCO
The focus of the confirmatory study is the assessment of measurement properties and a test of a hypothesized structural model using the validation sample of 219 firms. Confirmatory factor analysis (CFA) was performed on the entire set of items simultaneously (6 constructs and 26 items). CFA was used to test the adequacy of the measurement model. CFA involves
the specification and estimation of hypothesized models of factor structure, with a correlation matrix to test the conver-gent validity of the constructs in subsequent analyses and other fit indices [106, 109, 113]. The confirmatory factor analysis (CFA) approach has overcome the limitations of the exploratory factor model in which only the basis of theories were analyzed, but CFA informs about (1) which pairs of common factors are correlated, (2) which observed variables are affected by which common factors, (3) which observed variables are affected by an error term factor, and (4) which pairs of error terms are correlated [106,118]. Here CFA using
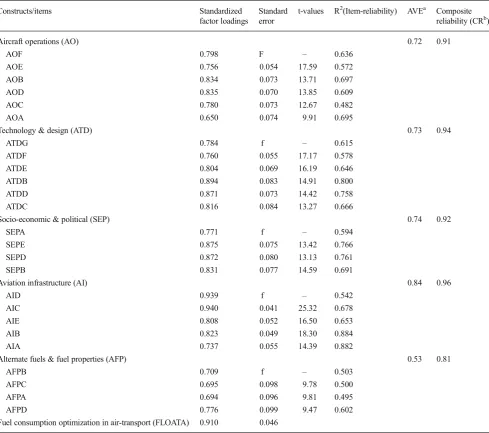
Table 3 Confirmatory factor analysis of FCO (CFA)
Constructs/items Standardized
factor loadings
Standard error
t-values R2(Item-reliability) AVEa Composite reliability (CRb)
Aircraft operations (AO) 0.72 0.91
AOF 0.798 F – 0.636
AOE 0.756 0.054 17.59 0.572
AOB 0.834 0.073 13.71 0.697
AOD 0.835 0.070 13.85 0.609
AOC 0.780 0.073 12.67 0.482
AOA 0.650 0.074 9.91 0.695
Technology & design (ATD) 0.73 0.94
ATDG 0.784 f – 0.615
ATDF 0.760 0.055 17.17 0.578
ATDE 0.804 0.069 16.19 0.646
ATDB 0.894 0.083 14.91 0.800
ATDD 0.871 0.073 14.42 0.758
ATDC 0.816 0.084 13.27 0.666
Socio-economic & political (SEP) 0.74 0.92
SEPA 0.771 f – 0.594
SEPE 0.875 0.075 13.42 0.766
SEPD 0.872 0.080 13.13 0.761
SEPB 0.831 0.077 14.59 0.691
Aviation infrastructure (AI) 0.84 0.96
AID 0.939 f – 0.542
AIC 0.940 0.041 25.32 0.678
AIE 0.808 0.052 16.50 0.653
AIB 0.823 0.049 18.30 0.884
AIA 0.737 0.055 14.39 0.882
Alternate fuels & fuel properties (AFP) 0.53 0.81
AFPB 0.709 f – 0.503
AFPC 0.695 0.098 9.78 0.500
AFPA 0.694 0.096 9.81 0.495
AFPD 0.776 0.099 9.47 0.602
Fuel consumption optimization in air-transport (FLOATA) 0.910 0.046
a
Average variance extracted (AVE)= (Summation of the square of the factor loadings )/[( Summation of the square of the factor loadings) + (summation of error variance)]
b
Amos 20 was employed (a software package for SEM) to test the measurement model. According to Hair et al. [113] for the construct validity the individual standardized factor loading should be at least 0.50. From Table3 it is clear that our standardized factor loadings for all the items exceed the min-imum value of 0.50.
Convergent validity can be assessed by examining the loadings and their statistical significance through t-values. In the AMOS text output file, the t-value is the critical ratio (C.R.), which represents the parameter estimate divided by its standard error. A t-value greater than 1.96 or smaller than −1.96 implies statistical significance ([106, 119]; Segars and Grover [120]). Here all the t-values exceed the minimum limit 1.96 at the 0.001 level of significance. Convergent validity can also be assessed by average vari-ance extracted (AVE). Table 3 shows that the AVE are ranging from 0.53 to 0.84, so all values are above the recommended 0.50 level [121], indicating that the conver-gent validity for the measurement model is confirmed.
The item reliability (R2) can be used to estimate the reli-ability of a particular observed item [109]. R2values above 0.50 provide evidence of acceptable reliability [122]. From table all the values of R2are higher than the minimum limit 0.50 expect the items AOC, and AFPA but these values are very nearer to 0.5 so they were not eliminated from the model. The composite reliability is calculated by the formula provid-ed by Fornell and Larcker [121] and here from Table3 the results ranging from 0.91 to 0.96 exceed the critical value of 0.70 recommended by Hair et al. [113]. Therefore the com-posite reliability is confirmed.
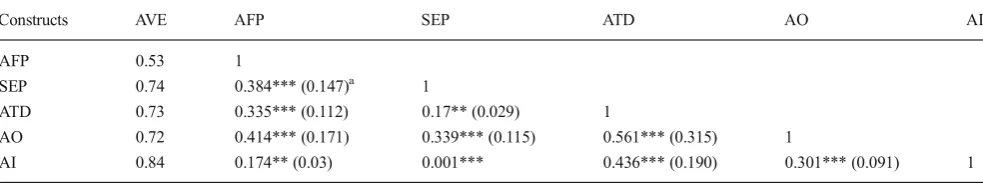
Discriminate validity is examined by comparing the squared correlation between each pairs of constructs with average variance extracted. Discriminate validity is extent to which a construct is truly distinct from other [113]. Discrim-inant validity exists if the items share more common variance with their respective construct than any variance that construct shares with other constructs. The AVE for a construct should be substantially higher than the squared correlation between that construct and all other constructs [109, 121]. Table 4
shows that the highest squared correlation was observed be-tween aircraft technology & design and aircraft operations and it was 0.315. This was significantly lower than their individual AVEs. The AVE for the latent variables was 0.73 and 0.72, respectively. The results have demonstrated evidence of dis-criminant validity for the study constructs (Table4).
From the above results it is cleared that the measures are unidimensional, in which each item reflecting one and only one underlying construct [122, 123]. In sum, the overall results of the goodness-of-fit of the model and the assessment of the measurement model lent substantial support to confirming the proposed model.
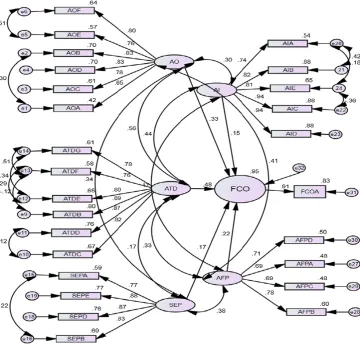
4.3 Evolution of model using SEM
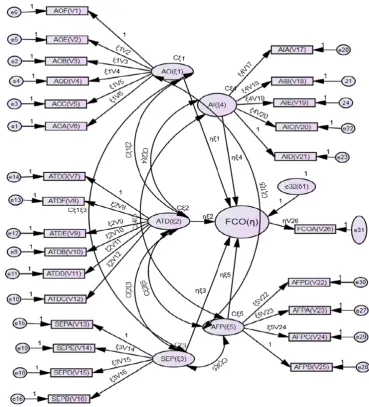
After the proposed model had been purified during the CFA, next the structural model of FCO and hypothesized relation-ships are tested, with maximum likelihood estimation method & covariance matrix, and 26 measurement items used as input. Figure 6 shows structural model with five first-order correlated latent factors. Here V1 TO V26,ξ1 toξ5, e1 to e26, represents the measured variables, latent factors, and mea-sured variable residuals. δ1 represents the prediction error associated with latent factor (η). Variances and covariance are represented by latter C (e.g. Cξ1 represents the variance of latent construct ξ1 and Cξ1ξ2 represents the covariance between the latent constructξ1 andξ2). In Fig.6,ηξ1 toηξ5 indicated the structural effects from one latent variable to another (e.g.ηξ1 indicated the path fromξ1 toη) and ξV denotes the path loadings (e.g.ξ1V2 denote the path loading from to item V2 fromξ1). From the studies of Joreskog [124,
125], Fornell and Larcker [121], Bentler and Dudgeon [126] Mueller and Hancock [127] and Koufteros et al. [128] it is interpreted that this hypothesized model consists of two sets of equations structural equations and measurement equations. Table5shows structural and measurement equations implied by the path diagram in Fig.6.
The results of the hypotheses testing indicate a good fit between the model and the observed data (Table 6). The
Table 4 Correlations and squared correlation between alternate fuels & fuel properties (AFP), social-economic & political (SEP), aircraft technology & design (ATD), aircraft operations (AO), aviation infrastructural (AI)
Constructs AVE AFP SEP ATD AO AI
AFP 0.53 1
SEP 0.74 0.384*** (0.147)a 1
ATD 0.73 0.335*** (0.112) 0.17** (0.029) 1
AO 0.72 0.414*** (0.171) 0.339*** (0.115) 0.561*** (0.315) 1
AI 0.84 0.174** (0.03) 0.001*** 0.436*** (0.190) 0.301*** (0.091) 1
***Correlation is significant at the 0.001 level **Correlation is significant at the 0.05 level a
overall fir indices of measurement model χ2/df=1.283, p-value = 0.001, GFI = 0.895, AGFI = 0.865, NFI = 0.924, RMR=0.056, CFI=0.982, TLI=0.979, and RMSEA=0.036. The ratio ofχ2over df has been recommended as a better measure of goodness-of-fit. A better level of theχ2/df ratio should be < 3. Theχ2/df ratio of our model was 1.285. The p-value=0.001 yielded statistically significantp-values [113]. This provides evidence of model fits as the hypothesized model can represent adequately the observed data. According to Judge and Hulin [129] the GFI should not go lower than 0.80. GFI and AGFI had the values 0.895 and 0.865 which are acceptable [106]. The NFI [130] and CFI [131] were also used, for investigating the best fitted model. These indices should not go lower than 0.90 and here the values of NFI and CFI were 0.924 and 0.982 which indicates towards good fit. TLI, RMR and RMSEA are also within the limits as suggested by Hair et al. [113], Katos, A.V. [132], Hart, P.M. [133], Hu and Bentler [134], Fan et al. [135], Bentler and Bonett [130], James
B. Schreiber et al. [136]. It can be concluded that these values meets the requirement of acceptable model.
Table6and Fig.7shows the analysis of path coefficients with FCO. An analysis of standardised path coefficients’ reveals the directions and significance of the hypothesized relationships among the five influence factors and FCO.
In H1, it is hypothesized that aircraft operations (AO) have a significant and positive impact on the FCO. The results show (Table 6 and Fig.7) that H1 is strongly supported as shown by the standardized coefficient of, β=0.333 at a sig-nificance level of less than 0.01. In H2, it is hypothesized that aircraft technology & design (ATD) have a significant and positive impact on FCO. The results show that H2 is support-ed (β=0.477;p<0.001) and ATD have a higher effect on the FCO compared to the AO. H3 suggest that social-economic, & political issues (SEP) have a significant and positive impact on FCO, which is confirmed by the estimates ofβ=0.168; p<0.05. H4 predicts that aviation infrastructure (AI) have positive and significant effect on FCO which is confirmed
byβ=0.155;p<0.05. H5 also suggest that the alternative fuels & fuel properties (AFP) have a significant and positive impact on FCO which is confirmed byβ=0.218;p<0.05.
5 Conclusions, limitations and future work
5.1 Concluding discussion
This study has provided empirical justification for the pro-posed research framework which describes the relationships between FCO and its dimensions. This has developed an integrated model of FCO, with the purposes of identifying the key factors affecting the FCO. Based on the review of literature on fuel consumption in aviation, five key factors influencing FCO were selected, and SEM approach was used to examine their relationship with FCO. Five key influence factors are proved to have significant and positive effect on FCO, namely aircraft operations, aircraft technology & design, socio-economic & political, aviation infrastructure, and
alternative fuels & properties. Among the five influence fac-tors for FCO, aircraft technology & design (β= 0.477; p<0.001) exhibits the strongest effect on FCO, followed by aircraft operations (β=0.333,p<0.01), alternative fuels & fuel properties (β=0.218; p<0.05), socio-economic & political (β=0.168; p<0.05), and aviation infrastructure (β=0.155; p<0.05). The highest squared correlation was observed be-tween aircraft technology & design and aircraft operations and it was 0.315.
The emerging technology and design feature finally leads to the fuel consumption optimization. New material technology has also high impact on fuel consumption. The reduction of aircraft weight can be achieved by the introduction of new material technology and advance structural design. By adopting new technology and design Indian air transport in-dustry can reduce the fuel consumption. Operational improve-ments increase the performance of any of the aircraft. Airline efficiency can be increased by managing the aircraft operations properly. Through proper flight planning aircraft fuel con-sumption can be reduced. A viable alternative aviation fuel
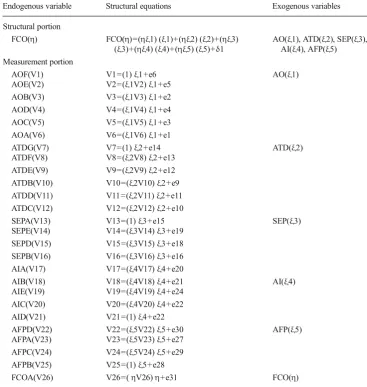
Table 5 Structural and measure-ment equations implied by the path diagram in Fig.6
Endogenous variable Structural equations Exogenous variables
Structural portion
FCO(η) FCO(η)=(ηξ1) (ξ1)+(ηξ2) (ξ2)+(ηξ3) (ξ3)+(ηξ4) (ξ4)+(ηξ5) (ξ5)+δ1
AO(ξ1), ATD(ξ2), SEP(ξ3), AI(ξ4), AFP(ξ5) Measurement portion
AOF(V1) V1=(1)ξ1+e6 AO(ξ1)
AOE(V2) V2=(ξ1V2)ξ1+e5 AOB(V3) V3=(ξ1V3)ξ1+e2 AOD(V4) V4=(ξ1V4)ξ1+e4 AOC(V5) V5=(ξ1V5)ξ1+e3 AOA(V6) V6=(ξ1V6)ξ1+e1
ATDG(V7) V7=(1)ξ2+e14 ATD(ξ2)
ATDF(V8) V8=(ξ2V8)ξ2+e13 ATDE(V9) V9=(ξ2V9)ξ2+e12 ATDB(V10) V10=(ξ2V10)ξ2+e9 ATDD(V11) V11=(ξ2V11)ξ2+e11 ATDC(V12) V12=(ξ2V12)ξ2+e10
SEPA(V13) V13=(1)ξ3+e15 SEP(ξ3)
SEPE(V14) V14=(ξ3V14)ξ3+e19 SEPD(V15) V15=(ξ3V15)ξ3+e18 SEPB(V16) V16=(ξ3V16)ξ3+e16 AIA(V17) V17=(ξ4V17)ξ4+e20
AIB(V18) V18=(ξ4V18)ξ4+e21 AI(ξ4) AIE(V19) V19=(ξ4V19)ξ4+e24
AIC(V20) V20=(ξ4V20)ξ4+e22 AID(V21) V21=(1)ξ4+e22
AFPD(V22) V22=(ξ5V22)ξ5+e30 AFP(ξ5) AFPA(V23) V23=(ξ5V23)ξ5+e27
AFPC(V24) V24=(ξ5V24)ξ5+e29 AFPB(V25) V25=(1)ξ5+e28
Table 6 Structural model results
***Correlation is significant at the 0.001 level
**Correlation is significant at the 0.05 level
*Correlation is significant at the 0.01 level
Path coefficients of FCO model
Relationship Standard path coefficients C.R. p-values Support of hypothesis
AO→FCO 0.333 2.765 0.006* H1 Supported
ATD→FCO 0.477 3.232 *** H2 Supported
SEP→FCO 0.168 2.415 0.023** H3 Supported
AI→FCO 0.155 2.386 0.017** H4 Supported
AFP→FCO 0.218 2.352 0.019** H5 Supported
Goodness of fit indices for FLOAT model
Criteria Indicators
χ2
test
χ2
353
χ2
/df <3 1.283(353/275)
Fit indices
GFI >0.80 0.895
AGFI >0.80 0.865
NFI >0.90 0.924
RMR ≤0.08 0.056
CFI >0.90 0.982
TLI >0.90 0.979
RMSEA <0.06 to 0.08 0.036
can stabilize fuel price fluctuation and reduce the reliance from the crude oil. There are many social, political, and economic factors which effect the airline fuel consumption optimization. If these factors are carefully managed then significant amount of fuel can be saved. Indian air transport industry is also lacking in the infrastructural area. Aviation infrastructure also plays an important role in fuel consumption optimization. Infrastructure improvements present a major opportunity for fuel consumption reduction in aviation.
This study has several implications. It is one of the few studies which attempts to investigate if there is a relationship between FCO and its five factors. In the past, these factors and their relationships have not discussed combined yet. This finding will help decision makers in aviation industry to know the importance of FCO and their factors. The decision makers can also prioritize the factors of FCO on which their firms should focus in order to improve their fuel economy. Decision makers should therefore continue to improve their aircraft technology & design because it had the strongest effect. The merging technology and design feature finally leads to the fuel consumption optimization. This study has developed and validated a multi-dimensional construct of FCO, which can assist decision makers of Indian air transport industry and other aviation industries to evaluate their fuel economy.
This study has offered critical factors that affect fuel con-sumption with regard to Indian air transport industry. More-over the study exhibited the model that shows relationship among these critical factors (AO, ATD, SEP, AI, and AFP) with respect to fuel consumption. This knowledge can lead to construct the customized optimization model for fuel con-sumption. The knowledge of relationship among variables can lead to frame objective function, constraints, and set of equations pertaining situations with regard to Indian scenario. To constitute the equations the data of identified critical factors with regard to Indian scenario can be utilized which will lead to develop optimization based model for fuel consumption that leaves the scope for further study. This study produces the results which represent the base for optimum solution of fuel consumption on which future researchers can target.
5.2 Limitations and future research
The first limitation of this study was that distributions of our questionnaires were based on convenience sampling. Future research should apply different random samples for more generalisations of the results. There might other factor influencing FCO, in the future research we will integrate these factors for generating more precise understanding of factors influencing FCO. Further we hope our work will serve its intended purpose by its industrial implementation and will actually help optimize aviation fuel consumption. A general approach that can be used to achieve the goal i.e. optimized values of fuel consumption variables is by selection of testing
aircraft, data collection from flight manual, training of neural network , fuzzy logic and implementation & generalization of these for fuel consumption calculation. The feasibility of this generalized approach and its actual implementation will be scope for further investigations in this area.
Open AccessThis article is distributed under the terms of the Creative Commons Attribution License which permits any use, distribution, and reproduction in any medium, provided the original author(s) and the source are credited.
References
1. ICRA (2012) Indian aviation industry through turbulent time, FDI relaxation is not a game charger. ICRA Limited
2. Kanthe RU (2012) Challenges of Indian aviation industry in chaotic phase. Innov J Bus Manag 1(3):54–56
3. Ramya K, Siji S (2007) Strategic alliance and joint ventures in civil aviation—a case study. Conference on Global Competition & Competitiveness of Indian Corporate
4. Arushi, Drews S (2011) Aviation and environment. A working paper, Center for Science and Environment, pp. 1–62
5. CSO (2011) National Statistical Organization, Ministry of Statistics and Program Implementation Government of India, pp. 53 6. Whitehead AH Jr (1977) The promise of air cargo—system aspects
and vehicle design. Acta Astronautica 4(1–2):77–98
7. IOCL (2012) Aviation turbine fuel prices in metros for domes-tic and international airlines (http://www.iocl.com/Products/ AviationTurbineFuel.aspx)
8. Alonso JJ, LeGresley P, Pereyra V (2009) Aircraft design optimi-zation. Math Comput Simul 79(6):1948–1958
9. FIA (2012) Comparative ATF rates (March, 2006). (http://www. fiaindia.in/fiscal_issues.htm)
10. Airbus (2004) Getting to grip with fuel economy. Flight Operations Support & Line Assistance, Iss. 4
11. Stolzer AJ (2002) Fuel consumption modeling of transport category aircraft: a flight operations quality assurance data: a literature re-view. J Air Transp 7(1):93–102
12. Airbus (2008) Getting to grip with A320 family performance reten-tion and fuel savings. Flight Operareten-tions Support & Services, Iss. 2 13. Majka A, Brusow V, Klepack Z (2007) Fuel Consumption and
transportation energy effective analysis. European Personal Air Transportation System Study, EP- D4.3, SFC-V0, pp. 1–23 14. Singh V, Sharma SK, Vaibhav S (2012) Modeling the civil aircraft
operations for the optimization of fuel consumption in Indian air transport industry. J Ind Eng Lett 2(7):20–29
15. Singh V, Sharma SK, Vaibhav S (2012) Identification of dimensions of the optimization of fuel consumption in air transport industry: a literature review. J Energy Technol Policy 2(7):24–33
16. Collins BP (1982) Estimation of aircraft fuel consumption. J Aircr 19(11):969–975
17. Committee on Climate Change (CCC) (2009) Meeting the UK aviation target—options for reducing emission to 2050
18. Craig VF Jr, Smith BG (1978) Aviation fuel usage- economy and consideration. Can Aeronaut Space J 24(1):34–49
19. Dalton CP (1977) The availability of jet fuel over the next two decades. Aircr Eng Aerosp Technol 49(12):8–14
20. Pilati DA (1974) Energy use and conservation alternatives for airplanes. Transp Res 8:433–441
22. Greene DL (1990) Commercial aircraft fuel efficiency potential through 2010. Proceedings of the 25th Intersociety Energy Conservation Engineering Conference- IECEC 90, vol. 4:106–111 23. Green JE (2009) The potential for reducing the impact of aviation
on climate. Tech Anal Strat Manag 21(1):39–59
24. Hubbard HB (1978) Terminal airspace/ airport congestion delays. Interfaces 8(2):1–14
25. International Air Transport Association (IATA) (2009) Technology roadmap report
26. International Civil Aviation Organization (ICAO) (2005) Fuel crises and urgent need to implement the fuel saving measures. APIRG/15-WP/41
27. International Civil Aviation Organization (ICAO) (2007) Environmental report
28. International Energy Agency (IEA) (2009) Transport energy and CO2. IEA/OECD
29. Drake JW (1974) Social, political and economic constraints on airline fuel optimization. Transp Res 8:443–449
30. Lee JJ, Lukachko SP, Waitz IA, Schafer A (2001) Historical and future trends in aircraft performance cost and emission. Annu Rev Energy Environ 26:167–200
31. Lee JJ (2010) Can we accelerate the improvement of energy effi-ciency in aircraft systems? Energy Conserv Manag 51:189–196 32. Tsuchida K, Hayashi K, Kumabe K, Hasegawa T (2007)
Assessment on alternative fuels from perspectives of petro-leum depletion and environmental restriction in the future. Proceedings of International Symposium on EcoTopia Science, ISET07, 1–5
33. Penner JE (ed) (1999) Aviation and the global atmosphere: special report of the IPCC working groups I and III in collaboration with the scientific assessment panel to the Montreal protocol on substances that deplete the ozone layer. Cambridge University Press, Cambridge
34. Babikian R, Lukachko SP, Waitz IA (2002) The historical fuel efficiency characteristics of regional aircraft from technological, operational, and cost perspectives. J Air Transp Manag 8:389–400 35. Singh V, Sharma SK (2010) Exploring the parameters for the optimization of fuel consumption in aviation industry: a literature review. Rev Bus Res 10(3):204–210
36. Vankan J, Kesseler E, Laban M (2008) Multiobjective optimization of aircraft range and fuel consumption. National Aerospace Laboratory NLR
37. Veziroglu TN, Barbir F (1992) Hydrogen: the wonder fuel. Int Assoc Hydrog Energy 17(6):391–404
38. Darnell DW, Loflin C (1977) National airline fuel management and allocation model. Interfaces 7(2):1–16
39. Nash B (1981) A simplified alternative to current airline fuel allo-cation models. Interfaces 11(1):1–9
40. Stroup JS, Wollmer RD (1992) A fuel management model for airline industry. Informs 40(2):229–237
41. Zouein PP, Abillama WR, Tohme E (2002) A multiple period capacitated inventory model for airline fuel management: a case study. J Oper Res Soc 53(4):379–386
42. Abdelghany K, Abdelghany A, Raina S (2005) A model for airline fuel management strategies. J Air Transp Manag 11: 199–206
43. Covey RR, Mascetti GJ, Rooesler WU, Bowles RL (1979) Operational energy conservation strategies in commercial aviation. Decision and Control Including the Symposium on Processes, 18th IEEE Conference, vol. 18, 408–414
44. Fan HSL (1990) Fuel conservation by controlling aircraft ground operations. Transp Plan Technol 15(1):1–11
45. Filippone A (2008) Comprehensive analysis of transport aircraft flight performance. Prog Aero Sci 44:192–236, Elsevier
46. Morrison SA (1984) An economic analysis of aircraft design. J Transp Econ Policy 18(2):123–143
47. Pant R, Fielding JP (1999) Aircraft configuration and flight profile optimization using simulated annealing. Aircr Des 2(4):239–255
48. Antoine NE, Kroo IM (2004). Aircraft optimization for minimal environmental impact. J Aircraft 41(4):790–797
49. Henderson RP (2009) Multidisciplinary design optimization of airframe and engine for emission reduction. Thesis Work for the Degree of Master of Applied Science, University of Toronto 50. Mazraati M, Alyousif OM (2009) Aviation fuel demand modeling
in OECD and developing countries: impacts of fuel efficiency. OPEC Energy Rev 33(1):23–46
51. Austin LM, Hogan WW (1976) Optimizing the procurement of aviation fuels. Manag Sci 22(5):515–527
52. Van Cleave DA (2009) Green air space: reducing fuel burn. The MITRE Digest
53. Correia AR, Alves CJ (2005) Optimal configuration of airport passenger terminals. 9th Annual World Conference Air Transport Research Society, Issue 31, 1–5
54. Kazda A, Caves RE (2000) Airport design and operation. Elsevier Sciences Ltd, Oxford
55. Senzig DA, Fleming GG, Iovinelli RJ (2009). Modeling of termi-nal-area airplane fuel consumption. J Aircraft 46(4):1089–1093 56. Price RO (1991) Liquid hydrogen—an alternative aviation fuel. Int
Assoc Hydrog Energy 16(8):557–562
57. Edwards T (2002) Kerosene fuels for aerospace propulsion-compo-sition and properties. AIAA Paper, 3874
58. Daggett DL, Hendricks RC, Walther R, Corporan E (2007). Alternate fuels for use in commercial aircraft. The Boeing Company 59. Hileman JI, Ortiz DS, Bartis JT, Wong HM, Donohoo PE, Weiss
MA, Waitz IA (2009) Near term feasibility of alternative jet fuels. RAND, Infrastructure, Safety, and Environment, 1–95
60. Bows A, Anderson KL (2007) Policy clash: can projected aviation growth be reconciled with the UK Government’s 60 % carbon-reduction target? Transp Policy 14(2):103–110
61. Bush BA (2006) Analysis of fuel consumption for an aircraft deployment with multiple aerial refueling. A Dissertation Work, Operational Research, 1–63
62. Miller B, Minogue K, Clark JP (2001) Constraints in aviation infrastructure and surface aircraft emissions, MIT
63. Goldsmith DJ (1981) Airliner maintenance for fuel efficiency. AIAA-787
64. Turgut E (2011) Estimating aircraft fuel flow for a three-degree flight-path-angle descent. J Aircr 48(3):1099–1106
65. Turgut ET, Rosen MA (2012) Relationship between fuel consump-tion and altitude for commercial aircraft during descent: preliminary assessment with a genetic algorithm. Aerosp Sci Technol 17(1):65– 73
66. Torenbeek E (1997) Cruise performance and range prediction reconsidered. Prog Aerospace Sci 33(5–6):285–321, Elsevier 67. Viscotchi F (2006) Aviation operational measures for fuel and
emission reduction-weight management. Aircraft Panel- Montreal, September, 20–21
68. Sachs G (1992) Optimization of endurance performance. Prog Aerosp Sci 29(2):165–191
69. Schilling GD (1997) Modeling aircraft fuel consumption with neu-ral network. Thesis Report, Master of Science, Virgina Polytechnic Institute and State University, pp. 1–110
70. Lathasree P, Sheethal RM (2008) Estimation of aircraft fuel con-sumption for a mission profile neural network. International Conference on Aerospace Science and Technology, (INCAST, 2008–115), 26–28
71. Mazraati M (2010) World aviation fuel demand outlook. OPEC Energy Rev 34:42–71
73. Root R (2002) Airframe maintenance for environmental perfor-mance. Workshop on Aviation Operational Measures for Fuel and Emission Reduction, Madrid 21–22
74. Archibald RB, Reece WS (1977) The impact of the energy crisis on the demand for fuel efficiency: the case of general aviation. Transp Res 11(3):161–165
75. Andrew BT Jr (2006) Airline fuel conservation methods. Advanced Aviation Economics, pp. 1–12
76. Olsthoorn X (2001) Carbon dioxide emissions from international aviation: 1950–2050. J Air Transp Manag 7(2):87–93
77. Komalirani Y, Rutool S (2012) CO2emission reduction potential through improvement in technology from civil aviation sector in India—a case of Delhi-Mumbai air route. Res J Recent Sci 1:134– 1444
78. Simões AF, Schaeffer R (2005) The Brazilian air transportation sector in the context of global climate change: CO2emissions and mitigation alternatives. Energy Convers Manag 46(4):501–513 79. McDonald CF, Massardo AF, Rodgers C, Stone A (2008)
Recuperated gas turbine aeroengines, part I: early development activities. Aircr Eng Aerosp Technol 80(2):139–157
80. Constant EW (1973) A model for technological change applied to the turbojet revolution. Technol Cult 14(4):553–572
81. Denning RM (1978) Energy conserving aircraft from the engine viewpoint. Aircr Eng Aerosp Technol 50(8):27–37
82. Sweet HS (1977) Short haul transport systems and aircraft technol-ogy. Acta Astronautica 4(1–2):35–52
83. Harvey RA, Morris RE, Palfreeman BJ (1979) Aircraft fuel econo-my the propulsion system contribution. Can Aeronaut Space J 25(1):17–27
84. Szodruch J, Grimme W, Blumrich F, Schmid R (2011) Next gener-ation single-aisle aircraft—requirements and technological solu-tions. J Air Transp Manag 17(1):33–39
85. Antonie NE, Kroo IM (2004) Aircraft for minimal environmental impact. J Aircraft 41(4):790–797
86. Megan S, Mark H (2009) The potential of turboprops to reduce the aviation fuel consumption. University of California Transportation Centre
87. Wilson J, Paxson DE (1996) Wave rotor optimization for gas turbine engine topping cycles. J Propuls Power 12(4):778–785
88. Brueckner JK, Zhang A (2010) Airline emission charges: effects on airfares, service quality, and aircraft design. Transp Res B Methodol 44(8–9):960–971
89. Vespermann J, Wald A (2011) Much Ado about nothing?—An analysis of economic impacts and ecologic effects of the EUemission trading scheme in the aviation industry. Transp Res A Policy Pract 45(10):1066–1076
90. Mensch A, Santoro RJ, Litzinger TA, Lee S-Y (2010) Sooting characteristics of surrogates for jet fuels. Combust Flame 157(6): 1097–1105
91. Chevron (2006) Global aviation, aviation fuel technical review 92. Aviation Fuel Quality Requirements for Jointly Operated Systems
(AFQRJOS) (2005) (20), Annex III/2 and Annex III/3
93. Contreras A, Yigit S, Ozay K, Veziroglu TN (1997) Hydrogen as aviation fuel: a comparison with hydrocarbon fuels. Int J Hydrog Energy 22(10–11):1053–1060
94. Pruitt DS, Hardy DR (1994) Analysis of instability deposit to thermal in aviation jet fuels. Fuel Sci Technol Int 12(7–8):1035–1049
95. Dell RM, Bridger NJ (1975) Hydrogen—the ultimate fuel. Appl Energy 1(4):279–292
96. Daggett D, Hadaller O, Hendricks R, Walther R (2006) Alternative fuels and their potential impact on aviation. 25th International Congress of the Aeronautical Sciences- ICAS, 5.8.2
97. Daggett DL, Hendricks RC, Walther R, Corporan A (2008) Alternate fuel for use in commercial aircraft. NASA/TM, 214833 98. Nygren E, Aleklett K, Hook M (2009) Aviation fuel and future oil
production scenario. Energy Policy 37:4003–4010
99. Turgut ET, Rosen MA (2010) Partial substitution of hydrogen for conventional fuel in an aircraft by utilizing unused cargo compart-ment space. Int J Hydrog Energy 35(3):1463–1473
100. Berry GD, Pasternak AD, Rambach GD, Ray Smith J, Schock RN (1996) Hydrogen as a future transportation fuel. Energy 21(4):289– 303
101. Goodger EM (1996) Jet fuels. Aircr Eng Aerosp Technol 68(5):3–6 102. Wang H, Oehlschlaeger MA (2012) Auto ignition studies of conventional and Fischer–Tropsch jet fuels. Fuel 98:249– 258
103. Blakey S, Rye L, Wilson CW (2010) Aviation gas turbine alterna-tive fuels: a review. Proceeding of Combustion Institute, in press 104. Blazowski WS (1978) Future jet fuel combustion problems and
requirements. Prog Energy Combust Sci 4(3):177–199
105. Belanger F, Hiller JS, Smith WJ (2002) Trustworthiness in electron-ic commerce: the role of privacy, security, and sit attributes. Strat Inf Syst 11:245–270
106. Lu C-S, Lai K-H, Cheng TCE (2007) Application of structural equation modeling to evaluate the intention of shippers to use Internet services in liner shipping. Eur J Oper Res 180:845–867 107. Suh B, Han I (2003) The impact of customer trust and perception of
security control on the acceptance of electronic commerce. Int J Electron Commer 7(3):135–161
108. Chang Y-H, Liao M-Y (2009) The effect of aviation safety education on passenger cabin safety awareness. Saf Sci 47: 1337–1345
109. Koufteros XA (1999) Testing a model of pull production: a para-digm for manufacturing research using structural equation model-ing. J Oper Manag 17:467–488
110. K o u f t e r o s X A , Vo n d e r e m b s e M A , D o l l W J ( 2 0 0 1 ) Concurrent engineering and its consequences. J Oper Manag 19:97–115
111. Gerbing DW, Anderson JC (1988) An updated paradigm for scale development incorporating unidimensionality and its assessment. J Mark Res 25(2):186–192
112. Worthington RL, Whittaker TA (2006) Scale development research a content analysis and recommendations for best practices. Couns Psychol 34(6):806–838
113. Hair JF, Black WC, Babin BJ, Anderson RE (2010) Multivariate data analysis. Pearson Education, Inc, Upper Saddle River 114. Churchill GA (1979) A paradigm for developing better measures of
marketing constructs. J Mark Res 16:64–73
115. Stewart DW (1981) The application and misapplication of factor analysis in marketing research. J Mark Res 18(1):51– 62
116. Cortina JM (1993) What is coefficient Alpha? An examination of theory and application. J Appl Psychol 78(4):98–104
117. Nunnally JC (1978) Psychometric theory. McGraw-Hill, New York
118. Garver MS, Mentzer JT (1999) Logistics research methods: employing structural equation modeling to test for construct valid-ity. J Bus Logist 20(1):33–58
119. Byrne BM (2001) Structural equation modeling with AMOS: basic concepts, applications, and programming. Lawrence Erlbaum Associates, New Jersey
120. Segars AH, Grover V (1998) Strategic information systems plan-ning success: an investigation of the construct and its measurement. MIS Q 22(2):139–163
121. Fornell CR, Larcker DF (1981) Evaluating structural equation models with unobservable variables and measurement error. J Mark Res 18:39–50
122. Bollen KA (1989) Structural equations with latent variables. Wiley-Interscience Publication, New York
124. Jöreskog KG (1970) A general method for analysis of covariance structures. Biometrika 57(2):239–251
125. Jöreskog KG (1978) Structural analysis of covariance and correla-tion matrices. Psychometrika 43(4):443–477
126. Bentler PM, Dudgeon P (1996) Covariance structure analysis: statistical practice, theory, and directions. Annu Rev Psychol 47(1):563–592 127. Mueller RO, Hancock GR (2008) Best practices in structural
equa-tion modeling. Best practices in quantitative methods, 488–508 128. Koufteros X, Babbar S, Kaighobadi M (2009) A paradigm for
examining second-order factor models employing structural equa-tion modeling. Int J Prod Econ 120(2):633–652
129. Judge TA, Hulin CL (1993) Job satisfaction as a reflection of disposition: a multiple source causal analysis. Organ Behav Hum Decis Process 56:388–421
130. Bentler PM, Bonett DG (1980) Significance test and goodness of fit in the analysis of covariance structures. Psychol Bull 88(3):588–606
131. Bentler PM (1990) Comparative fit indexes in structural models. Psychol Bull 107:238–246
132. Katos AV (2010) The influence of information and communication technologies on enabling trade: a cross-country investigation. J Inf Technol Impact 10(1):15–24
133. Hart PM (1994) Teacher quality of work life: integrating work experiences, psychological distress and moral. J Occup Organ Psychol 67(2):109–132
134. Hu L-t, Bentler PM (1999) Cut-off criteria for fit indexes in covari-ance structure analysis: conventional criteria versus new alterna-tives. Struct Equ Model 6(1):1–55
135. Fan X, Thompson B, Wang L (1999) Effects ofsample size, estima-tion methods, and model specificaestima-tion on structural equaestima-tion model-ing fit indexes. Struct Equ Model 6(1):56–83