A Fair Cloud Resource Allocation using Data
Envelopment Analysis
Hsin-Hung Cho
Department of CSIE National Central UniversityTaoyuan, Taiwan, R.O.C [email protected]
Hao-Wen Li
Department of CSIE National Ilan UniversityIlan, Taiwan, R.O.C [email protected]
Han-Chieh Chao
Department of CSIE National Ilan UniversityIlan, Taiwan, R.O.C [email protected]
Chi-Yuan Chen
Department of CSIE National Ilan UniversityIlan, Taiwan, R.O.C [email protected]
Timothy K. Shih
Department of CSIE National Central UniversityTaoyuan, Taiwan, R.O.C [email protected]
Abstract—Internet technology is advancing with each passing day, the user's demand is also increasing. Of course the users will more concern to quality of service. The vendors must find out a win win method of resource allocation to meet users and itself. Therefore, the resource allocation of cloud computing has become one of hottest topics. In literatures, some researchers have proposed resource allocation methods which include allocation of virtual machines and service classification, etc. However, these methods are based on subjective observations that lead to the overall cloud architecture becomes imbalance. In order to prevent such situation happened, we use the Data Envelopment Analysis (DEA) to solve the imbalance problem. In this paper, our analysis is start from the user's requests, and use the DEA to evaluate the whole cloud parameters. Then we can find out the resource allocation policy which is the most suitable between the users and vendors.
Keywords- Cloud Computing; Resource Allocation; Data Envelopment Analysis.
I. INTRODUCTION
Resource allocation is a very important issue in the cloud computing [1][2][3][4].For providers, regardless of the issue exists in the infrastructure, service and platform, all of the solution also want to achieve a balanced system [5] with high quality service[6] and less bandwidth [13]. In general, some methods solve this problem by the VM adjustment, because the VM has a high relationship with the any services and the users directly. They allocate the number of VM according to the user's requirements, CPU capacity or bandwidth. Briefly, to allocate the VM from the resource pool to users is a more simple and efficient approach that are shown in the figure 1.
The resource allocation problems are often involved to the trade-off design, because the influence of each parameter will be different when it is in the specific system and these trade-off relations are close. It represents that we cannot focus on a parameter only. Otherwise, If we still do that, the whole system may be imbalance.
Nowadays has a lot of researches investigate the cloud resource allocation issues. The research scope involves many different service types which include Software as a Service(SaaS), Platform as a Service(PaaS) and Infrastructure as a Service(IaaS). Whether which types about cloud resource allocation that are all in accordance with user requirements to allot datacenter's resources for users.
There are some of researches in cloud resource allocation that are dynamic allocation as well as providing optimal quality for service and minimize operating costs[1]. They focused on discussion of CPU resources usage, and they also used of Service Level Agreement(SLA) as resource allocation basis to protect the user perceived Quality of Service(QoS). However, these methods take into account only a few of target. In fact we cannot use only such parameters to completely describe the entire cloud environment. If we remain to run these methods, the cloud system will focus on the part of the operation only. In this way, some important parts may be sacrificed. For the principle of fairness, we boldly hypothesize that more factors should be considered. Therefore, we had to consider demands of any users at any time.
In the paper, we use Data Envelopment Analysis(DEA) to analyze resource allocation problem which include user's demand, distance, CPU utilization and cost, etc. DEA can
QSHINE 2014, August 18-20, RHODES, Greece Copyright © 2014 ICST
Start
Setting analytical purposes To decide the study direction
Select the output entry
Define the relationship between the output entry
Analysis
Stop Setting Variables
To select DEA model
To confirm DEA model
Specific analysis and conclusions Output
entry analysis
Analysis
of
individual
units
Are data in thesame direction?
Yes
No
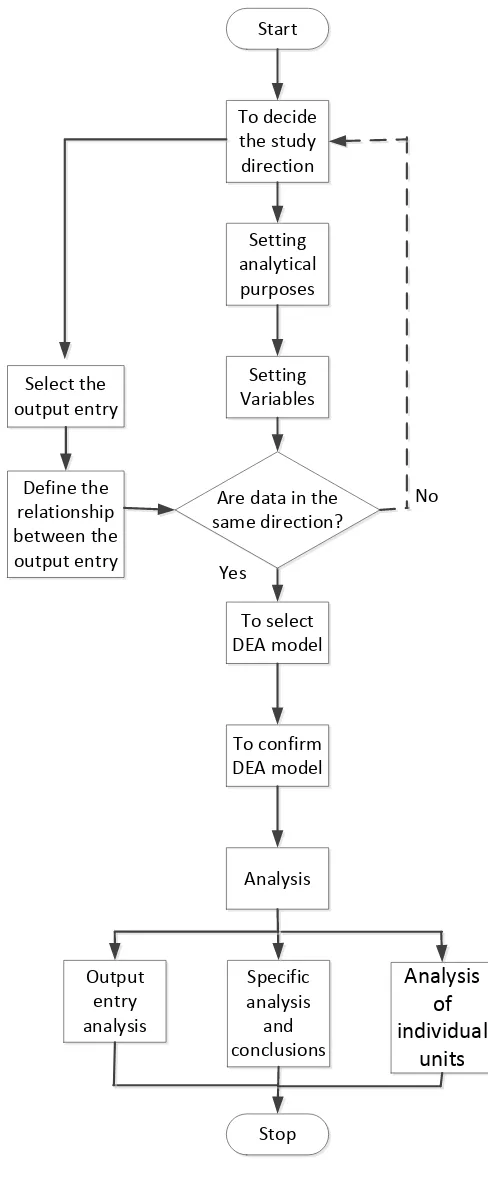
Figure 2. Workflow of DEA
Datacenter
Virtual Machine
The users obtain the most suitable resources
Request
Figure 1. Cloud resource allocation diagram
Figure 2.
analyze multi-output and multi-input simultaneously. It can show the relationship between each project according to the DEA characteristics which consider to the influence with each parameters. Finally, the analysis results will provide any users and service provider to find out the most appropriate resource allocation policy.
This paper is organized as follows: In section 2, we introduce some related works about cloud resource allocation problem. In section 3, we use DEA to find the optimal resource allocation policy. In section 4, we can evaluate the pros and cons of DEA. Finally we will summarize the contribution of this paper, and simply distribute the future works.
II. BACKGROUND
A. Cloud Resource Allocation
B. Data Envelopment Analysis
Data Envelopment Analysis(DEA) is a Pareto optimality according to some researches analysis of economics. The evaluating out most favorable result is assessed under efficiency value is the objective environment. DEA is a multi-output and multi-input analysis policy. Therefore, the conditions will be a relative target for other units so that they will not only mutual consideration but also the analyzed results will make each parameters accept. In simple term, this mathematical model hammer out the relative efficiency decision making any units be enveloped. The analyzed items must have homogeneity, hence we need to add Zweights so that the parameters can be pulled together to look at the same level. And this method use DMU curve to determine the smaller gap to closer the optimal solution [11][12].
A simple example, a basketball team manager can use DEA to allocate payroll. Usually a basketball team have limited total salary expenditure. How to allocate these salaries to the players for the fairest without waste? It is a very important issue for the team manager. At this time use the most convincing performance of each player as the metrics for DEA. These metrics include three-point shooting, rebounding, assists and blocked shots, etc. And we can observe that each parameter influence for the basketball game. Finally, the highest performance one can get the highest salary, thus every penny can be spent valuable do not wronged.
Figure 2. is DEA of flow chart. We determine our research direction of cloud resource allocation firstly, then we set the analysis goal to meet user's requirement for with principles of fairness. Next we decide input/output definition. Finally, we can determine DEA mode and analyzing.
III. ALLOCATION PROBLEM AND POLICY
In order to design a fair resource allocation in cloud environment, we use DEA to do the analysis on various factors. We chose DEA be our analysis tool because it consider many factors in simultaneously as well as every factors interaction. In this way, we just find out the optimal solution in various cases. Such interaction is usually exist in the resource allocation problem that there are two or more factors will affect in a same target or affect with each others. For a instance, the user will be a preferred if he is closer to the datacenter. It represents that the other users just the second choice for the datacenter. It shows the interaction of distance may has the influence for the user 's use rights. For another example, there are three users send the request to datacenter. In this time, the datacenter may provides a great resource to first user so that the others just send the request for the remaining resources in datacenter. In shows the interaction of order may has the influence for the user 's use rights. Therefore, we must taking into account to any user's characteristics such as distance, load and CPU utilization, etc. Because, any resources are datacenter's limited assets so that it simply cannot meet all the requirements. In order to achieve the fair allocation, the weights definition is a very important step so that they will be set to the same level can be compared. Before the weights design, we introduce the symbols which will be used in next subsection.
A. Symbols and Definitions
Formula (1) is the evaluated units of user in DEA:
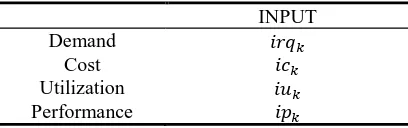
Input data includes Demand, Cost, Utilization and Performance. Demand means the capacity of VM user needs. Cost means how much money to rent the resource. Utilization means how much capacity of datacenter which have rented to user. Performance means performance of requirements user wants.
TABLE I. SYMBOLS DEFINITION OF INPUT DATA
INPUT
Demand
Cost
Utilization
Performance
Output data includes Resource, Cost, Utilization, Performance, Workload, Distance, Wasting time, Capacity and Idle. Resource means resource from datacenter that can provide to the user. Cost means datacenter running cost. Utilization and Workload means utilization and workload of datacenter. Distance means transmission delay generated from that the distance between the datacenter and the user. Wasting time means average time by VM on\off. Capacity means remaining available resources. Idle means the average time spent when VM has done the task but it do not shut down.
TABLE II. SYMBOLS DEFINITION OF OUTPUT DATA
OUTPUT
Resource
Cost
Utilization
Performance
Workload
Distance
Wasting time
Capacity
Idle
DEA limits the sum of weights as 1 as well as let the weight generated by mathematical programming so that there are not artificially subjective view points. Therefore, use of DEA can meet the principle of fairness.
TABLE III. SYMBOLS DEFINITION OF USERS (USER NUMBER 1~K)
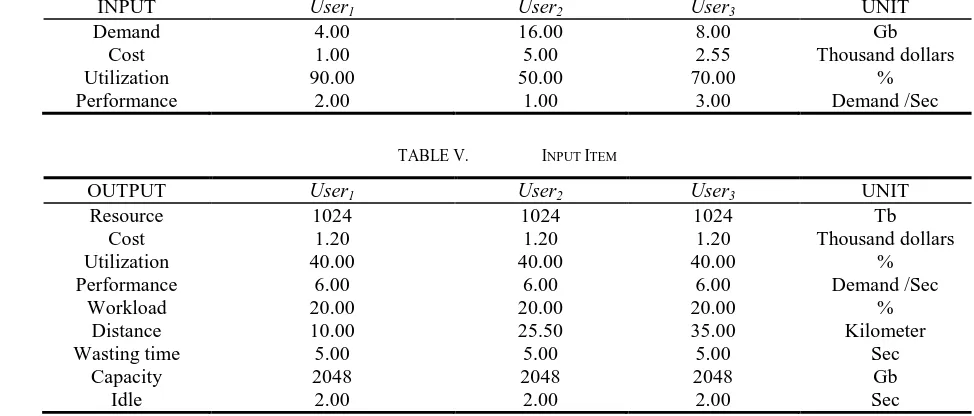
TABLE V. INPUT ITEM
OUTPUT User1 User2 User3 UNIT
Resource 1024 1024 1024 Tb
Cost 1.20 1.20 1.20 Thousand dollars
Utilization 40.00 40.00 40.00 %
Performance 6.00 6.00 6.00 Demand /Sec
Workload 20.00 20.00 20.00 %
Distance 10.00 25.50 35.00 Kilometer
Wasting time 5.00 5.00 5.00 Sec
Capacity 2048 2048 2048 Gb
Idle 2.00 2.00 2.00 Sec
TABLE IV. OUTPUT ITEM
INPUT User1 User2 User3 UNIT
Demand 4.00 16.00 8.00 Gb
Cost 1.00 5.00 2.55 Thousand dollars
Utilization 90.00 50.00 70.00 %
Performance 2.00 1.00 3.00 Demand /Sec
B. Limitation
Here we make an example with . Based on a fair principle of resource allocation, we must minimize the efficiency indicators be a reference to allocate the resources since resource of datacenter is limited. E is means efficiency indicators. It used to decide that the resource from the datacenter user can uses.
Minimize
The used weight of DEA evaluate efficiency which must be a most favorable weight for evaluation units. DEA limit weight of sum must be 1 as following:
The constraint formula of input gets weight of all users from output constraint formula firstly. Next, the efficiency indicator is calculated from the input formula. For each input, we have to provide a constraint let the input of datacenter is equal or lesser than Resource of datacenter:
Input value:
An example by Demand:
Total input item:
T Output constraints must provide a set of weight so that each output are equal or greater than output of users. For each output, we must provide a constraints formula to claim output of datacenter are equal or greater than evaluated users:
Input value:
An example by Demand:
Total input item:
Figure 4. The number of users actually used the cloud system Figure 3. Performance Comparison
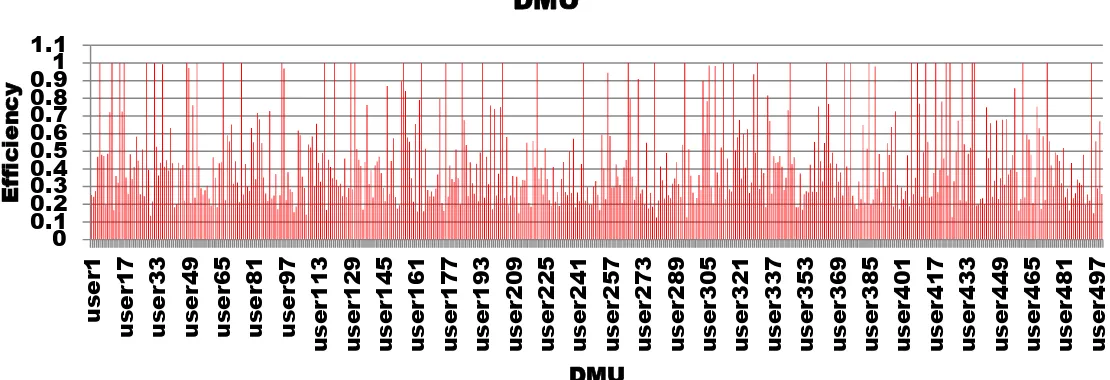
Figure 5. Users phenomenon of dynamic access
0
0.1
0.2
0.3
0.4
0.5
0.6
0.7
0.8
0.9
1
1.1
u
se
r1
u
se
r17
u
se
r33
u
se
r4
9
u
se
r65
u
se
r81
u
se
r97
u
se
r11
3
u
se
r12
9
u
se
r14
5
u
se
r16
1
u
se
r17
7
u
se
r19
3
u
se
r20
9
u
se
r2
2
5
u
se
r24
1
u
se
r25
7
u
se
r27
3
u
se
r28
9
u
se
r30
5
u
se
r32
1
u
se
r33
7
u
se
r35
3
u
se
r36
9
u
se
r38
5
u
se
r4
0
1
u
se
r41
7
u
se
r43
3
u
se
r44
9
u
se
r46
5
u
se
r48
1
u
se
r49
7
E
ff
ic
ie
n
c
y
DMU
DMU
Decision variables IV. EVALUATION
We use DEA-SOLVER Pro5.0 be our evaluation tool [14]. We assume our system environment that there are three users send the requirements to a same datacenter. Table 4 shows the list of detail of users proposed requirements. And the Table 5 list the state of resource in datacenter.
If , the user gets requirement 4.00. If , the user gets requirement greater than 4.00. If , the user gets requirement less than 4.00.
Decision variable (E,w_1,w_2,w_3) has at least one solution.
By characteristics 1, we know ( ) has one solution can mapping to , and so that Minimal will place between 0 and 1.
Figure 3 shows that the relationship between the number of users and performance. In less users case, the non-DEA allocation policy approaches to greedy way. The first user will gets the resource as much as possible. In other words, the datacenter may allocates the resource that based on the upper-bound of first user's requirements if there are enough resources in the resource pool. Late users may lose some opportunities to get more resources. DEA solves this problem through more user information comparison in addition to the only one user case. When the number of users increasing, DEA can consider to more interaction so that the performance of DEA will be relatively stable.
Figure 4 shows that the number of users actually used the cloud system. When number of users are 100 and 200, DEA and non-DEA can average allocate resource to the users since the resources in resource pool are enough. But in 300 or more users case, non-DEA let some users cannot get resource because the resource pool have be filled from the previously several users. However, we can make more precise analysis by DEA. Therefore, we can see that the gap between the DEA line and non-DEA line is Increasing by the growing user number.
Figure 5 shows that the efficiency for every users. Here we give DMU with 500 users randomly. In order to show a dynamic scenario, we let users can freely access the datacenter. Sometimes the efficiency usually between 20% to 60%. Because it is a dynamic behavior of the user's access so that the DEA must continually recalculate. However we can see that some time slot still maintained 100% efficiency. It represents that DEA still has the ability to instantly corrected.
V. CONCLUSION AND DISCUSSION
We use DEA to analyze the various parameters in the cloud resource allocation problem. It can summarize to the most appropriate resource allocation policy so that this cloud system achieve impartial without imbalance. However, this way is too perfect that must used to a running system with several users. It represents that it ignored the initial condition only. But we can still see it as one of the best indicators according to Pareto optimality feature of DEA. In our future work, we will design a more flexible scheme to complete the DEA method as well as approaching the best possible condition from mere DEA.
ACKNOWLEDGMENT
This research was partly funded by the National Science Council of the R.O.C. under grants NSC 101-2221-E-197- 008-MY3.
REFERENCES
[1] Dorian Minarolli, Bernd Freisleben, "Utility-based Resource Allocation for Virtual Machines in Cloud Computing", 2011 IEEE Symposium on Computers and Communications (ISCC), Greece, Page 410-417, 2011. [2] Amit Nathani, Sanjay Chaudhary, Gauray Somani, "Policy based
resource allocation in IaaS cloud", Future Generation Computer Systems, Vol.28, No.1, Page 94-103, January 2012.
[3] Xiaoming Nan, Yifeng He, Ling Guan,"Optimal Resource Allocation for Multimedia Cloud Based on Queuing Model", Multimedia Signal Processing(MMSP), Hangzhou, Page 1-6, Oct. 2011.
[4] Tin-Yu Wu, Chi-Yuan Chen, Ling-Shang Kuo, Wei-Tsong Lee, Han-Chieh Chao, "Cloud-based image processing system with priority-based data distribution mechanism", Computer Communications, Page 1809-1818, 2012.
[5] Jian-Ming Chang, Han-Chieh Chao, Jiann-Liang Chen and Chin-Feng Lai, "An Efficient Service Discovery System for Dual-Stack Cloud File Service, " IEEE Systems Journal, page 1, issue: 99, 2011
[6] Liang Zhou, Han-Chieh Chao, and Athanasios V. Vasilakos, “Joint Forensics-Scheduling Strategy for Delay-Sensitive Multimedia Applications over Heterogeneous Networks,” IEEE Journal on Selected Areas in Communications, Vol. 29, No. 7, pp. 1358-1367, August 2011. [7] Zheng Li, Nenghai Yu, Yang Li, "Asynchronous parallel finite
automation: A new mechanism for deep packet inspection in cloudcomputing", Journa of Internet Technology, vol. 11, no. 2, pp.269 -277, 2010.
[8] Ta Nguyen Binh Duong, Xiaorong Li, Rick Siow Mong Goh, "A Framework for Dynamic Resource Provisioning and Adaptation in IaaS Clouds", 2011 IEEE Third International Conference on Cloud Computing Technology and Science (CloudCom), Washington, USA, Page 312-319, 2011.
[9] Gihun Jung, Kwang Mong Sim,"Agent-based Adaptive Resource Alloc tion on the Cloud Computing Environment", International Conference on Parallel Processing Workshops, Taipei, Page 345-351, 2011.
[10] Jianzhe Tai, Juemin Zhang, Jun Li, Waleed Meleis, Ningfang Mi, "ArA : Adaptive resource allocation for cloud computing environments under bursty workloads", 2011 IEEE 30th International Performance Computing and Communications Conference (IPCCC), Orlando, FL, Page 1-8, 2011.
[11] Golany & Roll, ”An Application Procedure of DEA”, OMEGA, vol. 17(3), Page. 237-250, 1989.
[12] Kamran Rezaie, Abdorrahman Haeri, Mohsen-Sadegh Amalnick, Ayyub Ansarinejad, "Using Augmented DEA to Calculate Efficiency Scores of Organizational Resources", 2011 UkSim 13th International Conference on Computer Modelling and Simulation (UKSim), England, Page 365-369, 2011.
[13] Han-Chieh Chao, C. L. Hung, Tak-Goa Tsuei, "ECVBA traffic-smoothing scheme for VBR media streams", International Journal of Network Management, vol. 12, pp.179 -185 2002.