Activity recognition evaluation via machine
learning
A.N.A. Rameka, A.M. Connor
*and J. Kruse
Auckland University of Technology, Private Bag 92006, Wellesley Street, Auckland 1142, New Zealand.
Abstract
With the proliferation of relatively cheap Internet of Things (IoT) devices, smart environments have been highlighted as an example of how the IoT can make our lives easier. Each of these ‘things’ produces data which can work in unison to react to its users. Machine learning makes use of this data to make inferences about our habits and activities, such as our buying preferences or likely commute destinations. However, this level of human inclusion within the IoT relies on indirect inferences from the usage of these devices or services. Activity recognition is already a widely researched area and could provide a more direct way of including humans within this system. This research explores the feasibility of using a cost effective, unobtrusive, single modality ground-based sensor matrix to track subtle pressure changes to predict user activity, in an effort to assess its ability to act as an intermediary interface between humans and digital systems such as the IoT.
Keywords: Activity Recognition, Machine Learning, Internet of Things, Smart Floors, Smart Chairs, Smart Environments.
Received on 15 October 2019, accepted on 12 November 2019, published on 15 November 2019
Copyright © 2019 A.N.A. Rameka et al., licensed to EAI. This is an open access article distributed under the terms of the Creative Commons Attribution licence (http://creativecommons.org/licenses/by/3.0/), which permits unlimited use, distribution and reproduction in any medium so long as the original work is properly cited.
doi: 10.4108/eai.23-3-2018.161436
1. Introduction
Computerised technology has become an integral part of a modern society, producing an increasingly ubiquitous and pervasive technological infrastructure with an increasing popularity of mobile devices. Despite all these devices with internet connectivity already in use, the Internet of Things (IoT) promises to further envelop the entire globe with additional interconnected devices. Currently, most of the devices consisting of the IoT are used in industrial applications; highly automated systems, smart cities and buildings, as well as manufacturing and supply chain management [1].
The IoT has been described as being connectivity for anyone at any time and place, essentially a new dynamic network of networks [2]. If this IoT definition given by the United Nations is a true description of what the IoT is perceived to be, the IoT cannot be limited to the domain of industrial applications only but must exist in more mundane and common aspects of society as well. For this to occur, it means the inclusion of an entity that is consistently overlooked in IoT discussion; people. As Shin [3] notes, the discussion of the IoT so far has been predominantly focused on technical aspects, such as network development and other general design issues. Even IoT solutions focused on including people, for example the design of products, services, and applications, are often driven by technological opportunities rather than an analysis of the underlying needs [4].
Incorporating people into the IoT requires a modality shift in human and machine interfaces. For example, many current interfaces between humans and the IoT exist in the confines of object interaction, or through a user-interface on a smartphone app. These neglect the implied ubiquity of the IoT and limit accessibility to the potential offered by large numbers of interconnected devices.
Furthermore, these interfaces do not address the invisibility and subsequent era of automation and autonomy that the IoT will facilitate. In fact, it is suggested that interfaces which demand our attention and time are simply ‘digital chores’ which have to be attended to [5]. Rather, what is required to achieve an automated and autonomous future is an interface that alleviates the need for conscious interaction. Therefore, it seems necessary that the interface between humans and the IoT should be created with the same attributes that define the IoT; invisibility, ubiquity, autonomy, and communication. The research outlined in this paper is motivated by an interest to explore the efficacy of such an interface, namely by designing and implementing a single-modality ground-based activity recognition sensor that considers the findings of relevant literature in its iterative development. Arguably, this goal is directed towards the concept of ambient systems which are populated by autonomous devices interconnected to one another that supply a variety of functionality that is eventually used by
the users [6]. To that end, whilst the research in this paper is focused on the evaluation of a specific, ground based interface, the possibility of interaction with other devices should not be ignored. In this case, by recognising human activities at a desk it is possible to trigger other devices that can respond to the human’s actions within a specific environment facilitated by the IoT.
This paper is structured as follows. Section 2 provide an overview of related research that has informed this work. Section 3 described the physical environment used in the evaluation and section 4 outlines the machine learning approaches used in this study. Section 5
2. Background and Related Work
There is an ever evolving attempt to define the IoT, the definition given by Atzori et al. [7] in its current iteration is that it leverages the availability of interconnected, heterogeneous devices and augmented physical objects to provide shared information on potentially a global scale.
The IoT shares concepts with existing technological frameworks, and this adds to the difficulty in understanding the IoT paradigm [7]. The underlying technologies include RFID platforms, pervasive computing platforms, cyber-physical systems, sensor networks and M2M systems. One of the most obvious features that converge amongst these technologies is that of pervasiveness. In this terminology, no longer are the computerized technologies of tomorrow limited to the currently set of screens, tablets or phones.
Mark Weiser [8] anticipated the ubiquity of modern technology with the observation that the most profound technologies are those that are invisible and woven in to the fabric of everyday life in such a way that they become part of everyday life. Weiser argues that the apparent invisibility of technology is a fundamental consequence of human psychology rather than a property of the technology itself [8]. Whenever people become sufficiently accustomed to something then they cease to be aware of it on a conscious level.
Therefore, truly ubiquitous computing means more than being physically invisible or unseen, but more importantly can be interacted with unconsciously [9]. Satyanarayanan discusses complete and literal invisibility by introducing the concept of minimal user distraction [10], arguing that a pervasive computing environment needs to continuously meets user expectations to allow them to interact with the technology almost at a subconscious level.
of biological agents within this digital system along with all this entails.
There have been numerous studies highlighting the need and recognition of the human importance within the IoT [11-13]. Atzori et al. [7] noted the importance saying “Particular attention has to be paid to the design of effective (better if “intelligent”) interfaces both between humans and things and between things” (p. 135). One way in which to create a harmonious intermediary is to provide an interface to a technological system or service, such as the IoT using a surface that everyone interacts with naturally during their daily activities. Cheng, Sundholm, Zhou, Hirsch, & Lukowicz [14] suggest that the vast majority of human activities are associated with certain types of surface contact and therefore, it seems logical that a floors role of being a potential interface to smarter environments and the IoT is researched thoroughly. Before the turn of the century in 1997, the idea of incorporating technology into floor systems using piezoelectric wires [15] and pressure sensitive tiles [16] were proposed. Both were fundamentally limited to the current technologies’ capabilities, and though some of the principles remain relevant, investigation of newer approaches is needed.
More recent research has investigated smart floors in applications ranging from entertainment [17], to elderly healthcare and monitoring [18], mental health [19], identification and tracking [20], indoor navigation [21], as well as uses as a non-human interface for robots [22] and livestock [23]. Others have looked at the intricacies of human anatomy, and in particular the feet, in regard to human computer interaction [24].
A lot of this work is aimed at identifying users based on gait pattern recognition, for example Chang et al. [17] have used a solution that involves LCD panels on the floor, LED lights and multiple pressure sensors within a steel-frame. However, such fabricated solutions requiring bespoke structural flooring elements would not seem to be an eloquent or viable option for a ubiquitous smart solution, although it must be acknowledged that their application was aimed at engaging entertainment and therefore necessitated a display, differing from being simply a surface interface. Other implementations involve invasive and expensive multi-camera systems in conjunction with simple floor sensors to enable location services [25]. A similar concept using glass panels and optical interface such as the GravitySpace tracking system [26] have the same inhibiting features of being expensive, unsuitable as a floor used in everyday activities, and the use of cameras being viewed as invasive by users.
There is also an implementation using multiple RFID tags being placed underneath ceramic floor tiles, with RFID scanners placed in peoples shoes [27]. While cheaper than some implementations, requiring people to alter their wardrobe or wear special equipment to allow them to participate in a smart environment is not an efficient solution considering the paradigms of the IoT, ambient intelligence, and the accompanying ubiquity and
invisibility, as the same functionality could be used by tracking smartphone movement.
Al-Naimi & Wong [20] summarise the current paradigms of smart floors across three categories:
1. Tagged tracking including Radio frequency, Ultrasonic, Infrared based approaches.
2. Non-tagged tracking including smart floor, machine vision, and wireless distributed Pyroelectric Infrared sensor (PIR) approaches.
3. Multimodal tracking including machine vision with laser scanners, smart floor with machine vision, and smart floor with Radio Frequency Identification (RFID) approaches
It is easily argued that an everyday smart floor concept may require as little deviation from the current, non-smart flooring systems as possible. Taking into account inclusivity, cost, simplicity, and ubiquity, it can be further argued that non-tagged tracking architectures are mostly likely to appropriate as a floor based interface between humans and the IoT. Multimodal approaches offer greater precision but also suffer from increased complexity and higher costs [20]. Including visual elements into a multimodal approach challenges user preference and inhabitant's privacy are known to be the main weaknesses in combining tagged based approaches and machine vision [20]. In light of this, the research described in this paper places emphasis on non-tagged architectures.
Mozer [28] proposed the idea of a sensor-based home environment that would recognize the activities of its inhabitants and adapt accordingly. In such a context, activity recognition could aim to recognize common human activities in real-life settings which facilitates a range of societal and individual benefits [29].
Some of the benefits of activity recognition have been identified in the objectives of various research, ranging from energy efficiency in buildings [30] to patient rehabilitation [31]. Klack, Möllering, Ziefle, & Schmitz-Rode [32] used piezoelectric sensors embedded in the floor to monitor the elderly and their movement, and from this deduce any abnormal activity that may be occurring, indicating the possible need for assistance.
However, the task of accurate activity recognition is challenging because human activity is complex and highly diverse [29] and numerous approaches have been investigated [33-36] including a variety of smart chair [37, 38] and cushion [39, 40] options. Despite the challenges, the objectives of activity recognition in relation to smart floor architectures have all been achieved to varying degrees.
literature, especially when analysing whole body or limb movement to recognise activity. Additionally, there are few solutions that embrace the principles of the IoT to allow the smart floor to potentially interact with other objects.
In regard to the importance of activity recognition in IoT and smart environments it has been noted that how users interact with the IoT-based home environment is critical in developing context-aware smart homes. Because of this, activity recognition becomes the an essential inference mechanism for IoT-based context-aware smart homes [53].
Interestingly, before the notion of the IoT and ambient systems developed momentum, researchers were already looking at the implications of tagged objects within an environment being an indicator of human activity. Tapia, Intille, & Larson, [54] highlight the efficiency of this method by saying that activity recognition can be thought of how people move things as opposed to how people move. However, a system relying on analysis of object and human interaction to recognise human activity may be more suitable in a multimodal approach, alleviating any deficiency in the activity recognition system due to the absence of human and object interaction, but allowing more accuracy in recognition of certain activities where objects are involved.
This only promotes the importance of a more general and inclusive system, such as a smart floor, where object use is arbitrary to successful activity recognition, and where all interaction, whether indirectly or directly, involve the ground due to gravity as some parts of the body need to be in contact with a supporting surface [14] and through additional objects the ground.
A smart floor, acting as an interface between humans and the IoT though, would leverage this and have the ability to identify, track, and recognise human activity. Importantly the development and suitability of a smart floor in activity recognition needs to take into accoun inherent unique features including transparency, reliability, durability and multitasking [52].
In this regard, activity recognition through a singular modality smart floor can be achieved by analysing the vibrations, changes in centre of gravity and balance shifts that propagate throughout the body, which in turn influences the pressure distribution of the bottom of the feet on the ground [14].
As a result of the literature in this area, it can be argued that that a ground-based interface can be considered a suitable candidate for a human IoT interface and that activity recognition is a vital extension in providing digitisation of biological, analogue mechanics via the ground-based interface, allowing the required interface for humans in the IoT.
3. Evaluation Scenario
This work involved the development of a ground-based sensor with the ability to be utilised in activity
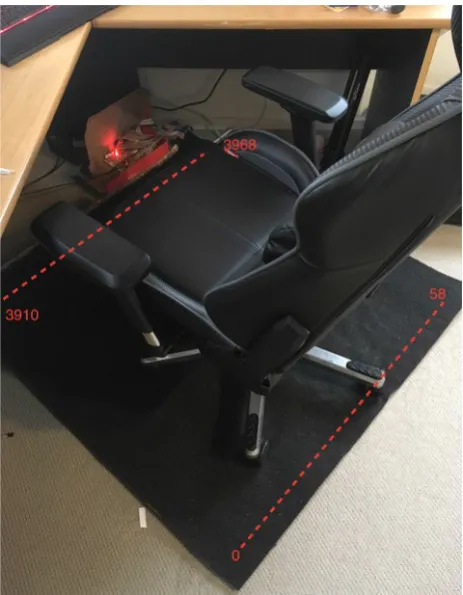
recognition. The development process involved several iterations of practical experimentation resulting in a final system with the potential to identify activities within a specific scenario. This is shown in Figure 1.
Figure 1. Sensor placed underneath chair
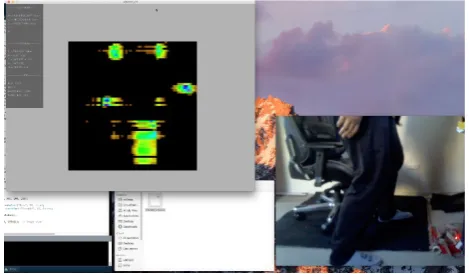
Figure 2. Example of pressure map produced by the system with associated physical interaction inset
The use case for evaluation is that of a typical office environment. No generalisations are intended to be discovered that would have application in multiple environments. However, the use-case should in theory provide an insight into the suitability for such an artefact in other environments, though not yet fully addressing it’s potential to interact with other objects through the IoT. As such, and according to the restrictions described in the previous section regarding some factors of IoT usability, an office environment which features no extra peripherals other than the artefact itself are permitted. This adheres to the notion of invisibility and pervasiveness previously discussed. Considering these aspects have led to the assumption that a floor based sensory system would be the most appropriate approach.
The decision to use this approach is also influenced by the need for the artefact to not inhibit normal human motion or activity. In the given scenario of an office environment, on average approximately 75% of the time spent in the workplace office involves sitting at a desk, typically in front of a computer [55]. As evidenced in the literature review, most activity tracking approaches tend to involve spatial tracking, where variation in location are easier to define. However, this type of tracking would not be suitable in the given scenario where most of the time is spent in one general location. Indeed, some differentiate between two types of recognition; activity recognition involving high-level, possibly multi-user tasks; and secondly involving a single-user performing a single task [56, 57] while others create yet more rubrics from which to define classes of activity recognition [58].
According to these definitions then, the artefact in this research would be more aligned to action recognition and atomic actions within the restricted environment. However, in the current use-case of this research, it is not important to differentiate between the terms as may be the need in larger environments, as no perceived large spatial movements are being assessed. Furthermore, while it may be useful in disseminating literature, it would be irrational to disregard the relevant knowledge within implementations simply because of the various use of
terminology, as most seem to use the terminology interchangeably [59].
Accompanying the premise that the majority of time being spent in an office workplace is seated in front of a desk, activity recognition in this scenario using a ground-based sensor would have to accommodate indirect contact, typically through a chair. As discussed in the literature review, there are examples of a ground-based activity recognition sensors, and those with sensors implemented in the chair, yet indirect examples are rare. Therefore, in this use-case, the ability to infer human activity indirectly is of interest and contributes to the knowledgebase within activity recognition.
The use-case has also influenced the choice of activities that are to be recognised. Since the physical dimensions of the ground sensor are of an appropriate size for an office desk and chair setting at slightly larger than on square meter, only single user activities are researched in this paper. While multi-user implementations are important, within the given scenario these situations are less likely to be occur. This does not negate that larger scale implementations would need to accommodate multi-user environments and high level activities but are not covered as they are beyond the scope of this paper.
Given that single-user activities are being assessed within a small space and based on a general observation made, the types of activities for recognition are as follows:
• Neutral (N)– Sitting upright on the chair • Relaxed (X) – Leaning back on the chair
• Typing (T) – Using the computer keyboard with two hands while seated
• Mouse (M) – Using the mouse of the computer (right hand only) while seated
• Left (L) – Any activity that requires the user to interact to the left of the keyboard
• Right (R) – Any activity that requires the user to interact to the right of the keyboard
• Stand (S) – The user is no longer seated but still within the sensors space
• Away (A) – The user is no longer in the space
It is important to note that these actives are mutually exclusive and do not account for all activities observed in this environment. However, these have been selected because they offer the potential for identifying when a person may act in a way that might be indicative of interaction with other IoT enabled objects. For example, a transition from sitting to standing could be used to change the lighting in an environment. Similarly, being away might be used to trigger other devices to enter a low power standby mode.
environment (e.g. talking on the phone) could be inferred, and thus result in increased and consistent function both in environment and recognition mutability. Otherwise, these actions were also chosen to represent a different range of variance between expected sensor readings, from spatially similar actions (e.g. mouse and keyboard use) and spatially distinct actions (e.g. left and right).
4. Classifier Selection
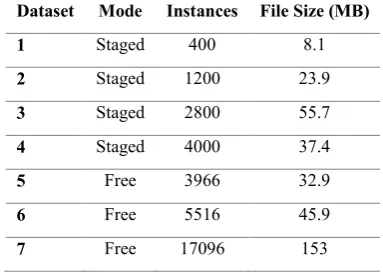
There are two categories of data collected from the sensor. The first, staged mode data, contains an equal number of occurrence of instances for each of the activities identified in the previous section. The second type of data is free mode data, with variance between the number of occurrences between activities, mimicking real-world scenarios e.g. where a user may be using the mouse more than relaxing over a period of time. Also, instance numbers between datasets vary while the feature vectors for these instances is constant and equal the number of electrodes in the sensor. Analysis of the datasets is initially undertaken in WEKA to select appropriate algorithms for classification. Many different datasets were created (>100) and from these, seven were chosen as being representative of the majority of the datasets, based on capture mode, instances, and file size.
The use of multiple datasets with various algorithms is to ensure completeness in evaluation. The variation between instance totals was used to evaluate algorithm accuracy under differing scenarios. This is important as part of an activity recognition sensor in real-world scenarios. For example, if computation for activity recognition classification in a real-world implementation is done via an embedded solution, energy, computational and storage limitations dominate performance evaluation, effecting such things as model complexity, data storage availability, and classification latency.
However, if classification modelling and classification itself are performed remotely by more powerful computing systems, then data transferal latency becomes a bigger issue. As can be seen in Table 1, despite containing more instances dataset four has reduced in file size compared to dataset three because of consideration of these limitations. Since the machine learning algorithm for activity recognition in this artefact is decoupled from the sensor itself and does not assume suitability of any particular algorithm (apart from those suitable for classification), different scenarios can be evaluated to predict the best routes for future research given both lab and real-world implementations.
Table 1. Overview of the seven datasets
Dataset Mode Instances File Size (MB)
1 Staged 400 8.1
2 Staged 1200 23.9
3 Staged 2800 55.7
4 Staged 4000 37.4
5 Free 3966 32.9
6 Free 5516 45.9
7 Free 17096 153
While not an exhaustive analysis of the data or suitable algorithms, there are some general aspects of the data to note. The first aspect that is apparent is the sparse vector representation, with many of the nodes always 0, indicating they never have any pressure on them at all. This means, when combined with the high feature space, any chosen algorithm would benefit from feature selection or should use dimensionality reduction to improve accuracy if manual data pre-processing is to be avoided. In this regard, a decision tree or a related ensemble approach may be useful. Furthermore, in the staged mode data sets there are obvious clusters formed within data points of the same class. Therefore, since the data is linearly separable, a linear classifier such as Naïve Bayes may provide good accuracy. However, this same attribute is not so well-defined in the recording mode, as transitions between activities cause more variation in vector values. Therefore, a Support Vector Machine capable of handling non-linearity in the data may be more useful in this regard. On the basis of this evaluation, these three approaches are considered as candidates for further investigation.
4.1. J48 Decision Trees
The J48 algorithm has been used extensively in a wide range of research applications, including analysing e-governance data [61], mining software repositories [62], predicting fish stocks [63] and fault analysis [64] to name but a few. In general, decision trees are considered simple and fast to implement, given that they formulate the most important features of the data automatically during the search for highest information gain. However, they can also be problematic in overfitting, where models fit the training data so precisely that new data highlights any inflexibility in the model. This overfitting is exaggerated with the tree complexity. As each dataset in this research contains over 3000 different attributes (each electrode) for each instance (with some datasets with over 10,000 instances), tree depth is likely to be large increasing overfitting. This could present itself as an issue in realising a more general model applicable across unseen datasets, which would be the case in real-world implementations of an activity recognition sensor. Furthermore, assuming the decision tree uses a greedy approach to choosing optimal nodes, optimal local choices are guaranteed. Ignorance of the rest of the tree, however, means that the local optimum may not be the best choice globally, and can lead to suboptimum decision trees, and in some cases the worst possible solution in relation to tree depth, requiring techniques such as tree pruning to resolve these issues [65]. However, as an indicator of the sensors appropriateness in relation to linearity, drift, hysteresis, homogeneity, and repeatability, testing with a decision tree should allow some of these important elements of any sensor to be explored and will be discussed later (Giovanelli & Farella, 2016).
4.2. Random Forest
Random forests is an ensemble machine learning method using decision trees, first implemented by Tin Kam Ho and extended by Leo Breiman and Adele Cutler [66]. Random forests, as the name suggests, uses multiple decision trees created from a differing random subsample of the training data. Classification of a new data point happens independently on each tree, with each tree predicting the appropriate class. Assuming a majority vote, the class predicted by the majority of trees for the data point is chosen as the prediction.
Further, while there are implementations of decision tree models that grow with the introduction of new data, online random forests enable easier inclusion of new data into the model by having the ability to generate new decision trees with subsets of training data that include these new data points [67]. Decision trees that are underperforming and classifying consistently far from the majority could also be dropped. These aspects strengthen the ability for the classifier to evolve and would be an important aspect in long-term activity recognition installations. However, creating multiple decision tree instances obviously adds to the compute time required for model creation.
Beside this, the core benefit of using Random Forest classification instead of a single decision tree is to prevent the overfitting problem mentioned above, creating a more general model and increasing accuracy in unseen data [66]. The Random Forest approach has been applied to a range of application areas, including gene selection [68], remote sensing [69] and land cover classification [70].
For the data in this research, this approach will aid in realisation of a more general model that may help in real world applications of an activity recognition sensor and is tested to show any improvement against single decision tree models.
4.3. Naïve Bayes
Naïve Bayes, based on the Bayes’ theorem named after Thomas Bayes, is a probabilistic classifier used in machine learning. Because it is a class conditional independent algorithm, it assumes that the occurrence of a feature is independent of the occurrences of other features and does not consider any correlation between features, therefore naive. [71]. This is done by calculating class probabilities and conditional probabilities, or the frequency of each feature value for a given class value, divided by the frequency of instances with that class as the value. However, the feature values in this research are numerical and thus continuous, where traditional Naïve Bayes algorithms expects categorical values. Because WEKA is being used to implement these algorithms, it is important to note that a Gaussian distribution is assumed for numerical attributes by default. Otherwise, converting numerical attributes to nominal attributes can be achieved via supervised discretization, among others.
Implementing this algorithm to allow for continuous data has its disadvantages though. For example, when using supervised discretization, information from the data can be lost as values are “binned”. This same issue is also apparent in decision trees too. Furthermore, the assumption that the data follows a Gaussian distribution may be erroneous, however there is allowance for non-Gaussian distribution among features values using a kernel estimator among others. Knowledge of the data distribution is key in ensuring appropriate use of the Naïve Bayes algorithm. The Naïve Bayes algorithm is also widely utilised, with many applications including heart disease prediction [72], text classification [73] and location prediction [74].
other algorithms, meaning training data size can be smaller than other algorithms and model creation is rapid. It also tends to have an advantage over other algorithms when the number of classes is large, and while the datasets here only have a small number of classes, a real-world implementation where many different activities are possible would need to accommodate for this.
4.4. Support Vector Machines
An algorithm that may prove useful in evaluation of AR capabilities of the sensor, as well as its difference in approach from the other algorithms mentioned, is Support Vector Machines. Unlike the probabilistic method of Naïve Bayes, Support Vector machine (SVM) are a non-probabilistic linear classification algorithm that uses regression to form boundaries between data points. This boundary indicates the separation between one class and another. SVM create this boundary by simply selecting a few of the data points (support vectors) for defining boundaries of classes (or hyperplanes in higher dimensions) and proceeds to find the boundary that fits with the highest margin between the points of different class. Traditionally, this is a linear boundary. However, kernel manipulation can create boundaries (or hyperplanes) that are non-linear, and able to fit more complex data with high dimensionality making it very versatile, although choosing the appropriate kernel function is not always clear. This flexibility also bodes well for datasets that cannot be linearly separated, which is typically evident among the real-world datasets. There are other benefits too. Unlike Naïve Bayes which makes distribution assumptions, SVM is likely to be beneficial when data does not follow a Gaussian distribution. Unlike decision trees, SVM is resilient to overfitting because the dependence is only on the support vectors to calculate the boundaries rather than every data point. This also entails efficient memory usage, especially in larger datasets. It does have its disadvantages though. As well as needing an appropriate kernel function choice, large data sets can mean training of the model takes longer than other algorithms.
As with other ML algorithms, the SVM is widely used in a diverse set of application areas that include, but are not limited to, face detection [75], fault diagnosis [76] and cooling load prediction [77].
It should be noted that the default mechanism for implementing SVM in WEKA is via John Platt’s sequential minimal optimization algorithm (SMO). The following therefore applies: replaces missing values; nominal attributes are transformed into binary attributes; attributes are normalized; multi-class datasets are classified using pairwise classification.
5. Results
This section will detail the results of executing the machine learning algorithms given the specific dataset. Again, this is not a comprehensive evaluation of all algorithms, but rather an insight into suitable algorithms for AR given specific types of data with respect to IoT applications. WEKA allows an efficient way of comparing algorithms, and unless otherwise stated, the default settings of WEKA in this regard are used. There is also no attempt to compare the solutions from the algorithms, though this valuable exercise will be undertaken in future work.
5.1. Accuracy
Each of the staged and free datasets are evaluated using a randomized training set and test set split of 60% and 40% respectively. Each evaluation is completed ten times per algorithm per dataset. For the results that follow, the first four rows relate to the staged mode datasets (1 – 4), with free mode datasets visible in the last three rows (6 - 7), unless otherwise stated. Table 2 presents results for classification accuracy
Table 2. Percentage correctly classified with a significance level of 0.001 (two-tailed confidence
level of 99.9%)
Dataset J48 Random
Forest Bayes Naïve SVM
1 99.88 100.00 100.00 100.00
2 99.79 100.00 100.00 100.00
3 99.78 100.00 99.67 100.00
4 99.18 99.90 97.13 99.99
5 95.23 98.04 54.47 97.88
6 95.68 98.11 53.62 97.50
7 94.81 97.12 35.30 97.14
All algorithms performed well where frequency of instances across the classes were identical (staged mode), with no significance difference in correct classifications among the smaller datasets. Whilst the performance of the algorithms given different training or test sets is not presented in this paper, generally there is little variation in performance for different classification scenarios.
Referring to the comparison in Table 2 which shows there is no significant difference between algorithms on lower instance datasets, there is a significant difference in correct classification among the free mode datasets consisting of more instances. Both Random Forest and SVM outperform J48 with this type of dataset. However, there is no significant difference between the Random Forest and SVM in accuracy.
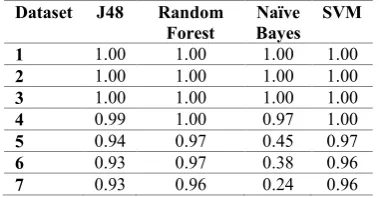
Because this is a multi-class classification problem and class balance needs to be taken into account, the Kappa metric reflects very good performance in most cases against random classification as shown in Table 3. Here, almost all algorithms have very high kappa values > 0.93 regardless of the dataset.
Table 3. Kappa statistic for each algorithm across all datasets when using a two-tailed significance of
0.001 and 10-fold cross-validation
Dataset J48 Random
Forest Bayes Naïve SVM
1 1.00 1.00 1.00 1.00
2 1.00 1.00 1.00 1.00
3 1.00 1.00 1.00 1.00
4 0.99 1.00 0.97 1.00
5 0.94 0.97 0.45 0.97
6 0.93 0.97 0.38 0.96
7 0.93 0.96 0.24 0.96
However, this is not true for Naïve Bayes and the free mode datasets. Interestingly with the free mode datasets, Naïve Bayes kappa metric ranges from 0.45, 0.38, to 0.24 respectively as instance numbers increase. Accuracy drops dramatically to below 54% for the free mode dataset, despite having less instances then the largest staged mode dataset where it correctly classified 97.13% instances. This makes Naïve Bayes by far the worst performing algorithm in real-world cases due to the nature of the free mode data. Furthermore, it begins to incorrectly classify at a faster rate than the others with a lower Kappa value across four of the datasets. These values are probably due to the Gaussian distribution assumption used as the default in WEKA for continuous features.
Further investigation using supervised discretization shows that Naïve Bayes is able to correctly classify significantly better, achieving almost 79.57% for correct classification of dataset 5 and 75.60% for dataset 7, a dramatic improvement from the Gaussian implementation of 54.66% and 35.90% respectively, as shown in Table 4 and Table 5. In both cases, the use of supervised discretization produces lower values for mean absolute error (MAE) and root mean squared error (RMSE).
Table 4. Comparison of Gaussian and Supervised Discretization Naïve Bayes with dataset 5
Distribution Kappa MAE RMSE Correctly classified
(%) Gaussian 0.4506 0.1132 0.3364 54.6658 Supervised
Discretization 0.7476 0.0512 0.2255 79.57
Table 5. Comparison of Gaussian and Supervised Discretization Naïve Bayes with dataset 7
Distribution Kappa MAE RMSE Correctly classified
(%) Gaussian 0.2362 0.1615 0.4019 35.905 Supervised
Discretization 0.6879 0.061 0.2466 75.6069
Table 6 shows the confusion matrix that arises from applying Naïve Bayes with supervised discretization to the most complex dataset, using the activity labels from section 3. A total of 6837 instances were used as test data, with the remaining instances being used as a training set. Even with supervised discretization, it is clear Naïve Bayes does still not perform as well as the others in classification, and specifically is struggling to distinguish between neutral (N), relaxing (X), typing (T) and mouse (M).
Table 6. Confusion matrix for Supervised Discretization Naïve Bayes using dataset 7
N X T M L R S A
N 1407 22 117 144 174 0 44 0 X 42 1088 93 28 43 70 7 0
T 0 0 906 127 0 0 0 0
M 220 7 444 1445 51 14 0 0
L 1 2 2 2 81 0 0 0
R 0 0 0 0 0 35 0 0
S 0 0 0 0 0 0 69 11
A 0 0 0 0 0 0 2 139
For a few classes there is a high recall value but with low precision, indicating that while it may be identifying the majority of true positive cases correctly but also including false positive results too as it assumes a wide distribution of data points.
5.2. Efficiency
real-time activity recognition and embedded solutions, or alternatively remote computation, there is a need to assess algorithms performance on training time, classification time, CPU usage, and model size. Using the 10-fold evaluation results, WEKA provides some metrics that enable this analysis. This is also not a statistical analysis of the metrics here, but rather a general observation of the values to guide further investigative work in the future.
Time taken to train the model is important to consider. Depending on the strategy, model training time may be insignificant if is only done sporadically. For the given scenario, for example, data acquisition could be consistently active during the day as activity recognition occurs, with models updated overnight while the workplace is empty and used in the consecutive days.
For other scenarios, however, where online model training is done for constant improvement during the day, the time taken to compute the models becomes a bigger factor. This is not meant to be an indicator of the actual time it would take an algorithm to perform classification, as this is too dependent on hardware configuration and algorithm implementation. Rather, it is valuable in comparing the algorithms with each other in relation to accuracy, and helpful in establishing the use of an appropriate algorithm given factor other than accuracy only.
The time taken to train each algorithm, indicated by the CPU time spent during training, are shown in Table 7.
Table 7. Comparison of CPU time (seconds) taken for model training
Dataset J48 Random Forest Naïve Bayes SVM
1 0.22 0.17 0.14 0.13
2 1.36 0.38 0.65 0.45
3 4.01 1.18 2.95 1.24
4 8.42 1.97 4.84 1.99
5 13.81 6.23 3.88 7.32
6 36.85 9.14 5.30 29.52
7 274.68 27.00 28.64 420.41
These results may seem comparatively insignificant considering that the slowest training of a model took only 420 seconds. However, this needs to be considered in terms of two aspects. The first is hardware capability, as these results were completed on a high clock-speed, high-core count water-cooled computer system. While remote model training, such as those completed here would cope with the variance shown in training time, an enclosed energy efficient embedded system without this computing power (and preferred in some IoT applications) would be orders of magnitude slower. Furthermore, this data has been collected from a single user in approximately a square meter of space. If a larger installation covering hundreds of square meters, with possibly hundreds of users simultaneously creating data (the essence of the IoT being available to anyone, anywhere) then this disparity in
training time becomes increasingly important as data exponentially grows. This is without considering that only are limited range of activities are accounted for in this testing when there are possibly hundreds or thousands of activities that could be implemented. In the context of this research, the difference between Random Forest and SVM for the largest dataset is greater than 15 times slower, which is not significant at datasets of this scale, but could be in real-world applications. Thus, it is the comparison to each other that is being considered here, rather than just the actual CPU time spent training.
It is fairly obvious that time spent increases as the datasets become larger, and as complexity of the data increases from staged mode data to free mode data. Interestingly, this is not necessarily true for Naïve Bayes, where training time increases seemed only to correspond with instance numbers, as seen in the decrease of training time of the smallest free mode dataset and the largest staged mode dataset. This is apparent too in the free mode datasets, where Naïve Bayes was comparatively fast at training in two of three datasets, and only slightly slower for the largest dataset.
However, it must be remembered that there was a marked drop in accuracy between data modes, and while it was the worst performing algorithm overall for accuracy, on the smallest staged mode data where accuracy among the algorithms was similar, it is a very fast algorithm to train being only slightly slower than the SVM. It is important to consider that at this low instance number Naïve Bayes could potentially outperform the other algorithms when training time is included as a metric for performance. However, in future work where more activities are to be classified, datasets are only likely to grow larger rather than smaller, and so the performance of algorithms on these smaller datasets may be irrelevant and is another factor in consideration of the importance of training time.
As well as training time, an evaluation of efficiency should also cover the time required to apply the classifier. Again, this is not an in-depth analysis but provides a good observation of the values in comparison to each of the algorithms. Of further note is that the values given indicate the length of testing all instances in the dataset, not per-instance, meaning classification of a single instance would be faster than those shown. However, it is the comparative values that are being discussed here rather than the actual values, as these are too hardware and dataset dependant to provide any generalization about classification performance. The results are shown in Table 8.
Table 8. Comparison of CPU time (seconds) taken for classification
Dataset J48 Random Forest Naïve Bayes SVM
1 0.00 0.00 0.09 0.00
3 0.00 0.01 0.62 0.04
4 0.00 0.01 0.89 0.07
5 0.00 0.03 0.88 0.05
6 0.00 0.04 1.22 0.07
7 0.01 0.10 3.87 0.36
It is evident that J48 decision trees are by far the fastest algorithm in testing, followed by Random Forest, SVC, and Naïve Bayes. Decision trees being the fastest algorithm for classification is unsurprising in optimally sized trees, where classification is but a simple choice of a path. Likewise, Random Forest using the same procedure, but having some extra steps, such as the majority vote, means it is unsurprisingly efficient in classifying a new instance too. Naïve Bayes, while very fast at training compared with the other models, is much slower than the others at classifying. As seen with the improvements possible in testing time with SVM, it still lags slightly behind both of these. Therefore, when considering classification time, especially if data transferal latency for remote computation is to be considered, a decision tree-based implementation seems the most efficient. However, most approaches other than Naïve Bayes offer sufficient potential to classify activities in real time.
Another metric that should be considered is model size. This is particularly of interest with an embedded implementation, which may become relevant in a true IoT implementation. Such an implementation would have lower computational capability which may exacerbate slow training and classification times as discussed earlier, but will also be affected by storage limitations. Results in Table 9 show the serialized model size.
Table 9. Model size (Java Serialized Objects) of each algorithm and dataset
Dataset J48 Random
Forest Bayes Naïve SVM 1 204565.0 355692.7 2987017.5 856795.2 2 204565.0 494114.9 3093029.3 803025.0 3 204565.0 801807.9 3548124.3 881950.2 4 207102.8 1026173.3 3821126.5 980416.2 5 240443.6 5199984.2 2881481.2 707916.2 6 247750.0 6359232.3 2796980.0 657036.2 7 364325.0 17227015.2 4526798.9 1090934.4
It is evidently clear that J48 decision trees consistently create the smallest model regardless of the dataset type or size. However, for the Random Forest approach, each training model size gets larger with size, and there is a marked increase in model size between the two different types of data, with an enormous model for the larger dataset in comparison to the other models. Naïve Bayes rather interestingly starts with a much larger model that the other algorithms in the smaller datasets, but more or less remains around this size and even decreases for the smaller free mode dataset that consists of more instances, increasing in size for the largest dataset. After Naïve
Bayes, SVC has the largest model for the smaller datasets, shrinking for the first few free mode datasets, and increasing for the last.
Therefore, if model size is a factor in assessing algorithm suitability and assuming free mode type of datasets in a real-world implementation, a decision tree or SVM implementation may be an optimal solution.
6. Conclusions
In relation to an activity recognition sensor acting as an interface to the IoT, machine learning is an important component of the system, and accuracy of classification is the most important metric to consider in machine learning. Without accurate classification, it would not be performing its main objective, making discussion of the other metrics futile.
However, selecting the correct algorithm based on accuracy is dependent on the datasets. Assuming a real-world implementation with moderately sized datasets and averaging accuracy performance on the free mode datasets, then of the algorithms tested the Random Forest (98.25%) or SVM (97.92%) approach is best, followed closely in performance by a J48 decision tree (96.09%). Naïve Bayes (77.29%) is much lower than these other algorithms even after limited tuning.
Considering the other metrics in relation to free mode datasets, however, show that Naïve Bayes averaged 12.61 seconds to train, while Random Forests took only slightly longer at 14.12 seconds on average. J48 decision trees averaged 108.45 seconds, while SVM took the longest at 152.42 seconds. For both J48 and SVM, as the instance numbers increased, the training time needed also increased dramatically, distorting these averages, and while Naïve Bayes and Random Forests training time did increase too, the increase in time to train was more linear. If considering this metric in correlation with the accuracy, a Random Forest approach may seem to be the optimal choice.
of hardware or real-time classification problem, model size is less of a concern. However, considering the large variation between the serialized model size of each algorithm, it is important component for any future investigation. It showed that while a Random Forest approach is one of the better algorithms in accuracy and time taken for training and classification, the models produced are relatively large in comparison, possibly having consequences for embedded implementations or where hardware restrictions exist.
References
[1] DA XU, L., HE, W., and LI, S. (2014) Internet of things in industries: A survey. IEEE Transactions on Industrial Informatics10(4): 2233–2243.
[2] STRATEGY, ITU, UNIT, and POLICY (2005) ITU Internet Reports 2005: The internet of things. Geneva: International Telecommunication Union (ITU).
[3] SHIN, D. (2014) A socio-technical framework for Internet-of-Things design: A human-centered design for the Internet of Things. Telematics and Informatics 31: 519-531.
[4] SALIM, F. and HAQUE, U. (2015) Urban computing in the wild: A survey on large scale participation and citizen engagement with ubiquitous computing, cyber physical systems, and Internet of Things. International Journal of Human - Computer Studies81: 31-48.
[5] KRISHNA, G. (2015) The best interface is no interface: The simple path to brilliant technology, (Pearson: London). [6] BELLIS, S.J., DELANEY, K., O'FLYNN, B., BARTON, J., RAZEEB, K.M., and O'MATHUNA, C. (2005) Development of field programmable modular wireless sensor network nodes for ambient systems. Computer Communications28(13): 1531-1544.
[7] ATZORI, L., IERA, A., and MORABITO, G. (2017) Understanding the Internet of Things: definition, potentials, and societal role of a fast evolving paradigm.Ad Hoc Networks56(Supplement C): 122-140.
[8] WEISER, M. (1991) The Computer for the 21st Century. Scientific American265(3): 94.
[9] BARBOSA, J.L.V. (2015) Ubiquitous computing: Applications and research opportunities. In Proceedings of the 2015 IEEE International Conference on Computational Intelligence and Computing Research (ICCIC), 2015/12 1-8
[10] SATYANARAYANAN, M. (2001) Pervasive computing: vision and challenges. IEEE Personal Communications
8(4): 10-17.
[11] FAUQUEX, M., GOYAL, S., EVEQUOZ, F., and BOCCHI, Y. (2015) Creating people-aware IoT applications by combining design thinking and user-centered design methods. In Proceedings of the 2nd IEEE World Forum on Internet of Things (WF-IoT), 2015/12 57-62
[12] NAZARI SHIREHJINI, A.A. and SEMSAR, A. (2017) Human interaction with IoT-based smart environments. Multimedia Tools and Applications76(11): 13343-13365. [13] NUAMAH, J. and SEONG, Y. (2017) Human machine
interface in the Internet of Things (IoT). In Proceedings of the 12th System of Systems Engineering Conference (SoSE), 2017/06 1-6
[14] CHENG, J., SUNDHOLM, M., ZHOU, B., HIRSCH, M., and LUKOWICZ, P. (2016) Smart-surface: Large scale textile pressure sensors arrays for activity recognition. Pervasive and Mobile Computing30: 97-112.
[15] PARADISO, J., ABLER, C., HSIAO, K.-Y., and REYNOLDS, M. (1997) The magic carpet: physical sensing for immersive environments. In Proceedings of the
CHI'97 Extended Abstracts on Human Factors in Computing Systems, 1997 277–278
[16] ADDLESEE, M.D., JONES, A., LIVESEY, F., and SAMARIA, F. (1997) The ORL active floor [sensor system].IEEE Personal Communications4(5): 35-41. [17] CHANG, S., HAM, S., KIM, S., SUH, D., and KIM, H.
(2010) Ubi-Floor: Design and Pilot Implementation of an Interactive Floor System. In Proceedings of the 2nd International Conference on Intelligent Human-Machine Systems and Cybernetics, 2010/08 290-293
[18] MUHEIDAT, F. and TYRER, H.W. (2016) Can we make a carpet smart enough to detect falls? In Proceedings of the 2016 38th Annual International Conference of the IEEE Engineering in Medicine and Biology Society (EMBC), 2016/08 5356-5359
[19] TANAKA, O., RYU, T., HAYASHIDA, A., MOSHNYAGA, V.G., and HASHIMOTO, K. (2015) A smart carpet design for monitoring people with dementia. In HENRY SELVARAJ, H., ZYDEK, D. and CHMAJ, G. Progress in Systems Engineering (Springer: Cham.), 653-659.
[20] AL-NAIMI, I. and WONG, C.B. (2017) Indoor human detection and tracking using advanced smart floor. In Proceedings of the 8th International Conference on Information and Communication Systems (ICICS), 2017/04 34-39
[21] GONÇALVES, R., REIS, J., SANTANA, E., CARVALHO, N.B., PINHO, P., and ROSELLI, L. (2013)
Smart floor: Indoor navigation based on RFID. In Proceedings of the 2013 IEEE Wireless Power Transfer (WPT), 2013/05 103-106
[22] KANG, S.H., KIM, Y.H., LEE, E.J., LEE, S.G., MIN, B.C., AN, J., and KIM, D.H. (2011) Implementation of smart floor for multi-robot system. In Proceedings of the
5th International Conference on Automation, Robotics and Applications, 2011/12 46-51
[23] VAUGHAN, J., GREEN, P., SALTER, M., GRIEVE, B., and OZANYAN, K. (2017) Floor sensors of animal weight and gait for precision livestock farming. In Proceedings of the 2017 IEEE Sensors Conference, 2017/11 1-3.
[24] VELLOSO, E., SCHMIDT, D., ALEXANDER, J., GELLERSEN, H., and BULLING, A. (2015) The feet in Human--Computer Interaction: A survey of foot-based interaction.ACM Computing Surveys 48(2): 21:1-21:35. [25] YU, C.R., WU, C.L., LU, C.H., and FU, L.C. (2006)
Human localization via multi-cameras and floor sensors in smart home. In Proceedings of the 2006 IEEE International Conference on Systems, Man and Cybernetics, 2006/10 3822-3827
[26] BRÄNZEL, A., HOLZ, C., HOFFMANN, D., SCHMIDT, D., KNAUST, M., LÜHNE, P., MEUSEL, R., RICHTER, S., and BAUDISCH, P. (2013) GravitySpace: Tracking Users and Their Poses in a Smart Room Using a Pressure-sensing Floor. In Proceedings of the SIGCHI Conference on Human Factors in Computing Systems, New York, NY, USA, 2013 (New York, NY, USA: 725–734
IEEE MTT-S International Microwave Symposium (IMS2014), 2014/06 1-3
[28] MOZER, M.C. (1998) The neural network house: An environment hat adapts to its inhabitants. In Proceedings of the Proc. AAAI Spring Symp. Intelligent Environments, 1998
[29] KIM, E., HELAL, S., and COOK, D. (2010) Human Activity Recognition and Pattern Discovery. IEEE Pervasive Computing9(1): 48-53.
[30] COTTONE, P., GAGLIO, S., LO RE, G., and ORTOLANI, M. (2015) User activity recognition for energy saving in smart homes. Pervasive and Mobile Computing16(Part A): 156-170.
[31] LIN, F., SONG, C., XU, X., CAVUOTO, L., and XU, W. (2017) Patient handling activity recognition through pressure-map manifold learning using a footwear sensor. Smart Health1-2: 77-92.
[32] KLACK, L., MÖLLERING, C., ZIEFLE, M., and SCHMITZ-RODE, T. (2011) Future care floor: A sensitive floor for movement monitoring and fall detection in home environments. In Proceedings of the 2010 International Conference on Wireless Mobile Communication and Healthcare, 2010/10 211-218.
[33] SHELKE, S. and AKSANLI, B. (2019) Static and Dynamic Activity Detection with Ambient Sensors in Smart Spaces.Sensors19(4): 804.
[34] TRAN, D. and SOROKIN, A. (2008) Human activity recognition with metric learning. In Proceedings of the
European Conference on Computer Vision, 2008/10 548-561.
[35] SERRA, R., KNITTEL, D., DI CROCE, P., and PERES, R. (2016) Activity recognition with smart polymer floor sensor: Application to human footstep recognition. IEEE Sensors Journal16(14): 5757-5775.
[36] ZHANG, X., KIM, G.-B., XIA, Y., and BAE, H.-Y. (2012)
Human activity recognition with trajectory data in multi-floor indoor environment. In Proceedings of the
International Conference on Rough Sets and Knowledge Technology, 2012/08, 257-266
[37] CHENG, J., ZHOU, B., SUNDHOLM, M., and LUKOWICZ, P. (2013) Smart chair: What can simple pressure sensors under the chairs legs tell us about user activity. In Proceedings UBICOMM13: The 7th International Conference on Mobile Ubiquitous Computing, Systems, Services and Technologies, 2013/09 81-84.
[38] HUANG, M., GIBSON, I., and YANG, R. (2017) Smart chair for monitoring of sitting behavior.KnE Engineering
2(2): 274-280.
[39] MA, C., LI, W., GRAVINA, R., and FORTINO, G. (2017) Posture detection based on smart cushion for wheelchair users.Sensors17(4): 719.
[40] MA, C., LI, W., GRAVINA, R., CAO, J., LI, Q., and FORTINO, G. (2017) Activity level assessment using a smart cushion for people with a sedentary lifestyle.Sensors
17(10): 2269.
[41] OLIVER, N., HORVITZ, E., and GARG, A. (2002)
Layered representations for human activity recognition. In Proceedings of the 4th IEEE International Conference on Multimodal Interfaces, 2002/10 3-8.
[42] AHMAD, H. and NOR, N.A.M. (2017) Detection and analysis of activity recognition for and rehabilitation. In Proceedings of the Control and System Graduate Research Colloquium (ICSGRC), 2017/08 246–250
[43] KALISCHEWSKI, K., WAGNER, D., VELTEN, J., and KUMMERT, A. (2017) Activity recognition for indoor
movement and estimation of travelled path. In Proceedings of the 10th International Workshop on Multidimensional (nD) Systems (nDS), 2017/09 1-5
[44] MA, Y. and GHASEMZADEH, H. (2016) An asynchronous multi-view learning approach for activity recognition using wearables. In Proceedings of the 38th Annual International Conference of the IEEE Engineering in Medicine and Biology Society (EMBC), 2016/08 3105-3108
[45] SUN, L., ZHANG, D., LI, B., GUO, B., and LI, S. (2010)
Activity Recognition on an Accelerometer Embedded Mobile Phone with Varying Positions and Orientations. In Proceedings of the Ubiquitous Intelligence and Computing, 2010/10 548-562
[46] PHAM, C., DIEP, N.N., and PHUONG, T.M. (2017) e-Shoes: Smart shoes for unobtrusive human activity recognition. In Proceedings of the 9th International Conference on Knowledge and Systems Engineering (KSE), 2017/10 269-274
[47] SZTYLER, T., STUCKENSCHMIDT, H., and PETRICH, W. (2017) Position-aware activity recognition with wearable devices. Pervasive and Mobile Computing 38 (Part 2): 281-295.
[48] BULLING, A., WARD, J.A., GELLERSEN, H., and TROSTER, G. (2011) Eye movement analysis for activity recognition using electrooculography. IEEE Transactions on Pattern Analysis and Machine Intelligence33(4): 741-753.
[49] CHENG, J., SUNDHOLM, M., ZHOU, B., KREIL, M., and LUKOWICZ, P. (2014) Recognizing subtle user activities and person identity with cheap resistive pressure sensing carpet. In Proceedings of the 2014 International Conference on Intelligent Environments, 2014/06 148-153 [50] KOLEKAR, M.H. and DASH, D.P. (2016) Hidden Markov
Model based human activity recognition using shape and optical flow based features. In Proceedings of the 2016 IEEE Region 10 Conference (TENCON), 2016/11 393-397 [51] MENICATTI, R., BRUNO, B., and SGORBISSA, A.
(2017) Modelling the influence of cultural information on vision-based human home activity recognition. In Proceedings of the 14th International Conference on Ubiquitous Robots and Ambient Intelligence, 2017/06 32-38
[52] SERRA, R., KNITTEL, D., CROCE, P.D., and PERES, R. (2016) Activity recognition with smart polymer floor sensor: Application to human footstep recognition. IEEE Sensors Journal16(14): 5757-5775.
[53] WU, C.L., TSENG, Y.S., and FU, L.C. (2013) Spatio-temporal Feature Enhanced Semi-supervised Adaptation for Activity Recognition in IoT-Based Context-Aware Smart Homes. In Proceedings of the 2013 IEEE International Conference on Green Computing and Communications and IEEE Internet of Things and IEEE Cyber, Physical and Social Computing, 2013/08 460-467 [54] TAPIA, E.M., INTILLE, S.S., and LARSON, K. (2004)
Activity Recognition in the Home Using Simple and Ubiquitous Sensors. In Proceedings of the Pervasive Computing, 2004/04/21 158-175
[55] BUCKLEY, J.P., HEDGE, A., YATES, T., COPELAND, R.J., LOOSEMORE, M., HAMER, M., BRADLEY, G., and DUNSTAN, D.W. (2015) The sedentary office: an expert statement on the growing case for change towards better health and productivity. Br J Sports Med 49(21): 1357-1362.
[57] TURAGA, P., CHELLAPPA, R., SUBRAHMANIAN, V.S., and UDREA, O. (2008) Machine Recognition of Human Activities: A Survey. IEEE Transactions on Circuits and Systems for Video Technology18(11): 1473-1488.
[58] VRIGKAS, M., NIKOU, C., and KAKADIARIS, I.A. (2015) A review of human activity recognition methods. Frontiers in Robotics and AI2:28.
[59] CASTELLANO, G., VILLALBA, S.D., and CAMURRI, A. (2007) Recognising human emotions from body movement and gesture dynamics. In Proceedings of the
International Conference on Affective Computing and Intelligent Interaction, 2007/09 71–82
[60] QUINLAN, J.R., MORRIS, G., JACKSON, J., and O'CONNELL, P. (1993) C4.5 : Programs for machine learning (Amsterdam: Elsevier).
[61] RAJPUT, A., AHARWAL, R.P., DUBEY, M., SAXENA, S., and RAGHUVANSHI, M. (2011) J48 and JRIP rules for e-governance data.International Journal of Computer Science and Security (IJCSS)5(2): 201.
[62] FINLAY, J., CONNOR, A., and PEARS, R. (2011) Mining software metrics from Jazz. In Proceedings of the 9th International Conference on Software Engineering Research, Management and Applications, 2011/09 39-45 [63] ZARKAMI, R. (2011) Application of classification
trees-J48 to model the presence of roach (Rutilus rutilus) in rivers. Caspian Journal of Environmental Sciences 9(2): 189-198.
[64] MURALIDHARAN, V. and SUGUMARAN, V. (2013) Selection of discrete wavelets for fault diagnosis of monoblock centrifugal pump using the J48 algorithm. Applied Artificial Intelligence27(1): 1-19.
[65] 65. NOROUZI, M., COLLINS, M.D., JOHNSON, M., FLEET, D.J., and KOHLI, P. (2015) Efficient non-greedy optimization of decision trees.arXiv:1511.04056 [cs]. [66] BREIMAN, L. (2001) Random Forests.Machine Learning
45(1): 5-32.
[67] CASSIDY, A.P. and DEVINEY, F.A. (2014) Calculating feature importance in data streams with concept drift using Online Random Forest. In Proceedings of the 2014 IEEE International Conference on Big Data, 2014/10 23-28. [68] DÍAZ-URIARTE, R. and DE ANDRES, S.A. (2006) Gene
selection and classification of microarray data using random forest.BMC bioinformatics7(1): 3.
[69] PAL, M. (2005) Random forest classifier for remote sensing classification. International Journal of Remote Sensing26(1): 217-222.
[70] RODRIGUEZ-GALIANO, V.F., GHIMIRE, B., ROGAN, J., CHICA-OLMO, M., and RIGOL-SANCHEZ, J.P. (2012) An assessment of the effectiveness of a random forest classifier for land-cover classification. ISPRS Journal of Photogrammetry and Remote Sensing 67: 93-104.
[71] LEWIS, D.D. (1998) Naive (Bayes) at forty: The independence assumption in information retrieval. In Proceedings of the Machine Learning: ECML-98, 1998/04 4-15
[72] PALANIAPPAN, S. and AWANG, R. (2008) Intelligent heart disease prediction system using data mining techniques. In Proceedings of the Computer Systems and Applications, 2008/03108-115
[73] KIM, S.-B., HAN, K.-S., RIM, H.-C., and MYAENG, S.H. (2006) Some effective techniques for naive bayes text classification. IEEE transactions on knowledge and data engineering18(11): 1457-1466.
[74] ANAGNOSTOPOULOS, T., ANAGNOSTOPOULOS, C., HADJIEFTHYMIADES, S., KYRIAKAKOS, M., and KALOUSIS, A. (2009) Predicting the location of mobile users: a machine learning approach. In Proceedings of the
2009 International Conference on Pervasive Services, 2009/07 65-72
[75] OSUNA, E., FREUND, R., and GIROSIT, F. (1997)
Training support vector machines: an application to face detection. In Proceedings of Computer Vision and Pattern Recognition, 1997/06 130-136
[76] WIDODO, A. and YANG, B.-S. (2007) Support vector machine in machine condition monitoring and fault diagnosis. Mechanical Systems and Signal Processing
21(6): 2560-2574.