Gummadi Sridhar Babu et al. J Sci Res Pharm, 2017;6(9):104-108
World Inventia Publishers
J
ournal of
S
cientific
R
esearch in
P
harmacy
http://www.jsrponline.com/
Vol. 6, Issue 9, 2017 ISSN: 2277-9469
USA CODEN: JSRPCJResearch Article
ANALYTICAL METHOD DEVELOPMENT AND VALIDATION FOR THE ESTIMATION OF
TOPIRAMATE BY RP-HPLC METHOD
Gummadi Sridhar Babu 1*, PS. Malathi 2
* 1 Professor, Department of Pharmaceutical analysis, Sri Shivani College of Pharmacy, Warangal, Telangana, INDIA. 2Associate Professor, Department of Pharmacology, Sri Shivani College of Pharmacy, Warangal, Telangana, INDIA.
Received on: 28-08-2017; Revised and Accepted on: 21-09-2017
ABSTRACT
A
new method was established for estimation of Topiramate by RP-HPLC method. The chromatographic conditions were successfully developed for the separation of Topiramate by using Agilent column (4.6×150mm) 5µ, flow rate was 1.4 ml/min, mobile phase ratio was Water: MeOH (25:75% v/v), detection wavelength was 300nm. The instrument used was Waters HPLC Auto Sampler, Separation module 2695, photo diode array detector 996, Empower-software version-2. The retention times were found to be 5.87 mins. The % purity of Topiramate was found to be 98.56%.The system suitability parameters for Topiramate such as theoretical plates and tailing factor were found to be 3797331, 1.1. The analytical method was validated according to ICH guidelines (ICH, Q2 (R1)). The linearity study of Topiramate was found in concentration range of 20µg-100µgand correlation coefficient (r2) was found to be 0.997, % recovery was found to be 98.96%, %RSD for repeatability was 0.2, % RSD for intermediate precision was 0.2.The precision study was precision, robustness and repeatabilty.LOD value was3.67 and LOQ value was 8.87. Hence the suggested RP-HPLC method can be used for routine analysis of Topiramate in API and Pharmaceutical dosage form.
KEYWORDS: Agilent column,Topiramate, RP-HPLC.
INTRODUCTION
Classification of Analytical Methods:
Analytical methods can be separated into classical and instrumental methods.
Classical methods are also known as wet chemistry methods, where, Separation of analytes was performed by precipitation, extraction, or distillation.
Qualitative analysis by reaction of analytes with reagents that yield products that couldbe recognized by their colors, boiling or melting points, solubilities, optical activities, or refractive indexes.
Quantitative analysis by gravimetric or titrimetric techniques. In Gravimetry, the amount of a substance is determined by the mass of product generated by a chemical reaction. In Titrimetry, concentration is determined by the volume of a reagent needed to completely react with the analyte.
These methods are highly accurate and precise but require a sufficient amount of sample, and a concentration of analyte in the sample of at least 0.1 percent. Furthermore these analyses require the constant attention of a trained scientist. Classical methods use separations such as precipitation, extraction, and distillation and qualitative analysis by color, odor, or melting point.
Instrumental methods use an apparatus to measure physical quantities of the analyte such as light absorption, fluorescence, or conductivity. Highly efficient chromatographic and electrophoretic
*Corresponding author:
Gummadi Sridhar Babu
Professor,
Department of Pharmaceutical analysis, Pragathi Pharmacy College, Janagaon, Telangana, INDIA.
* E-Mail: [email protected]
techniques began to replace distillation, extraction and precipitation for the separation of components of complex mixtures prior to their qualitative or quantitative determination. These newer methods for separating and determining chemical species are known collectively as Instrumental methods of Analysis.
Thus, techniques employed in quantitative analysis are based upon:
Chemical Properties: Measuring the amount of reagent necessary to complete the reaction, or ascertaining the amount of reaction product obtained.
Electrical Properties: Appropriate electrical measurements (e.g. potentiometry).
Optical Properties: The measurement of certain optical properties (e.g. absorption spectra). In some cases, a combination of optical or electrical measurements and quantitative chemical reaction (e.g. amperometric titration) may be used.
Introduction to Chromatography:
Chromatography is a technique in which the components of a mixture are separated based on the rates at which they are carried through a stationary phase by a gaseous or liquid mobile phase [1].
Classification of Chromatographic Methods:
Chromatographic methods are of two types. In column chromatography, the stationary phase is held in a narrow tube and the mobile phase is forced through the tube under pressure or by gravity. In planar chromatography, the stationary phase is supported on a flat plate or in the pores of a paper. Here the mobile phase moves through the stationary phase by capillary action or under the influence of gravity [1].
High Performance Liquid Chromatography:
High-performance liquid chromatography also known as High-pressure or High price or High speed liquid chromatography, HPLC) is a form of column chromatography used frequently in analytical chemistry and biochemistry to identify, separate, and quantify compounds. It is a powerful tool in analysis. It is basically an improved form of column chromatography which has been optimized to provide rapid high resolution separations. Early LC used gravity fed open tubular columns with particles 100s of microns in size; the human eye was used for a detector and separations often took hours or even days to develop. HPLC as compared with the classical technique is characterized by [4, 5]:
Small diameter (2-5 mm), reusable stainless steel columns without repacking & regeneration
Column packings with very small (3, 5 and 10 µm) particles and the continual development of new substances to be used as stationary phases
Relatively high inlet pressures and controlled flow of the mobile phase
Precise sample introduction without the need for large samples
Special continuous flow detectors capable of handling small flow rates and detecting very small amounts
Automated standardized instruments
Rapid analysis
Greater reproducibility due to close control of the parameters affecting the efficiency of separation
Capable of handling macro molecule & viscous solutions
Efficient analysis of labile natural products
Reliable handling of inorganic or other ionic species
HPLC is probably the most universal type of analytical procedure. In addition HPLC also ranks as one of the most sensitive analytical procedures and is unique in that it easily copes with multi-component mixtures. Its application areas include quality control, process control, forensic analysis, environmental monitoring and clinical testing. It has achieved this position as a result of the constant evolution of the equipment used in LC to provide higher and higher efficiencies at faster and faster analysis times with a constant incorporation of new highly selective column packings.
Principles of Separation:
In general, three primary characteristics of chemical compounds can be used to create HPLC separations. They are:
Polarity
Electrical Charge
Molecular Size
On the basis of separation chemistry, Liquid Chromatography is subdivided into the following techniques:
Adsorption Chromatography functions via an adsorbent stationary phase. The degree to which a sample particle may adsorb to the stationary phase is determined by the relative polarity, or charge, that the particle may possess at a given time.
Partition chromatography in which separation is based mainly on differences between the solubilities of the components in the mobile and stationary phases. Here, the two phases are liquids. The stationary phase liquid is present as thin film on an inert solid support.
Ion-exchange chromatography where a resin coated solid is used as stationary phase which has ions (either cations or anions, depending on the resin) covalently bonded to it, and the solute ions of the opposite charge are electro statically bound to the surface. When the mobile phase (always a liquid) is eluted through the resin, the electro statically bound ions are released as other ions are bonded preferentially.
Ion-pair chromatography allows the separation of complex mixtures of polar and ionic molecules. The selectivity is determined by the mobile phase supplemented with a specific ion-pairing reagent which large ionic molecules are having a charge opposite to the analyte of interest, as well as a hydrophobic region to interact with the stationary phase. The counter-ion combines with the ions of the eluent, becoming ion pairs in the stationary phase resulting in different retention times, thus facilitating separation of analytes.
Size-exclusion chromatography, also called as Gel Permeation Chromatography uses gels of controlled pore-size distribution as stationary phase. Separation is based on the extent to which analyte molecules can penetrate the network of pores. This is used for large molecular weight compounds - proteins and polymers.
Large molecules excluded from pores: Not retained, first eluted.
Intermediate molecules: Retained, intermediate elution times.
Small molecules permeate into pores: Strongly retained, last eluted.
Chiral chromatography involves the separation of stereo isomers. To enable chiral separations to take place, either the mobile phase or the stationary phase must themselves be made chiral, giving differing affinities between the analytes.
Affinity Chromatography is the most selective type of chromatography employed based on specific interactions in a lock-and-key paradigm between analytes and matrix-bound ligands. It utilizes the specific interaction between one kind of solute molecule and a second molecule that is immobilized on a stationary phase [8-10].
Based on the modes of separation:
Normal-phase chromatography uses a polar stationary phase and a non-polar mobile phase. An adsorptive mechanism is used for the analysis of solutes. Typical stationary phases for normal-phase chromatography are silica or organic moieties with cyano and amino functional groups. The mobile phase consists of a very nonpolar solvent like hexane or heptane mixed with a slightly more polar solvent like isopropanol, ethyl acetate or chloroform. In normal-phase chromatography, the most nonpolar compounds elute first and the most polar compounds elute last. Retention increases as the amount of nonpolar solvent in the mobile phase increases. This technique is still used, but is less common than reversed phase.
Reversed-phase chromatography uses a non-polar stationary phase and a polar mobile phase. This is the most common type of HPLC separation in use today. A partition mechanism is typically used for separations by non-polar differences. For reversed phase, alkyl hydrocarbons are the preferred stationary phase; octadecyl (C18) is the most common stationary phase, but octyl (C8) and butyl (C4) are also used in some applications. In reversed phase chromatography, the most polar compounds elute first with the most non-polar compounds eluting last [11, 12].
Based on elution technique:
Isocratic: Isocratic indicates constant composition.
Thus, it is a separation in which the mobile phase composition or polarity or elution strength remains constant throughout the process. The word was coined by Csaba Horvath who was one of the pioneers of HPLC.
Gradient: A separation in which the mobile phase composition is changed during the separation process i.e., gradually increasing the polarity or elution strength.
Based on Scale of preparation:
Analytical: Analytical models are used only for separation of components and they cannot be recovered since sample taken is very low i.e., in micro grams. The column dimensions are also smaller when compared to that of preparative analysis.
Based on the type of analysis:
Qualitative analysis: This type of analysis is used to identify the compound, detect the presence of impurities, to find the number of components etc. Commonly used parameter is Retention time values.
Quantitative analysis: This is used to determine the quantity of the individual or several components in a mixture. This is done by comparing the peak area of the standard &sample [1, 4, 6, 7].
MATERIALS AND METHODS
Materials:
Ortho phosphoric acid, Acetonitrile for HPLC, Topiramate, KH2PO4, K2HPO4, Water and Methanol for HPLC.
Methodology:
HPLC Method Development:
The chromatographic method development for the estimation of Topiramate were optimized by several trials for various parameters as different column, flow rate and mobile phase, finally the following chromatographic method was selected for the separation and quantification of Topiramate in API and pharmaceutical dosage form by RP-HPLC method.
Method Validation:
Specificity:
The system suitability for specificity was carried out to determine whether there is any interference of any impurities in retention time of analytical peak. The specificity was performed by injecting blank.
Linearity:
10 mg of Topiramate working standard was accurately weighed and was transferred into a 10ml clean dry volumetric flask, add about 2ml of diluent and sonicate to dissolve it completely and make volume up to the mark with the same solvent.
Accuracy:
10mg of Topiramate working standard was accurately weighed and transferred into a 10ml clean dry volumetric flask add about 2ml of diluent and sonicate to dissolve it completely and make volume up to the mark with the same solvent (Stock solution).Further pipette out 1 ml of the above stock solution into a 10 ml volumetric flask and was diluted up to the mark with diluents.
Precision:
Repeatability: 10 mg of Topiramate working standard was accurately weighed and transferred into a 10ml clean dry volumetric flask add about 2ml of diluent and sonicate to dissolve it completely and make volume up to the mark with the same solvent. Further pipette out 1ml of the above stock solution into a 10ml volumetric flask and was diluted up to the mark with diluent.
Intermediate precision / Ruggedness: To evaluate the intermediate precision (also known as ruggedness) of the method, precision was performed on different days by using different make column of same dimensions.
Limit of Detection (LOD):
LOD’s can be calculated based on the standard deviation of the response (SD) and the slope of the calibration curve (S) at levels approximating the LOD according to the formula. The standard deviation of the response can be determined based on the standard deviation of y-intercepts of regression lines.
Limit of Quantification (LOQ):
LOQ’s can be calculated based on the standard deviation of the response (SD) and the slope of the calibration curve (S) according to the formula. Again, the standard deviation of the response can be determined based on the standard deviation of y-intercepts of regression lines.
Robustness:
As part of the robustness, deliberate change in the flow rate, mobile phase composition was made to evaluate the impact on the method.
a) The flow rate was varied at 1.2ml/min to 1.6 ml/min. Standard
solution 100 ppm of Topiramate prepared and analysed using the varied flow rates along with method flow rate.
b) The organic composition in the mobile phase was varied from 65%
to75 %standard solution 100 µg/ml of Topiramate was prepared and analysed using the varied mobile phase composition along with the actual mobile phase composition in the method.
System Suitability:
10 mg of Topiramate working standard was accurately weighed and transferred into a 10ml clean dry volumetric flask and add about 2ml of diluent and sonicate to dissolve it completely and make volume up to the mark with the same solvent (Stock solution).Further pipette out 1ml of Topiramate from the above stock solution into a 10ml volumetric flask and was diluted up to the mark with diluent.
RESULTS
Table No. 1: Optimized chromatographic conditions for estimations of Topiramate by RP-HPLC method
Instrument used Waters HPLC with auto sampler and PDA or
detector
Column Agilent (5µm, 4.6x150mm)
Column temperature Ambient
Wavelength 300 nm
Mobile phase ratio Water: MeoH(25:75% v/v)
Flow rate 1.4 min/ml
Auto sampler temperature Ambient
Injection volume 10µl
Run time 8 minutes
Validation Parameters:
Linearity:
Table No. 1: Linearity Results for Topiramate
Name Concentration Area
Topiramate 50 ppm 1608152
Topiramate 100 ppm 2592905
Topiramate 150 ppm 3778327
Topiramate 200 ppm 5170038
Topiramate 250 ppm 6249400
Co efficient of correlation (R2) 0.997
Accuracy:
Table No. 2: Showing accuracy results for Topiramate
%Concentration
(at specification level) Average area Amount added (mg) Amount found (mg) % Recovery recovery Mean
50% 1460983 5 4.86 98.81% 98.96%
100% 2693891 10 9.88 99.08%
150% 2347786 15 15.0 100.0%
The accuracy study was performed for % recovery of Topiramate. The % recovery was found to be 98.96% (NLT 98% and NMT 102%).
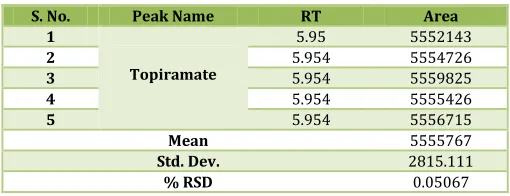
Precision:
Table No. 3: Showing% RSD results for Topiramate
S. No. Peak Name RT Area
1
Topiramate
5.95 5552143
2 5.954 5554726
3 5.954 5559825
4 5.954 5555426
5 5.954 5556715
Mean 5555767
Std. Dev. 2815.111
% RSD 0.05067
Intermediate Precision / Ruggedness:
Table No. 4: Showing results for intermediate precision of Topiramate
S. No. Peak Name RT Area
1
Topiramate
5.95 5558725
2 5.954 5553812
3 5.953 5557609
4 5.955 5555298
5 5.95 5558756
Mean 5556840
Std. Dev. 2200.124
% RSD 0.039593
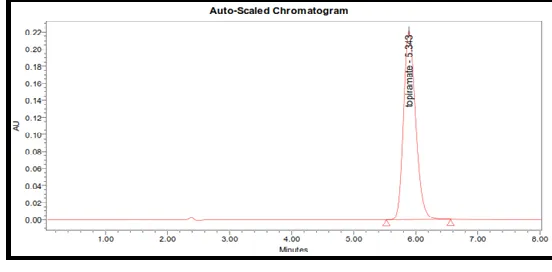
Variation in Flow:
Fig. 2: Chromatogram showing more flow rate 1.6 ml/min
Table No. 5: Showing system suitability results for Topiramate
S. No. Flow rate (ml/min) System suitability results
USP Plate Count USP Tailing
1 1.2 6871269 1.21
2 1.4 5553812 1.12
3 1.6 4828929 1.12
Table No. 6: Showing system suitability results for Topiramate
S. No. Change in organic composition
in the mobile phase USP Plate Count System suitability results USP Tailing
1 5 % less 6871269 1.21
2 * Actual 5553812 1.21
3 5 % more 4828929 1.21
SUMMARY AND CONCLUSION
A new method was established for estimation of Topiramate
by RP-HPLC method. The chromatographic conditions were successfully developed for the separation of Topiramate by using Agilent column (4.6×150mm) 5µ, flow rate was 1.4 ml/min, mobile phase ratio was Water: MeOH (25:75% v/v), detection wavelength was 300nm. The instrument used was Waters HPLC Auto Sampler, Separation module 2695, photo diode array detector 996, Empower-software version-2. The retention times were found to be 5.87 mins. The % purity of Topiramate was found to be 98.56%.The system suitability parameters for Topiramate such as theoretical plates and tailing factor were found to be 3797331, 1.1. The analytical method was validated according to ICH guidelines (ICH, Q2 (R1)). The linearity study of Topiramate was found in concentration range of 20µg-100µgand correlation coefficient (r2) was found to be 0.997, % recovery was found to be 98.96%, %RSD for repeatability was 0.2, % RSD for intermediate precision was 0.2. The precision study was precision, robustness and repeatabilty.LOD value was3.67 and LOQ value was 8.87.Hence the suggested RP-HPLC method can be used for routine analysis of Topiramate in API and Pharmaceutical dosage form.RIFERENCE:
1. Becket and Stenlake. Practical Pharmaceutical Chemistry, Part 24th Edn, CBS Publications and Distributors, 2005;157-168.
2. PD. Sethi. HPLC Quantitative Analysis of Pharmaceutical Formulations. CBS Publications and Distributors. 1st Edn, 2001;69-70.
3. BK. Sharma. Instrumental Method of Chemical Analysis, 23rd Edn, Goal Publishers, 2004.
4. Practical HPLC Method Development Lloyd R. Snyder, Joseph J. Kirkland, Joseph L. Glajch, Second Edn 1, 420-430, 686-704. 5. Validating Chromatographic Methods, David M. Bliesner, 1-4. 6. International Conference on Harmonization: ICH Q 2 (R1)
Validation of Analytical Procedures: Text and Methodology, 1995.
7. Indian Pharmacopeia 2007;1:715. 8. British Pharmacopeia 2007;1:136.
9. Maryanoff BE. et al. Structure-activity studies on anticonvulsant sugar sulfamates related to topiramate. Enhanced potency with cyclic sulfate derivatives. J Med Chem 2003;46(4):652
10. Bruce E. et al. Structure−Activity Studies on Anticonvulsant Sugar Sulfamates Related to Topiramate. Enhanced Potency with Cyclic Sulfate Derivatives. J Med Chem 1998;41(8):1315– 1343
11. Latini et al. Topiramate: Its Pharmacological Properties and Therapeutic Efficacy in Epilepsy. Mini Rev in Med Chem 2008;8(1):10-23.
12. Mohammad Bagher Majnoonia et al. Development and validation of a new method for determination of topiramate in bulk and pharmaceutical formulation using high performance liquid chromatography UV detection after precolumn derivatization. Int J Pharma and Chem Sci 2012;1(2):877.
How to cite this article:
Gummadi Sridhar Babu, PS. Malathi. ANALYTICAL METHOD DEVELOPMENT AND VALIDATION FOR THE ESTIMATION OF TOPIRAMATE BY RP-HPLC METHOD. J Sci Res Pharm 2017;6(9):104-108.