Harmonic Mitigation by Grid Connected
Permanent Magnet Synchronous Generator based
on Wind Energy Convertor System for Improving
Power Quality
Vivek G. Katara Dr. Hari Kumar Naidu
M. Tech Student Dean & Head of Dept.
Department of Electrical Engineering Department of Electrical Engineering
TGPCET Nagpur, India. TGPCET Nagpur, India.
Arun Katara
Assistant Professor
DMIETRWardha, India
Abstract
The paper presents a method of harmonic mitigation for Permanent Magnet Synchronous Generator (PMSG) coupled wind turbine interconnected with the infinite grid. Two voltage source inverters one at generator side is connected as Voltage Source Inverter (VSI) to extract maximum power from fluctuating wind turbine using vector control strategy and the other inverter is connected to the grid side Voltage Source Inverter (VSI) which feeds the generated active power to the grid in addition to suppress harmonics at PCC point of common coupling. The grid side VSI is controlled by the Instantaneous Synchronous Component Theory technique. Thus, with the help of both VSIs the power quality is improved and the due Sinusoidal current signal is obtained at Unity Power Factor which is fed to the grid. The system model is developed in MATAB /SIMULINK to verify the effectiveness of the control strategies of both the inverters and the system as a whole. The result shows the effectiveness of harmonic mitigation in the system, while connecting the wind turbine with the grid.
Keywords: Permanent magnet synchronous generator (PMSG), Instantaneous Symmetrical Component Theory (ISCT), Vector Control, Voltage Source Inverter (VSI), Total harmonic Distortion (THD)
________________________________________________________________________________________________________ I. INTRODUCTION
The recent increase in energy consumption is due to increasing day to day demand and due to depletion of energy sources like petroleum, fossil fuels etc., and the renewable energy is the need of the hour. Mainly two sources of nature are extensively used such as Solar and Wind power to meet the increasing demand, worldwide. The extraction of solar energy, has few limitations such as requirement of large area and energy storage devices. The weather variation also severely affects the performance of the system. With the increase in the wind turbine size, the electrical power production is also increased [7]. The growth in choice for wind turbine is also due to the recent advancement in power electronics devices. Hence it had become most suitable along with low cost venture. In early development of wind energy fixed speed induction generator were often used [1] but with the limitations such as low efficiency and power quality which had adversely affected the performance and its further applications.
With the emerging technology available at present the variable speed wind turbine generator such as Doubly Fed Induction Generator (DFIG) and Permanent Magnet Synchronous Generator (PMSG) is the preferred technology.
The PMSG had several advantages such as possibility of extraction of the optimal energy for different wind speeds, reduction of mechanical constraints by elimination of gearbox, which in turn improves reliability of the system and reduction in maintenance expenses as well. Permanent Magnet Synchronous Generator (PMSG) is characterized by small value inductances, which elevates performances for generator and better controllability. Hence it makes VSI based PMSG wind turbine useful than DFIG wind turbine.
The output of the PMSG is controlled through Generator-VSI for the extraction of maximum power point tracking (MPPT) by providing current controlled hysteresis PWM based vector control strategy as other control strategies are based on optimum power/torque tracking which uses wind velocity to obtain the designed shaft speed of the generator. However these are costly and less reliable for a small turbine (2).
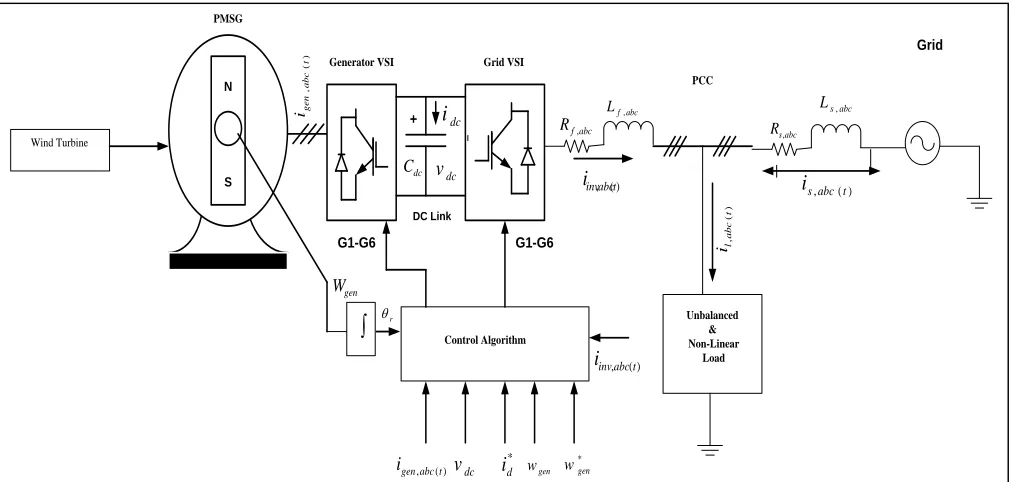
Fig. 1: Block Diagram representation of PMSG Based WECS
The generated power is first transferred to DC link through generator VSI which provides isolation from generated AC power and eliminates the requirement of synchronization with grid. The DC power is fed to the grid through Grid side Voltage Source Inverter (G-VSI).
The Grid Side Voltage Source Inverter (G-VSI) control strategies is based on instantaneous symmetrical component theory (ISCT). There are number of control schemes available in the literatures for micro grid applications such as synchronous reference theory, power balance theory and DC vector control (1). There algorithms requires complex transformations. However, the applied control strategy of the instantaneous symmetrical component based control is simple in formulation, avoids interpretation of instantaneous reactive power and requires simple transformations. The instantaneous symmetrical component theory is used to control Grid side Voltage Source Inverter (G-VSI) for micro grid applications which has following characteristics.
1) It regulates the DC link voltage.
2) It Injects generated wind power into the grid.
In addition to this ISCT control is used to improve power quality issues like. 1) Load balancing on the grid.
2) Compensation of reactive power.
3) Elimination of current harmonics generated by nonlinear loads. 4) Supply power at unity power factor (UPF).
The simulation on MATLAB is done and results are obtained to validate the active power injection as well as improvement in power quality features simultaneously.
II. SYSTEM CONFIGURATION
The proposed system is shown in Fig.1 It consists of wind turbine coupled to PMSG which is again connected to two voltage source inverter Generator-VSI and Grid-VSI which is coupled through a DC link. The PMSG is connected through the AC/DC/AC system, the power generated is first transferred to DC link and then from DC link to grid. The system is composed of unbalanced and nonlinear loads at the point of common coupling which distorts the wave form.In addition it inject harmonics into the grid system which is used to compensate harmonics, while fulfilling the reactive power demand. By using the nonlinear and unbalanced loads simultaneously, it enables the grid to supply only sinusoidal current at unity power factor. The system parameters used for simulation study is given in Table -I.
Table – 1 System Parameters
System Quantities Values
System voltages 150V peak phase to neutral, 50Hz Linear Load Zla=50+j1.57Ω, Zlb=45+j3.14Ω, Zlc=40+j4.71Ω Non Linear Load Three phase full bridge rectifier load feeding a R-L load of 44Ω-3mH Grid VSI Parameters Cdc=660µF, Vdcref=600V, Lf=20µH, Rf=2Ω
Hysteresis band 0.25A
N
S Wind Turbine
Generator VSI
Grid PMSG
Unbalanced & Non-Linear
Load Control Algorithm
G1-G6
PCC
+
DC Link
G1-G6 Grid VSI
)
(
,
t
abc
ge
n
i
dc C
dc
i
dc v
abc s
R, abc
f L ,
abc f R,
abc s
L ,
)
(
,
t
abc
l
i
) (
,abct
inv
i
) (
,abct
inv
i
) (
,abc t
s
i
gen
W r
) ( ,abct gen
i vdc *
d i wgen
* gen
PMSG Parameters Rs=0.5Ω, Ld=0.01H, Lq=0.01H, Vpeak L-L=150V, Pole pairs=5
Wind speed 12m/s
III. INVERTOR CONTROL AND REFERENCE CURRENT GENERATION
Two independent voltage source inverters are used, which are connected through a common DC link. Two separate control strategies are used for generator side VSI and grid side VSI with independent control.
Modeling of the Wind Turbine:
The Model under study employs PMSG based Variable Speed WECS as shown in Fig1. The Modelling of Wind Turbine is described here under. The expression of the mechanical torque developed by a wind turbine Tm is given by the following
equation
3 2
, 2
1 V
C R
Tm t p (1)
Such that:
V Rt
(2)
In order to simulate the wind generation system, an empirical expression Cp(λ,β)of has been considered in
0.00184
2
3
2 3 . 0 12
1 . 0 sin
2 00167 . 0 5 .
0
p
C (3)
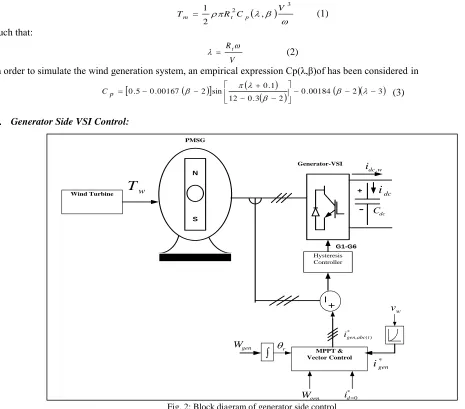
Generator Side VSI Control:
Fig. 2: Block diagram of generator side control
Fig.2 shows Block diagram for the generator side. The generator side starts from Wind Turbine till DC Link. The Generator Side VSI is responsible for control the generator speed under fluctuating wind condition and Maximum Power Point Tracking (MPPT). The Vector control strategy is used to extract maximum power from the wind turbine and transfer power to the load which is shown in Fig.3.
N
S
Wind Turbine
Generator-VSI PMSG
MPPT & Vector Control
G1-G6 +
Hysteresis Controller
-I
+
w
T
w dc
i ,
dc
i
dc
C
gen
W r
* ) ( ,abct gen
i
w v
* 0
d i
gen
W
Fig. 3: Block Diagram Representation of Vector Control
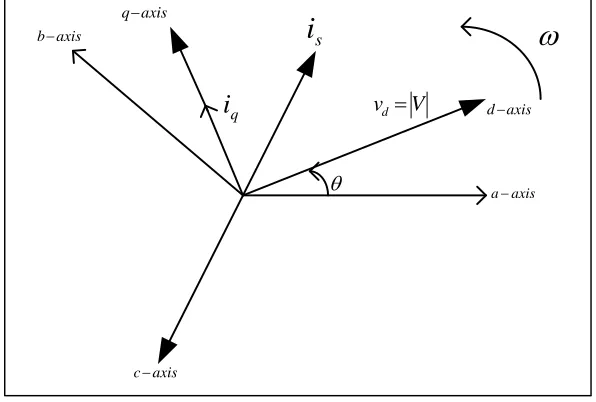
The vector control scheme used is based on a synchronously rotating reference frame. The angular velocity of the rotating axis system ω is set in the controller and defines the electrical frequency at the load.
Fig.4: abc and rotating reference analysis
The vector representation of a balanced tree phase system and their equivalent vector in a rotating frame is shown in Fig.4. Transforming the voltage equation wind dq transform in the rotating reference frame is depicted as follows:
q f d f d f d i
d L i
dt di L i R v
v (4)
d f q f q f qi
q L i
dt di L i R v
v
(5)Where,
Lf and Rf are the filter inductance and resistance. vd, vq and id, iq are the direct and quadrature axis components respectively. Using the dq transformation, the active power is given by
vdid vqiq
P
2 3
(6)
vdiq vqid
Q
2 3
(7)
In the reference axis frame vq=0 and vd=|V|. The equation for active and reactive power will be
vdid
VidP
2 3 2
3
(8)
0
*
q
v
PI PI PI
PI PI
*
dc
v
*
d
v
*
d
i
di
v
d
v
q
v
*
q
i
qi
v
qf
i
L
d f
i
L
d
v
dq
abc
Hys
te
re
s
is
P
W
M
GenerotorToSide VSI dc
v
d
i
q
i
aaxisaxis d
V
v
d
q
i
axisb
axis q
axis c
s
vdiq
V iq Q2 3 2
3
(9)
Therefore active and reactive power can be controlled by direct and quadrature current component respectively.
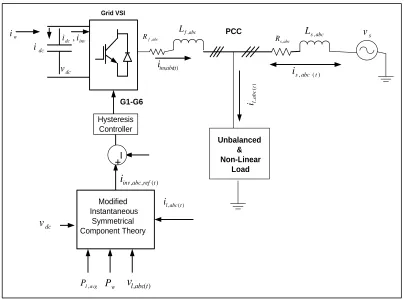
IV. GRID SIDE VSI CONTROL
Fig. 5: Block Diagram of Grid Side Control
The Grid VSI Control approach is shown in figure 5. The grid side VSI is responsible for regulating dc-link voltage so as to maintain power balance under both fluctuating wind and grid disturbances.
The non-linear and unbalance load may consist of three component that is active, reactive and harmonic current but the purpose of the system is to supply only the active component.
In this proposed system reference current for grid side VSI is generated employing ISCT. The main purpose of this scheme is to generate three reference current waveform which are proportional to the wind power and reactive power compensation as there are three phase three wire system which generates three currents equation which are as follows
Condition-1: The supply current must be balance
0
sb scsa
i
i
i
(10)Condition-2: The desired power factor of the source can be set randomly to have a pre-defined power factor from the source, the
relationship between the angles of
V
sa1
and isa1
is given as follows Vsa1 isa1
(11)
Where is desired phase angle between
V
sa1
and isa1
Condition-3: The source should absorb the net average power
P
s
P
lavg
P
s
P
loss
(12)
lo ss la vg
sc sb sa
la a
in v P P s P
v v v
i
i
*
,
la vg lo ss
sa sc sb
lb b
in v P P s P
v v v
i
i
* ,
lo ss la vg
sb sa sc
lc c
in v P P s P
v v v
i
i
*
, (13)
By solving equation, the Grid VSI reference current is obtained as follows:
Grid VSI
Unbalanced & Non-Linear
Load PCC
G1-G6
Hysteresis Controller
I
+
Modified Instantaneous
Symmetrical Component Theory inv
dc i i ,
dc v dc i w
i
) ( ,abct inv
i
abc f R ,
abc f
L ,
abc s R,
abc s
L, vs
) ( ,
,abcref t
inv
i
)
(
,
t
abc
l
i
) (
,abc t
s i
) ( ,abct l i
dc
v
avg l
Where,
3
, , 2 , , 2 * ,
c b a j sj s sc sb c b a j sj s sa la a invv
Q
v
v
v
P
v
i
i
3 , , 2 , , 2 * ,
c b a j sj s sa sc c b a j sj s sb lb b inv v Q v v v P v i i
3 , , 2 , , 2 * ,
c b a j sj s sb sa c b a j sj s sc lc c inv v Q v v v P v ii (14)
V. SYSTEM ANALYSIS USING SIMULATION STUDY
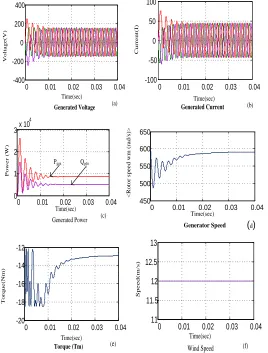
It is concluded that specified control strategy satisfactorily Extract the Wind power along with maintaining the grid voltage and current. The corresponding results in the form of waveforms are shown in Fig. (6), (7) and (8).
0 0.01 0.02 0.03 0.04 -400 -200 0 200 400 Time(sec) V o lt a g e (V )
Generated Voltage (a)
0 0.01 0.02 0.03 0.04
-100 -50 0 50 100 C u r r e n t( I ) Time(sec)
Generated Current (b)
0 0.01 0.02 0.03 0.04
0 1 2
3x 10
4
Time(sec) Pgen Qgen
P o w e r ( W )
Generated Power (c)
0 0.01 0.02 0.03 0.04 450 500 550 600 650 < R o to r sp e e d w m ( ra d /s )> Time(sec)
(d)
Generator Speed
0 0.01 0.02 0.03 0.04 -20 -18 -16 -14 -12 Torque (Tm) Time(sec) T o rq u e (N m )
(e)
0 0.01 0.02 0.03 0.04 11 11.5 12 12.5 13 S p e e d ( m /s )
Wind Speed (f)
Time(sec)
0 0.01 0.02 0.03 0.04 -5
0 5
Load Current(sec) Time(sec)
C
u
rr
e
n
ts
(I
)
(a) Time(sec)
0 0.01 0.02 0.03 0.04 -50
0 50
Source Current(sec)
C
u
rr
e
n
ts
(I
)
(b)
0 0.01 0.02 0.03 0.04 -100
-50 0 50 100
Time(sec)
V
o
lt
a
g
e
(
V
)
Grid Voltage (c)
0 0.01 0.02 0.03 0.04 -100
-50 0 50 100
Time(sec)
Vgrid
Igrid
Power Factor (d)
0 0.01 0.02 0.03
-40 -20 0 20 40
Time(sec)
*
fa
i
fa i
C
u
rr
e
n
t(
I)
Current Trackinng
(e) 0 0.01 0.02 0.03 0.04
6000
4000
-2000 0 2000
Time(sec)
P
o
w
e
r(
W
a
tt
s
)
Inverter Power
Pinv Q
inv
(f)
Fig.7 Simulation Results: (a) Load Current (b) Source Current (c) Grid Voltage (d) Power factor (e) Current tracking (f) Inverter power
We can observe and compare the grid parameters from Fig.6 (a-d). The waveform shown in the figure is the grid side waveform i.e. before and after compensation.
Fig.8 (a &b) shows the load active and reactive power, whereas Fig.8 (c &d) depicts grid active and reactive power respectively.
0 0.01 0.02 0.03 0.04 -200
0 200 400 600
P
o
w
e
r
(W
a
tt
s
)
Load Active Power Time(sec) (a)
0 0.01 0.02 0.03 0.04 -200
-100 0 100 200
Time(sec)
P
o
w
e
r
(W
a
tt
s
)
Load Reactive Power (b)
0 0.01 0.02 0.03 0.04 -2000
0 2000 4000 6000
Time(sec)
P
o
w
e
r
(W
)
Grid Active Power (c)
0 0.01 0.02 0.03 0.04 -200
-100 0 100 200
Time(sec)
P
o
w
e
r
(W
)
Grid Reactive Power (d)
Fig.8 Simulation Results: (a) Load active power (b) Load reactive power (c) Grid active power (d) Grid reactive power
VI. RESULT AND DISCUSSION
The simulation results of the system are already presented in section 4 and the detailed analysis of generator as well as grid side parameters is done.
The generator side parameters obtained are shown under Fig.6 (a-f), in which generator voltage and current obtained are sinusoidal as in Fig.7 (a) & (b) and constant generator speed of 12m/sec as in Fig.6 (f), and generated active and reactive power are also shown in Fig.6(c). The generated active and reactive power becomes constant after half cycle and gives steady state output.
Fig.7 (a) shows the load current which is improved after compensation as shown in Fig.7 (b) i.e. it became sinusoidal. The grid voltages after compensation as in Fig.7 (c) represent sinusoidal voltage waveform.
Table – 2
System Performance before and after Compensation
Condition
Source current (%THD) Neutral Current
(%THD) Power Factor Terminal Voltage(%THD) isa (A) isb (A) isc (A) isn
(A) a b C vta (V) vtb (V) vtc (V) Before
Compensation 13.57 12.48 11.75 0.493 0.991 0.989 0.987 12.58 11.87 12.11 After
Compensation 0.242 0.242 0.243 0.201 1 1 1 2.35 2.35 2.381
The Comparative performance improvement of the system has been shown on the basis of THD reduction before and after compensation in source current, Neutral current, terminal voltage and power factor in the Table 2. The THD of the source currents has reduced from 13.57%, 12.48%, 11.75% to 0.2424%, 0.2424%, 0.2433% and in source voltages has been reduced from 12.58%, 11.87%, 12.44% to 2.35% 2.35% and 2.381% respectively in phases a, b and c. Whereas THD in neutral current is reduced from 0.41% to 0.20%, similarly the p.f. in Phase a, b & c from 0.9913, 0.9895 and 0.9878 to unity in all phases.
VII.CONCLUSION
The power generated from the wind turbine coupled with PMSG improves the power quality of the grid voltages and currents and provides reactive power to the grid to achieve the unity power factor .The control strategy used for Generator VSI i.e. Vector control which provides the control over the generator speed, generated power and extracted maximum power through MPPT.
The control strategy provides the reference current to hysteresis PWM for the gate pulse generation of the Grid VSI in order to provide reactive power compensation, load balancing and achieving unity grid power factor and substantial reduction in the total harmonic distortion (THD) in the source currents and terminal voltages.
REFERENCES
[1] N. R. Tummuru, M. K. Mishra and S. Srinivas, “Synchronization of variable speed PMSG based wind energy conversion system to the grid with power quality improvement features”, IEEE Transactions on Power Electronics, December 16-19, 2012,.
[2] S. Li, T. Haskew, R. Swatloski, and W. Gathings, “Optimal and direct current vector control of direct driven PMSG wind turbine”, IEEE transaction on Power Electronics, vol. 27, no. 5, pp. 2325-2337, May 2012.
[3] M. Haque, M. Negnevitsky and K. Muttaqi, “A novel control strategy for a variable speed wind turbine with a permanent magnet synchronous generator,” in Industry Applications Society Annual Meeting, 2008. IAS’08, Oct 2008, pp. 1-8.
[4] S. Zhang, K,-J. Tseng, D.Vilathgamuwa, T.Nguyen, and X.-Y. Wang, “Design of a robust Grid interface system for pmsg-based wind turbine generators,” IEEE Transaction on Industrial Electronics, vol. 58, no.1, pp.316-328, Jan. 2011.
[5] H. Geng, G. Yang, D. Xu, and B. Wu, “ Unified power control for pmsg-based wecs operating under different grid conditions,” IEEE Transactions on Energy Conversion, vol. 26, no. 3, pp. 822-830, Sept. 2011.
[6] A. Ghosh and A. Joshi, “A new approach to load balancing and power factor correction in power distribution system,” IEEE Transactions on Power Delivery, vol. 15, no. 1, pp. 417-422, Jan. 2000.
[7] Dr. Hari Kumar Naidu “A New Method to Estimate the Grid Network Worst Case Harmonic Impedance Using Genetic Algorithm Technique During Solar Inverter Switching.” International Journal of Electrical Engineering and Embedded Systems, JEEES, Vol.5, No.2, July-Dec 2013.
[8] E. Muljadi and C.P. Butterfield, “Pitch-Controlled Variable Speed Wind Turbine Generation”, IEEE Transactions on Industry Applications, Vol.37, No.1, pp:240-246, January/February 2001.
[9] F. Blaabjerg, Z. Chen, and S. Kjaer, “Power electronics as efficient interface in dispersed power genration systems,” IEEE Transactions on Power Electronics, vol. 19, no. 5, pp. 1184-1194, Sept. 2004.
NOMENCLATURE
Tm Turbine Torque N-m/s)
ρ Air density (Kg/cu.m) Rt Blade radius (m)
V Wind velocity (m/s) Cp Power Coefficient
λ Tip speed ratio β Pitch angle (rad.) ω Rotational speed (rad/s) Ps Source power (watt)
Plavg Load average power
Pµs Micro source generated power (watt)