International Journal of Pharmaceutical and Phytopharmacological Research
(ICV-5.09)ISSN (Online) 2249 – 6084
ISSN (Print) 2250 – 1029
Int.J.Pharm.Phytopharmacol.Res.
2012, 2(2): 109-115
(Research Article)
Development and Validation of Assay Method of Amlodipine Tablet by HPLC
Mohammad Abdul Motalib Momin 1, Mohammad Mostaharul Islam 2, Kazi Habibur Rahman 3, Sharif Md. Anisuzzaman1
1
Department of Pharmacy, Jahangirnagar University, Savar, Dhaka-1342
2Department of Pharmacy, Rajshahi University, Rajshahi, Bangladesh. 3
Faculty of Pharmacy, University of Dhaka, Bangladesh
Received on: 17/10/2012 Accepted on: 31/10/2012
ABSTRACT
A simple, selective and rapid reversed phase high performance liquid chromatographic (RPHPLC) method for the analysis of amlodipine in tablet has been developed and validated. The separation was achieved from octadecylsilyl silica gel, C18 (3.9 mm x 150 mm) column with a mobile phase consisting of HPLC grade acetonitrile, methanol and triethylamine solution (15: 35: 50) at a flow rate of 1ml/min with UV detection at 237nm at 300C column temperature. The method was specific and the assay result of spiked sample (with placebo) was unaffected by the presence of placebo (by comparison with the assay results obtained on unspiked sample). The proposed method was accurate with 100.29% recovery for amlodipine and precise (% RSD of area of system precision, % RSD of assay of method precision and intermediate precision were found 0.33%, 0.34% and 0.17% respectively). From the linearity study the correlation coefficient was found 0.9999, which indicated that the method was linear over 50% to 150% range. The method was found robust for possible changes. Therefore, this method can be used as a more convenient and efficient option for the analysis of amlodipine in tablet dosage form to establish the quality of the drug product during routine analysis with consistent and reproducible results.
Keywords: Method validation, HPLC, Assay, Stability, Amlodipine.
INTRODUCTION
Amlodipine besylate chemically 3-Ethyl 5-methyl (4RS)-2-[(2-aminoethoxy) methyl]-4-(2-chlorophenyl)-6-methyl-1, 4-dihydropyridine-3, 5-dicarboxylate benzenesulphonate is a long-acting calcium channel blocker used for the treatment of hypertension and angina pectoris .1,2,3 Usual maintenance
dosage of amlodipine is 5–10 mg once daily.4,5Amlodipine
acts by inhibiting transmembrane influx of extracellular calcium ions across the membranes of myocardial cells and vascular smooth muscle cells, without changing serum calcium concentrations .6
Validation is a fast growing and evolving subject. Validation is a requirement that has always made sense from both regulatory and quality perspective.7,8 As the analytical
process varies so widely there is no universal approach to validation by regulatory bodies such as FDA and EC for medicinal products have developed general non-mandatory guidelines.9,10The most common reason for validation is to
guarantee as far as possible that all processes and machinery in the pharmaceutical manufacturing process are being used in a way which will ensure safety, integrity, quality and strength of the product for use by the general public.11,12The
official method for estimation of amlodipine includes non-aqueous titration and HPLC.13,14 But analysis of tablet containing amlodipine has not been reported in British Pharmacopoeia or in United States Pharmacopeia. So, the
present work was undertaken with the aim to develop and validate an economic, rapid and consistent reversed-phase high performance liquid chromatographic method with high resolution according to ICH guideline.15
MATERIALS AND METHODS
Reagents and Chemicals
HPLC grade methanol and acetonitrile from Merck, Germany; analytical grade orthophosphoric acid from Sigma Aldrich, Germany and Triethylamine from Scharlau, Spain. Amlodipine besylate working standard (WS) was obtained from Cipla, India. Amlodipine tablet samples were collected from a local market of Bangladesh. Purified water was used for the analytical purpose.
Instrumentation
Method Development
Preparation of triethylamine solution (pH=3.0 ± 0.1)
7 ml of triethylamine was dissolved in 1000 ml of purified water. pH was adjusted to 3.0 ± 0.1 with phosphoric acid and mixed well.
Preparation of mobile phase
HPLC grade acetonitrile, methanol and triethylamine solution was in (15: 35: 50) ratio and filtered through 0.45 m membrane filter.
Chromatographic conditions
In this HPLC method we used octadecylsilyl silica gel, C18 (3.9 mm x 150 mm) column, injection volume 10µl. Detection was carried out at 237 nm and the flow rate was 1 ml/min and the column temperature was 300C.
Preparation of standard solution
50.0 mg of amlodipine besylate standard was taken into a 100 ml volumetric flask. 60 ml mobile phase was added and dissolved with help of sonicator. Solution was filtered through whatman filter paper # 42 and filtrate was collected after discarding first few ml. 5 ml of this solution was diluted to 50 ml with mobile phase.
The standard solution was used as a system suitability solution and the second standard solution similarly prepared to observe the standard reproducibility as a part of system suitability.
Sample preparation
20 tablets were weighed to calculate the average tablet weight. Tablets were grinded to make fine powder. 1.802 g of powdered sample was taken into a 100 ml volumetric flask. 60 ml of mobile phase was added and placed on sonicator for 10 minutes to dissolve. Solution was filtered through Whatman filter paper # 42 and filtrate was collected discarding first few ml. 5 ml of this solution was diluted to 100 ml with mobile phase and mixed well. Before injection, both the standard and sample solution was filtered through 0.45 µm filter (PTFE disc filter).
Method Validation System suitability
System suitability testing is an integral part of analytical procedures. The system was deemed suitable if the following acceptance criteria were satisfied. The relative standard deviation (%RSD) of the peak area responses for amlodipine from five standard solution injections is not more than 2.0%, The tailing factor is not more than 2.0,theoretical plate counts in standard solution is not less than 2000. Reproducibility of standards should be between 98.0% and 102.0%.
Syringe filter evaluation study
Various filter papers along with 0.45 µm syringe filter was studied to select the most suitable combination for the purpose of the filtration of the test solution. Study was done by analyzing assay preparation of sample filtered through different syringe and Whatman filter.
Specificity and linearity
Specificity of an analytical method is its ability to assess unequivocally the analyte in the presence of components
that may be expected to be present. Lack of specificity of an individual analytical procedure may be compensated by other supporting analytical procedures .16
For specificity study identification, placebo interference and comparison of amlodipine raw material or sample with working standard were observed. The linearity of an analytical method is its ability to elicit test results directly proportional to the concentration of the analyte in samples within given range. The linearity was carried out by observing the correlation coefficient (R2) and Intercept value
of standard solution.
System precision
System Precision was carried out by performing replicate Injections (n=6) of the standard solution at 100% of the test concentration and calculating the % RSD of the measured area, theoretical plates and tailing factor.
Method precision
Method precision was assessed by performing replicate assays (n=6) of the amlodipine tablet by preparing six different preparation of the same sample at 100% of the test concentration and % RSD of the assay results were calculated.
Intermediate precision (Ruggedness)
Intermediate precision or ruggedness study of an analytical method is the degree of reproducibility of the test results obtain by the analysis of the same samples under a variety of normal test conditions i.e. different instrument, analysts, column, days, laboratories etc. Sample for intermediate precision was assessed by performing replicate assays (n=6) of the tablet sample by preparing six different preparation of the same sample at 100% of the test concentration and % RSD of the assay results were calculated.
Accuracy
The accuracy of an analytical method is the closeness of test results obtained by that method to the true value. Accuracy may often be expressed as percent recovery by the assay of known, added amount of analyte.Accuracy study was carried out over a range 80%, 100% and 120% (3 concentration/3 replicates each of the total analytical procedure) of test concentration and the % recovery and RSD % recovery of each concentration was measured.
Limit of Detection (LOD) and Limit of Quantitation (LOQ)
Limit of detection is a characteristic of limit tests. It is the lowest amount of analyte in a sample that can be detected, but not necessarily quantitated, under the state experimental condition
Limit of detection and limit of quantitation was based on signal to noise ratio.
Range
Data generated in linearity, precision and accuracy was considered for establishing the range of the analytical method.
Robustness
method was investigated by changing analyst, ratio of components of mobile phase (± 10%), flow rate (± 0.1), wavelength (±3nm), column (different brand or lot), column temperature (± 5ºC) and H (±0.1)
Stability Study
Bench top solution stability study was carried out up to 48 hours.
RESULTS AND DISCUSSION System Suitability
In optimized chromatographic conditions Relative Standard Deviation (%RSD) of area of amlodipine is 0.18 (NMT 2.0%), average Tailing factor is 1.10 (NMT 2.0) and theoretical plate count is 5577 (NLT 2000). Table-1 shows the system suitability data. The five consecutive injections of the standard solution indicated a good system for analysis. The standard reproducibility was 99.08% which is also within the limit.
Table 1:System suitability study
Determinations Retention Time (mins)
Peak area
Tailing Factor
Theoretical plates
1 7.35 969013 1.10 5568
2 7.32 967054 1.10 5599
3 7.31 970433 1.10 5585
4 7.30 966165 1.09 5561
5 7.29 967283 1.10 5572
Mean(n=5) 7.32 967989 1.10 5577
Standard Deviation
(SD) 0.02 1711.87 -
-% Relative Standard
Deviation (%RSD) 0.29 0.18 -
-Reproducibility of Standard: 99.08%
Syringe Filter Evaluation Study
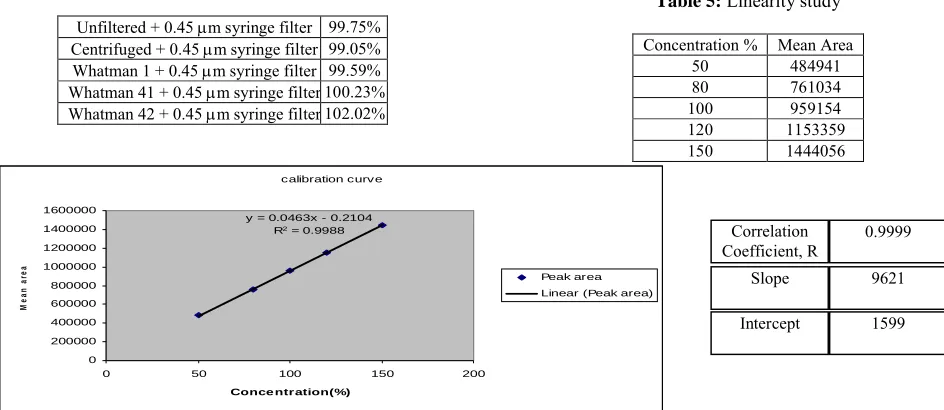
Study revealed that the % recovery obtained with the sample filtered through different filter paper was closer to each other.Table-2 shows the filter paper evaluation study.
Table 2:Syringe filter Evaluation
Unfiltered + 0.45 m syringe filter 99.75% Centrifuged + 0.45 m syringe filter 99.05% Whatman 1 + 0.45 m syringe filter 99.59% Whatman 41 + 0.45 m syringe filter 100.23% Whatman 42 + 0.45 m syringe filter 102.02%
Specificity
From the specificity study, it was observed that the chromatogram for amlodipine RM/sample with amlodipine WS show positive response and Placebo (Blank) show negative response. Assay result was unaffected by the presence of placebo and no peak was co-eluted with principal peak amlodipine. Table-3 and 4 shows the specificity data.
Table 3:Identification (Specificity)
Sl.
No. Component
RT (min)
Remarks (Response)
1. Blank (Diluent) -
-2. Placebo -
-3. Amlodipine WS 7.72 Positive response
4. Amlodipine Raw material 7.73 Positive response
5. Sample 7.72 Positive response
Table 4:Interference due to Placebo (Specificity)
Sl.
No Component
Weight Taken
(mg) RT (min) Area
% Recovery
Purity Angle
Purity Threshold
Peak Purity (passed
/ Failed) 1. Standard 50.00 7.72 932917 - 0.085 1.061 passed
2. Placebo 1802.20 - - -
-3.
Unspike Sample (Only active)
100.03 7.73 934948 99.69 0.079 1.056 passed
4. Spike Sample (Active + Placebo)
1802.81 7.72 933800 99.84 0.082 1.058 passed
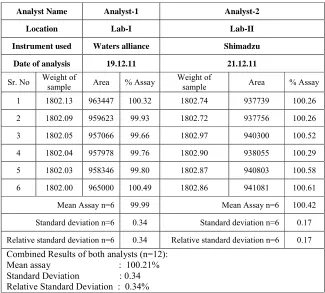
Linearity
Linearity of the method was evaluated from the correlation coefficient of calibration curves that were constructed from mean peak area of amlodipine at different concentrations level (50%, 80%, 100%, 120%, and 150%). Correlation coefficient was 0.9999 which prove that the method is linear that the response is directly proportional to the concentration of analytes.
Table 5:Linearity study
Concentration % Mean Area 50 484941 80 761034 100 959154 120 1153359 150 1444056
calibration curv e
y = 0.0463x - 0.2104 R2 = 0.9988
0 200000 400000 600000 800000 1000000 1200000 1400000 1600000
0 50 100 150 200
Conce ntration(%)
M
e
a
n
a
re
a
Peak area Linear (Peak area)
Figure-1:Graphical representation of linearity of Amlodipine
Correlation Coefficient, R
0.9999
Slope 9621
System Precision
System Precision was performed by replicate injections (n=6) of the standard solution at 100% of the test concentration and calculating the % RSD of the measured area, theoretical plates and tailing factor. Table-6 shows the system precision data. From the data it was observed that the % RSD of area was 0.33 which was well within the acceptance limit of 2.0%. Hence the system was precise.
Table 6:System precision study
Replicate Injection No. Retention Time (mins) Peak area
1 7.32 961192
2 7.32 953679
3 7.32 954253
4 7.32 954023
5 7.32 955052
6 7.32 959256
Mean(n=6) 7.32 956243
Standard Deviation (SD) 0.00 3176.51 % Relative Standard Deviation
(%RSD) 0.02 0.33
Method Precision
The result revealed that the % RSD of assay was 0.34% and individual assay results were 99.66% to 100.49% which were well within the acceptance limit. (Table-7)
Table 7:Method precision
Sample No. Weight of sample (mg) Area % Assay Sample-1 1802.13 963447 100.32 Sample-2 1802.09 959623 99.93 Sample-3 1802.05 957066 99.66 Sample-4 1802.04 957978 99.76 Sample-5 1802.03 958346 99.80 Sample-6 1802.00 965000 100.49
Mean (%) 99.99
SD 0.34
%RSD 0.34
Intermediate Precision or Ruggedness
The intermediate precision of the method was evaluated using different analyst and different instrument in the same laboratory. The results displayed that the % RSD of the assays of two analysts were 0.34 which was within the acceptance limit (not more than 2.0) and the individual assay was within 95% to 105% .So the method was considered to be rugged enough. (Table-8)
Table 8:Table for Intermediate Precision or Ruggedness study
Analyst Name Analyst-1 Analyst-2
Location Lab-I Lab-II
Instrument used Waters alliance Shimadzu
Date of analysis 19.12.11 21.12.11
Sr. No Weight ofsample Area % Assay Weight ofsample Area % Assay
1 1802.13 963447 100.32 1802.74 937739 100.26
2 1802.09 959623 99.93 1802.72 937756 100.26
3 1802.05 957066 99.66 1802.97 940300 100.52
4 1802.04 957978 99.76 1802.90 938055 100.29
5 1802.03 958346 99.80 1802.87 940803 100.58
6 1802.00 965000 100.49 1802.86 941081 100.61
Mean Assay n=6 99.99 Mean Assay n=6 100.42
Standard deviation n=6 0.34 Standard deviation n=6 0.17
Relative standard deviation n=6 0.34 Relative standard deviation n=6 0.17
Combined Results of both analysts (n=12): Mean assay : 100.21% Standard Deviation : 0.34 Relative Standard Deviation : 0.34%
Accuracy
Table 9:Accuracy study
Conc.
Amount added X (mg)
Amount Recovered Y (mg)
% RSD
%
Recovered X² XY
Sample 80%
80.02 80.29
0.13
100.34 6403.20 6424.83 79.98 80.12 100.17 6396.80 6407.82 79.95 80.03 100.10 6392.00 6398.20
Sample 100%
100.03 100.29
0.15
100.26 10006.00 10032.14 99.99 100.14 100.15 9998.00 10013.37 99.97 100.00 100.03 9994.00 9996.91
Sample 120%
119.94 120.52
0.35
100.49 14385.60 14455.55 120.04 120.92 100.73 14409.60 14515.30 119.96 120.21 100.21 14390.40 14420.57
- ∑X
= 899.88
∑Y
= 902.52
-%RSD = 0.22
∑X² =92375.61
∑XY
= 92664.69 ( ∑XY ) − ( ∑X ) ( ∑Y )
% Recovered = --- x 100 = 100.29 % ( ∑X² ) − ( ∑X ) ²
Limit of Detection (LOD)
LOD based on Signal –to- Noise ratio and it was observed that the Signal –to- Noise ratio is 3.17 at 0.011 ppm. So the detection limit was established as 0.011 ppm (0.03%). (Table-10)
Table 10:Table for Limit of Detection
Name of the Compound
Results Signal
–to-Noise ratio ppm % Conc. w.r.t Test Conc. Amlodipine 3.17 0.011ppm 0.03%
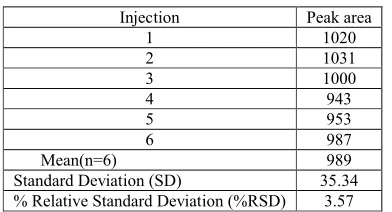
Limit of Quantitation (LOQ)
Limit of quantitation is a characteristic of limit tests. It is the low levels of amount of analyte in a sample that can be quantitated, under the state experimental condition with a suitable precision and accuracy. It is also based on signal-to-noise ratio and it was observed that the Signal –to-Noise ratio is 12.31 at 0.036 ppm. So the quantitation limit was established as 0.036 ppm (0.1%). The method meets the injection repeatability and Accuracy criteria at quantitation level. (Table-11a, 11b, 11c)
Table 11a:Table for Limit of quantitation
Name of the Compound
Results Signal–
to- Noise Ratio
ppm % Conc. w.r.t. test Conc.
Amlodipine 12.31 0.036ppm 0.1%
Table 11b:Table for Injection precision at LOQ level
Injection Peak area
1 1020
2 1031
3 1000
4 943
5 953
6 987
Mean(n=6) 989
Standard Deviation (SD) 35.34 % Relative Standard Deviation (%RSD) 3.57
Table 11c:Table for accuracy at LOQ level
Sample No. Retention Time Area % Recovery
1 7.46 988 96.39
2 7.46 983 95.90
3 7.46 1023 99.80
Mean 97.37
SD 2.1263
%RSD 2.18
The above results revealed that % RSD of 6 replicate injections was 3.16 which was well within the acceptance limit of 10.0% and in accuracy study the % recovery at quantitation , RSD % of recovery were 97.37%, .18% respectively ( within the acceptance limit).
Range
The specified range is normally derived from linearity studies and depends on the intended application of the procedure. It will be established by confirming that the analytical procedure provides an acceptable degree of linearity, accuracy and precision when applied to samples containing amounts of analyte within the extremes of the specified range of the analytical procedure.
The minimum specified range should be considered for the assay of Amlodipine Tablet normally from 80 to 120 percent of the test concentration. Based on the Linearity, precision and accuracy results, the Range of the method can be determined as 80% to 120% of the target assay concentration. (Table-12)
Table 12: Range study
Parameter Concentration Range Acceptance Limit Result
Linearity 50 % to 150% R NLT 0.995 R =0.9999
Method
Precision 100%
% RSD = NMT 2.0
Assay 95% to 105%
% RSD = 0.34% Assay =99.66% to 100.49%
Intermediate
Precision 100%
% RSD of two analyst NMT 2.0
Assay 95% to 105%
%RSD of Assay NMT 2.0
% RSD of 2 analyst = 0.34% Assay =100.26% to 100.61% RSD of assay =0.17%
Based on the above results, it can be concluded that the method provides an acceptable degree of linearity, accuracy and precision when applied to samples in the range of 80% to 120% of the target assay concentration
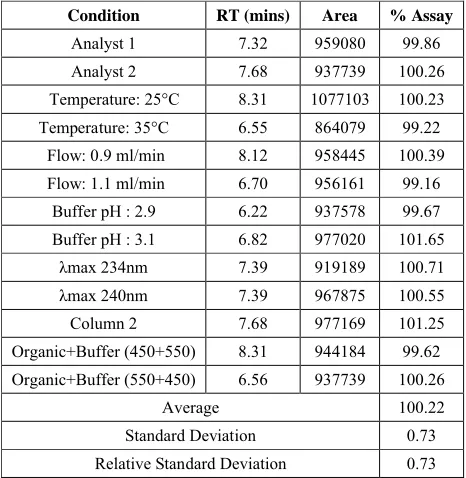
Robustness
Robustness of the method was investigated by changing analyst, changing ratio of components of mobile phase (± 10%), changing flow rate (± 0.1),changing wavelength (±3nm), different column (different brand or lot), column temperature (± 5ºC) and changing pH (±0.1).(Table-13a and 13b)
Table 13a:Data of System suitability (Robustness study)
Condition %RSD of
area
Standard Reproducibility
(%)
Analyst 1 0.18 99.08
Analyst 2 0.10 100.07 Temperature: 25°C 0.32 99.84
Temperature: 35°C 0.43 100.66 Flow: 0.9 ml/min 0.13 99.97 Flow: 1.1 ml/min 0.22 99.84 Buffer pH : 2.9 0.16 99.59 Buffer pH : 3.1 0.12 99.95
λmax 234nm 0.13 98.89
λmax 240nm 0.20 99.19
Column 2 0.10 99.17
Organic+Buffer
(450+550) 0.08 100.93 Organic+Buffer
(550+450) 0.27 100.07
Table 13b:Table for data of Robustness study (% Assay)
Condition RT (mins) Area % Assay
Analyst 1 7.32 959080 99.86 Analyst 2 7.68 937739 100.26 Temperature: 25°C 8.31 1077103 100.23 Temperature: 35°C 6.55 864079 99.22
Flow: 0.9 ml/min 8.12 958445 100.39 Flow: 1.1 ml/min 6.70 956161 99.16
Buffer pH : 2.9 6.22 937578 99.67 Buffer pH : 3.1 6.82 977020 101.65
λmax 234nm 7.39 919189 100.71
λmax 240nm 7.39 967875 100.55
Column 2 7.68 977169 101.25 Organic+Buffer (450+550) 8.31 944184 99.62 Organic+Buffer (550+450) 6.56 937739 100.26
Average 100.22
Standard Deviation 0.73 Relative Standard Deviation 0.73
The above results show that there is no significant change in the system suitability parameters and %assay results during robustness study, so the method is robust.
Stability Study
From the solution stability study it was observed that the test sample solution is found to be stable up to 48 hours at ambient condition. (Table-14).
Table 14:Solution stability study
(Bench top stability of sample solution)
Time Interval % Assay Difference in % Assay w.r.t. initial
Initial 99.86
-After 4 Hrs 99.85 -0.01 After 8 Hrs 100.98 1.12 After 12 Hrs 99.95 0.09 After 18 Hrs 100.18 0.32 After 24 Hrs 101.12 1.26 After 36 Hrs 101.43 1.57 After 48 Hrs 99.20 -0.66 Average 100.32
STDEV 0.77
% RSD 0.77
CONCLUSION
The assay method adopted for estimation of Amlodipine from Amlodipine 5 and 10 Tablet by HPLC is precise, linear, accurate, rugged and robust enough. The sample solution is found to be stable up to 48 hours at ambient condition. Hence this method can be considered validated for its intended purpose to establish the quality of the drug product during routine analysis with consistent and reproducible results.
REFERENCES
1) Budavari S., An encyclopedia of chemicals, drugs and biologicals, in: Merck Research Laboratories, Division of Whitehouse Station, NJ: Merck and Co. Inc, 2001, p. 86. 2) Tripathi K.D., Essential of Medical Pharmacology, 5thEd.,
Jaypee Brothers Medical Publishers (P) Ltd., New Delhi,2003..
3) Williams A. Foye’s Principles of Medicinal Chemistry, 5th Ed., B.I. publications Pvt. Ltd., 2004.
4) Murdoch D., Heel R.C., Amlodipine: a review of its pharmacodynamic and pharmacokinetic properties, and therapeutic use in cardiovascular disease. Drugs, 1991,
41:478-505.
5) Julius S.,. Amlodipine in hypertension: an overview of the clinical dossier. J Cardiovasc. Pharmacol.,1998 ,12
(7):27-33.
6) Michel T., Treatment of myocardial ischemia. in: Brunton L.L., Lazo J.S. and Parker K.L. (eds.) Goodman and Gilman’s the Pharmacological Basis of Therapeutics. 11th ed., McGraw-Hill, USA , 2006, pp.823-844.
7) Fourman, G.L. and Mullen, M.V., .Determining Cleaning Validation Acceptance Limits for Pharmaceutical Manufacturing Operations, Pharm. Technol., 1993, 17(4), 54-60.
8) Munson. J.W., Pharmaceutical analysis, part – B .Marcel Dekar, New York, 1994.
9) SOP Validation studies, Indian Pharma guidance academy Nagpure, 1996, pp. 1-3.
11) Chowdary K.P.K., Himabindul G., Validation of analytical method. Eastern Pharmacist, 1999, pp. 39-41
12) Snyder L.R., Kirkland J.J., Practical HPLC Method development, Wiley inter science publications, New York, 1997, pp. 685-712
13) Indian Pharmacopoeia, Vol. II., Published by the Controller of Publication Delhi, 1996
14) British Pharmacopoeia, Vol. I. Published by MHRA, UK, 2010.
15) 15.International Conferences on Harmonization, Guidance on Validation of Analytical Procedure: Text and methodology, 2005.
16) USP, Validation of compendial methods, in:United States Pharmacopeia XXIII, National Formulary, XVIII, Rockville, MD, The United States Pharmacopeial Convention, Inc,1995, pp.1710–1612.
17) Ravichandran V., Shalini S., Sundramk.M. and Harishrajak .Validation of analytical methods- Strategies and importance. International Journal of Pharmacy and Pharmaceutical Sciences. 2010,2(3), 688-695.
*Corresponding Author: Sharif Md. Anisuzzaman, Lecturer, Department of Pharmacy, Jahangirnagar University
Savar, Dhaka – 1342.