R E S E A R C H
Open Access
Challenges faced with the implementation
of Web-Based Data Query Systems for
population health: development of a
questionnaire based on expert consensus
Manik Ahuja
1*, Robert Aseltine
2, Nicholas Warren
3, Susan Reisine
4, Pam Holtzclaw Williams
5and Andy Cislo
2Abstract
Background:State health agencies (SHA) and local health agencies (LHA) face several challenges with the dissemination of local health data using Web-Based Data Query Systems (WDQS). To help guide future research, this study aimed to utilize expert consensus to identify the most relevant items that contribute to these challenges. Methods:A total of 17 researchers and public health professionals agreed to participate in a three-round Delphi process. In round 1, four topics were represented on a 42-item questionnaire using a 5-point Likert scale, along with free-text responses. Free-text responses were analyzed leading to a series of items for a second Delphi round. Participants were given an opportunity to revise results in round 3 for items that did not meet consensus in round 1 or round 2. Consensus on expert opinions was defined at interquartile range (IQR)≤1.
Results:The experts reached consensus on a total of 21 (50%) of the 42 items presented in the initial questionnaire. Eleven of the 15 (73%) of the items extracted from the free-text responses met consensus. Items in consensus from this pilot study were used to develop an instrument for a broader survey across Behavioral Risk Factor Surveillance System (BRFSS) coordinators across all 50 US states.
Conclusion:Experts confirmed that software development costs, inadequate human resources, data sharing gaps, a lack of political support, and poor data quality contribute significantly to challenges in their data implementation. The findings from this pilot study inform us of items of public health significance that will help guide future research.
Keywords:WDQS, Web-Based Data Query Systems, State public health query systems, Public health, Health surveillance, Public health query systems,“Disseminated”and“public health”, State public health aggregate level data,“State agency” and“public health”,“Data”and“public health agencies”
Background
Local health data can be a powerful vehicle for improv-ing the health of a community [1]. When aggregated, local health data helps monitor the incidence, trends, and patterns and disease in a given population [2]. There is strong evidence that the availability of high-quality population level health data at the local level can lead to targeted interventions, impact public policy decisions [3], reduce health disparities, and improve health care delivery systems [4]. The growth of the Internet over the
last 25 years has made it possible for state agencies to easily share their health data online. One popular method to disseminate health data are Web-Based Data Query Systems (WDQS), which were first implemented in the late 1990s. WDQS are interactive and are customizable, as users are able to pre-select variables of interest [5]. Despite the advantages of WDQS and ad-vancements in information technology, implementation has been limited. States and local health agencies face key challenges including high cost, data sharing, IT in-frastructure, and usability challenges in their dissemin-ation. This paper reports on the relevance of barriers identified in the literature, from the perspective of a * Correspondence:[email protected]
1Brown School of Social Work, Washington University, St. Louis, MO 63110, USA
Full list of author information is available at the end of the article
panel of experts. The results of this pilot study helped formulate an instrument that was administered to Be-havioral Risk Factor Surveillance System (BRFSS) coordi-nators across all 50 US states.
Cost challenges
WDQS are expensive to design, develop, and maintain. To receive funding for health IT-related projects, polit-ical support or“buy in”from relevant stakeholders is ne-cessary [6, 7]. State budgets are generally year to year, which prevents long-term planning for implementation of systems [8–10]. It is critical to secure adequate re-sources in the long term to maintain systems, ensure data are current, and to keep systems operable. The high cost of hardware, software, staffing, and project manage-ment are barriers that contribute to cost challenges.
Data sharing challenges
Data sharing remains a significant challenge for state and local health departments [11]. One of the most difficult challenges is access to complete and usable population health data [11]. Data sharing is necessary in order to have a complete picture of a population’s health at the local level [12]. Barriers to data sharing are caused by both tech-nical and non-techtech-nical factors [12]. Examples of technical factors include missing primary identifiers, disaggregation of indicators, incompatibility of systems, and the inability to identify data elements. Examples of non-technical fac-tors include reluctance of agencies or organizations/hospi-tals to release data, institutional review board issues, as well as legal and political issues [4,12–14].
IT infrastructure and usability challenges
IT infrastructure refers to the composite hardware, soft-ware, network resources, and data storage for IT opera-tions. Adequate data storage is vital as health datasets can consume large amounts of data storage space. Usability problems have also been reported, as systems are often difficult to navigate and use, and data are miss-ing or incomplete [1]. Usability includes the functional-ity, the ability to retrieve data, and the usefulness of these data. Usability is evaluated by user-computer inter-actions and by the degree of successful completion of an intended task [15]. Poor usability may lead to poor per-ception among users, making them less likely to return as future users [16].
The Delphi study
This study aimed to ascertain the importance of barriers that organizations face in the dissemination of local health data. The Delphi method was chosen, due to its suitability for areas of inquiry where incomplete know-ledge exists [17]. It is an iterative, multi-stage, group-oriented process that involves a series of
structured questionnaires [17], designed to transform opinion into group consensus. Using experts, this method seeks to gain a group consensus on a specific topic from individuals as consensus is defined as a“ gen-eral agreement of a substantial majority” [10]. The study involves a series of questionnaires administered to the experts, using multiple rounds. We chose to use a con-trolled feedback method known as “quasi-anonymous feedback,”in which names of the participants are known only to the researcher and not to others in the group [18]. It is known as “quasi” anonymous because complete anonymity cannot be guaranteed, as the re-searcher knows the name of the panel members and their responses. Anonymity among the participants elim-inates problems with bias and peer influence and re-duces the effect of dominant individuals [19]. The study was designed to answer the following question: which topics should be prioritized for future decision-making regarding best practices of WDQS implementation?
Methods
Delphi process
Selection of panel members and recruitment
A purposive sample of 17 experts agreed to participate in this study. Purposive sampling is a non-probability sam-pling that uses the judgement of the researcher to recruit participants. Purposive samples are often used in Delphi studies [20]. Since expert opinion is sought, a purposive sample is necessary when people are selected not to repre-sent the general population, but rather are selected for their expert ability to answer specific research questions [21]. It is recommended that participants have either pub-lished articles, taught courses about the topic, or a profes-sional role related to the area [22]. In the current study, panel members had to have met at leastoneof the follow-ing criteria: (1) have published relevant literature in peer-reviewed scholarly journals or (2) a significant por-tion of their job responsibility involves the disseminapor-tion of local health data using WDQS. We searched online for authors with relevant publications or practitioners, de-rived contact information, and contacted the authors by email. Potential participants working with the dissemin-ation of WDQS were identified through multiple chan-nels. We searched on state and local health department websites along with the Naphsiswebsite, an organization whose mission is to provide health information to improve the public’s health. We searched the Department of Health website from states that have previously imple-mented WDQS and attempted to find knowledgeable staff. All participants were contacted through email.
Ethical consideration
they implicitly consented to participate by completing the questionnaire. They were also informed that their re-sults were confidential as well as their names. Their names are not provided to other participants in the study. The approval for the study was received from the Human Subjects Protection Office at the University of Connecticut Health Center on July 3, 2014, as it was de-termined that the project was exempt from IRB review.
Procedure
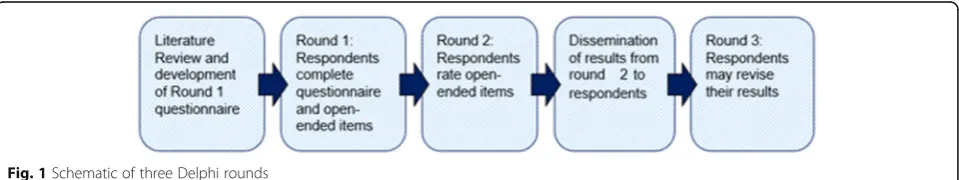
We conducted a three-round Delphi study (Fig. 1). We selected a three-round study, as it is efficient and typical of most Delphi studies [23]. All rounds of the Delphi study were conducted through email, and each question-naire was administered in a Microsoft Word format. Participants were given approximately 1 week to complete each round, and a reminder email was sent fol-lowing the deadline. To ensure strong retention of ex-pert involvement, the study was set at three rounds. It is known that having a planned number of rounds is an in-dicator of good quality in designing a Delphi study [24].
Overview
In the first round, we administered a 42-item question-naire along with an open-ended response section. In the open-response section, participants were able to list add-itional items of importance that were not included in the questionnaire. In the second round, we administered a questionnaire based on a filtered list of open-ended re-sponses from round 1. In round 3, participants were pre-sented a list of items that did not meet consensus in round 1 and round 2. They were given an opportunity to revise their results in order to come to consensus with the group.
Round 1: questionnaire
A four-topic, 42-item questionnaire was administered. There were four categories of topics including cost, data collection, IT infrastructure, and usability. Within each topic were a series of items that were relevant to that topic. Participants were asked to rate the importance they would give to each item on 5-point Likert scale (Unimportant—1; Little importance—2; Moderate im-portance—3; Important—4; Very important—5) or N/A (Not applicable).
Results from the 42-item questionnaire were compiled in Microsoft Excel and then imported to SPSS v 19.0 for analysis. The mean, median, and interquartile range (IQR) were calculated for each item. The IQR is a measure of statistical dispersion, being equal to the difference be-tween the mean score of the upper and lower quartiles, and thus consists of the middle 50% of the observations [25]. An IQR of less than 1 indicates that more than 50% of all responses fall within 1 point on the scale [26]. It is a frequently used measure in Delphi studies, and it is gener-ally accepted as an objective and rigorous way of deter-mining consensus [27]. Items with an IQR of 1 or less can be considered to demonstrate good consensus on a 5-point Likert scale. Items that met consensus in round 1 or round 2 achieved consensus and no further data need to be collected for that item. Items that do not meet con-sensus were carried over to round 3.
Round 1: open-text response section
In the optional open-text response sections, participants listed key barriers they face but were not captured in the initial questionnaire. A cumulative list of all open-text items was analyzed using Microsoft Excel. Qualitative
content analysis was used to identify and interpret themes in the qualitative material. Qualitative content analysis is a technique for systematic text analysis, which uses themes to identify qualitative responses. Re-searchers regard content analysis as a flexible method for analyzing open-ended, qualitative, or text-based re-sponses [28]. As the sample size was relatively small, thus data were manually sorted by project staff, and common themes were formed from these data.
Second round questionnaire
A compiled list of participant-generated items from round 1 was distributed to participants. Participants rated the importance of each item, as previously described. These responses from the round 2 questionnaire were entered into Microsoft Excel and then imported to SPSS v 19.0 for analysis. Items that achieved an IQR of≤1 met consensus, and items with an IQR > 1 were carried over to round 3.
Third round
In the final round of the Delphi process, respondents were provided a list and median score of items from
rounds 1 and 2 that did not meet consensus. Participants were given an opportunity to revise their estimates from rounds 1 and 2. We calculated the mean, median, and IQR after round 3. Items with an IQR ≤1 met consen-sus. Items with an IQR > 1 were not in consenconsen-sus. Participants also were given an opportunity to qualitatively provide a reason if they chose not to revise an estimate.
Results
Participants
Overall, 17 experts agreed to participate in the study. Of the 17 participants that agreed to participate, 15 (88%) of them submitted completed round 1 responses. One further participant dropped out of the study after round 1; 14 par-ticipants (82%) completed both round 2 and round 3. Of the 14 experts who completed the survey, eight had pub-lished literature on the development, evaluation, or the dis-semination of WDQS. Those who published literature included researchers, college/university professors, and others in academia with expertise. The remaining six ex-perts include public health professionals. This group con-sisted of experts such as epidemiologists, health directors, and other key informants in the public health community who were involved in the dissemination of WDQS.
Summary of rounds
Round 1 and round 2
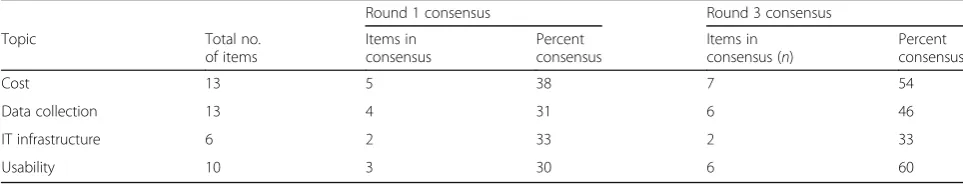
The summary for each round is presented in Table1. This table presents an overview of the scoring for each round. Items that met consensus in rounds 1 and 3 are presented in Table 2. Items that did not meet consensus are pre-sented in Table 3. In round 1, 14 of the 42 (33%) of the items met consensus, and 28 items were carried over (67%) to round 3 because consensus was not reached. In round 2, 10 out of the 15 open-ended items (67%) met consensus and were retained. The five items (33%) that did not meet consensus in round 2 were presented in the round 3 for an opportunity to revise.
Final round
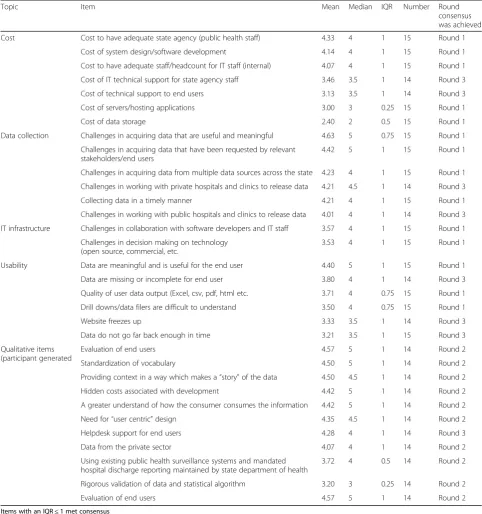
All items that met consensus are shown in Table2. After participants had a chance to revise, consensus was reached in 21 of the 42 items (50%) that were originally presented in round 1. Fourteen of the 21 items met consensus in the
initial round 1, while 7 of these items had met consensus after participants had an opportunity to revise their scores in round 3. Overall, 60% of the usability items presented met consensus, followed by cost (54%), data collection (46%), and IT infrastructure (33%). Of participant gener-ated/open-text response items, overall, 11 of the 15 items (73%) met consensus. Ten items met consensus in round 1, while 1 additional item met consensus in round 3 after participants had an opportunity to revise their score.
Results by topic
Cost
Cost of adequate public health staff (mean = 4.33, IQR = 1), the cost of system development (mean = 4.14; IQR = 1), and IT staff (mean = 4.07; IQR = 1) met consensus and were rated highest. The cost of IT technical support for state agency staff (mean = 3.46; IQR = 1), IT technical support for end users (mean = 3.13, IQR = 1), hardware/servers (mean = 3.00; IQE = 0.25), and cost of data storage (mean = 2.40; IQR = 0.5) met consensus but were rated lower.
Data collection
Acquiring data that are useful and meaningful (mean = 4.63; IQR = 0.75) was rated highest. Other items that met consensus include acquiring data that have been re-quested by end users (mean = 4.42; IQR = 1), acquiring data from multiple sources (mean = 4.43; IQR = 1), col-lecting data in a timely manner (mean = 4.21; IQR = 1), and collecting data from hospitals and clinics.
IT infrastructure
IT infrastructure barriers were rated lower in compari-son to the other domains. Two items achieved consen-sus, including collaboration with software developers to ensure systems needs are met (mean = 3.57; IQR = 1) and challenges in decision-making on software options (mean = 3.53; IQR = 1).
Usability
The most significant barriers to usability pertained to acces-sibility of data. Participants rated the following topics high-est: meaningful and useful data (mean = 4.40; IQR = 1), missing or incomplete data (mean = 3.80; IQR = 1), quality of data output (mean = 3.71; IQR = 0.75) Navigational issues
Table 1Overall consensus from round 1 and round 3 for quantitative items
Round 1 consensus Round 3 consensus
Topic Total no.
of items
Items in consensus
Percent consensus
Items in consensus (n)
Percent consensus
Cost 13 5 38 7 54
Data collection 13 4 31 6 46
IT infrastructure 6 2 33 2 33
including difficulty in interpreting drilldowns (mean = 3.5; IQR = 0.75) and bandwidth issues including websites that freeze up (mean = 3.33, IQR = 1) met consensus but were rated slightly lower.
Discussion
Access to high-quality data is paramount for local health departments, researchers, policymakers, and other key
stakeholders who are involved with the health systems. The results from this pilot study have found that cost and data sharing are the two majors of the most signifi-cant barriers that state agencies face with their dissemin-ation. One way to maximize resources is for state agencies to collaborate with other states. This includes software development, strategy, and forming partner-ships with other states. Through collaboration, states
Table 2Items that met consensus using a 5-point Likert scale
Topic Item Mean Median IQR Number Round
consensus was achieved
Cost Cost to have adequate state agency (public health staff) 4.33 4 1 15 Round 1
Cost of system design/software development 4.14 4 1 15 Round 1
Cost to have adequate staff/headcount for IT staff (internal) 4.07 4 1 15 Round 1
Cost of IT technical support for state agency staff 3.46 3.5 1 14 Round 3
Cost of technical support to end users 3.13 3.5 1 14 Round 3
Cost of servers/hosting applications 3.00 3 0.25 15 Round 1
Cost of data storage 2.40 2 0.5 15 Round 1
Data collection Challenges in acquiring data that are useful and meaningful 4.63 5 0.75 15 Round 1
Challenges in acquiring data that have been requested by relevant stakeholders/end users
4.42 5 1 15 Round 1
Challenges in acquiring data from multiple data sources across the state 4.23 4 1 15 Round 1
Challenges in working with private hospitals and clinics to release data 4.21 4.5 1 14 Round 3
Collecting data in a timely manner 4.21 4 1 15 Round 1
Challenges in working with public hospitals and clinics to release data 4.01 4 1 14 Round 3
IT infrastructure Challenges in collaboration with software developers and IT staff 3.57 4 1 15 Round 1
Challenges in decision making on technology (open source, commercial, etc.
3.53 4 1 15 Round 1
Usability Data are meaningful and is useful for the end user 4.40 5 1 15 Round 1
Data are missing or incomplete for end user 3.80 4 1 14 Round 3
Quality of user data output (Excel, csv, pdf, html etc. 3.71 4 0.75 15 Round 1
Drill downs/data filers are difficult to understand 3.50 4 0.75 15 Round 1
Website freezes up 3.33 3.5 1 14 Round 3
Data do not go far back enough in time 3.21 3.5 1 15 Round 3
Qualitative items (participant generated
Evaluation of end users 4.57 5 1 14 Round 2
Standardization of vocabulary 4.50 5 1 14 Round 2
Providing context in a way which makes a“story”of the data 4.50 4.5 1 14 Round 2
Hidden costs associated with development 4.42 5 1 14 Round 2
A greater understand of how the consumer consumes the information 4.42 5 1 14 Round 2
Need for“user centric”design 4.35 4.5 1 14 Round 2
Helpdesk support for end users 4.28 4 1 14 Round 3
Data from the private sector 4.07 4 1 14 Round 2
Using existing public health surveillance systems and mandated hospital discharge reporting maintained by state department of health
3.72 4 0.5 14 Round 2
Rigorous validation of data and statistical algorithm 3.20 3 0.25 14 Round 2
Evaluation of end users 4.57 5 1 14 Round 2
Items with an IQR≤1 met consensus
can share their software costs and reduce the level of planning, design, and development costs. Another op-tion is for states to use open-source technologies, which are of little or no cost. In addition, through open-source, software coding is easily adaptable and can be available through the public domain.
Acquiring data from private and public hospitals along with other sources across a state was deemed a major bar-rier in this study. This study found that state agencies are faced with challenges in accessing data from multiple sources. According to the Centers for Disease Control and Prevention (CDC), one of the major challenges is to find effective ways of combining multiple sources of complex data [11]. Linking data from multiple sources may help provide information regarding social determinants of dis-ease or key demographic information, which helps give us a more complete description of an affected population [29, 30]. One mechanism to overcome challenges with data sharing is to increase efforts towards open data, which some states have recently adopted. Open data is a repository of data that can be freely used and redistributed by anyone [31]. Open data creates opportunities for ex-change, in which organizations can share their own data, and use other data that are available [32].
Experts from this study agreed that there is a lack of standardization in vocabulary across systems, and users are having a difficult time interpreting data from one system to the other. As an example, one system may use
“ethnicity”and“race”as one variable, while another sys-tem may use them as two separate variables. Another example is one state that may report “percent over-weight,”while another state may report “percent obese.” There is a need for standardization and transparency across systems so researchers can rely on state-level population data and be able to analyze data across states in a meaningful way [6,33].
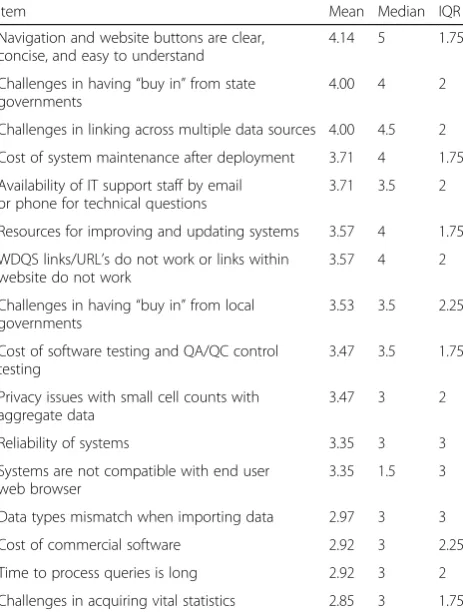
To surprise, several items that were found to be signifi-cant in our literature search did not meet consensus. Items such as buy-in from local and state governments, website usability, resources for maintenance and updating systems, system reliability, and data privacy issues did not meet consensus, even after participants were given an op-portunity to revise. For example, issues around data priv-acy and security have been highly emphasized in academic literature. However, from the perspective of our experts, having access to data that are meaningful and useful was of higher significance than issues around data privacy is-sues. One possible explanation are the recent techno-logical advancements which have led to more robust and improved data protection software and hardware for health data [34]. However, despite the advancements in technology, non-technical problems such as data sharing and costs for system development remain a top priority for state and local health agencies.
Overall, results from this pilot study provided us the requisite knowledge for a subsequent study administered to Behavior Risk Factor Surveillance Systems (BRFSS) coordinators across all 50 US states in 2015. Items that were in consensus derived from this pilot study were in-strumental in developing our survey, as the results help guide the subsequent study.
Conclusions
Past research highly emphasized technology-centered problems, such as usability, bandwidth, and slow com-puter processors, as barriers to implementation. However, information technology has substantially improved, mak-ing it easier to design and develop systems. It is imperative that greater investment into health data systems be made at the local and community level. Greater access to these data may help key stakeholders understand health prob-lems of a community and subpopulations. This knowledge has the potential to facilitate prevention efforts and tar-geted interventions at the local and community levels.
Abbreviations
LHA:Local Health Agency; SHA: State Health Agency; WDQS: Web-Based Data Query Systems
Table 3Items that did not meet consensus after round 3
Item Mean Median IQR
Navigation and website buttons are clear, concise, and easy to understand
4.14 5 1.75
Challenges in having“buy in”from state governments
4.00 4 2
Challenges in linking across multiple data sources 4.00 4.5 2
Cost of system maintenance after deployment 3.71 4 1.75
Availability of IT support staff by email or phone for technical questions
3.71 3.5 2
Resources for improving and updating systems 3.57 4 1.75
WDQS links/URL’s do not work or links within website do not work
3.57 4 2
Challenges in having“buy in”from local governments
3.53 3.5 2.25
Cost of software testing and QA/QC control testing
3.47 3.5 1.75
Privacy issues with small cell counts with aggregate data
3.47 3 2
Reliability of systems 3.35 3 3
Systems are not compatible with end user web browser
3.35 1.5 3
Data types mismatch when importing data 2.97 3 3
Cost of commercial software 2.92 3 2.25
Time to process queries is long 2.92 3 2
Challenges in acquiring vital statistics 2.85 3 1.75
Items with an IQR > 1 did not meet consensus
Availability of data and materials
Data and materials are available upon request.
Authors’contributions
MA is the lead author and contributed to the design, analysis, and writing. RA is the principal investigator and contributed to the design, analysis, and writing. NW, ScD, and SR contributed to the design, analysis, and writing. PHW and AC contributed to the analysis and design. All authors read and approved the final manuscript.
Ethics approval and consent to participate
The approval for the study was received from the Human Subjects Protection Office at the University of Connecticut Health Center on July 3, 2014, as it was determined that the project was exempt from IRB review.
Consent for publication
Consent was obtained from all participants included in the study to publish their individual data.
Competing interests
The authors declare that they have no competing interests.
Publisher’s Note
Springer Nature remains neutral with regard to jurisdictional claims in published maps and institutional affiliations.
Author details
1
Brown School of Social Work, Washington University, St. Louis, MO 63110, USA.
2Center for Population Health, University of Connecticut Health Center,
Farmington, CT 06032, USA.3Division of Occupational and Environmental
Medicine, University of Connecticut Health Center, Farmington, CT 06032, USA.
4
Division of Behavioral Sciences and Community Health, University of Connecticut Health Center, Farmington, CT 06032, USA.5Department of Nursing,
University of Arkansas Medical Sciences (UAMS), Little Rock, AR 72205, USA.
Received: 20 November 2017 Accepted: 5 June 2018
References
1. Luck J, Chang C, Brown ER, Lumpkin J. Using local health information to promote public health. Health Aff. 2006;25(4):979–91.
2. Diamond CC, Mostashari F, Shirky C. Collecting and sharing data for population health: a new paradigm. Health Aff (Millwood). 2009;28:454–66. 3. van Panhuis WG, Paul P, Emerson C, et al. A systematic review of barriers to
data sharing in public health. BMC Public Health. 2014;14:1144.https://doi. org/10.1186/1471-2458-14-1144.
4. Portnoy B, Lee SJC, Kincheloe J, Breen N, Olson JL, McCormally J, Brown ER. Independent state health surveys: responding to the need for local population health data. J Publ Hlth Mangmnt Pract. 2014;20(5):E21–33. 5. Friedman DJ, Parrish RG. Characteristics and desired functionalities of state
web-based data query systems. J Public Health Manag Pract. 2006;12:119–29. 6. Nsubuga P, White E, Thacker SB. Public health surveillance: a tool for
targeting and monitoring interventions. Washington, DC: World Bank Publishers; 2006. p. 997–1015.
7. Bates DW. The quality case for information technology in healthcare. BMC Med Inform Decis Mak. 2002;2:7–7.
8. Frieden TR. Six components necessary for effective public health program implementation. Am J Public Health. 2014;104(1):17–22.
9. Kern LM, Barron Y, Abramson EL, Patel V, Kaushal R. HEAL NY: promoting interoperable health information technology in New York State Health Aff (Millwood), 2009, vol. 28 (pg. 493–504).
10. Groseclose SL, Buckeridge DL. Public health surveillance systems: recent advances in their use and evaluation. Annu Rev Public Health. 2017;38:57–79. 11. Savel TG, Foldy S. The role of public health informatics in enhancing public
health surveillance. MMWR Surveill Summ. 2012;61(2):20–4. 12. Vest JR, Issel D. Data sharing between local health and state health
departments: developing and describing a typology of data gaps. J Public Health Manag Pract. 2013;19(4):357–65.
13. Edelstein M, Lee LM, Herten-Crabb A, Heymann DL, Harper DR. Strengthening global public health surveillance through data sharing. Emerg Infect Dis. 2018 Jul [date cited]. DOI:https://doi.org/10.3201/eid2407.151830.
14. Bernstein AB, Sweeney MH. Centers for Disease Control and Prevention. Public health surveillance data: legal, policy, ethical, regulatory, and practical issues. MMWR Surveill Summ. 2012;61:30–4.
15. Hornbæk K. Current practice in measuring usability: challenges to usability studies and research. Int J Hum-Comput Stud. 2006;64(2):79–102. 16. Hui SLT, See SL. Enhancing user experience through customisation of UI
design. Procedia Manuf. 2015;3:1932–7.https://doi.org/10.1016/j.promfg. 2015.07.237.
17. Hasson F, Keeney S, McKenna H. Research guidelines for the Delphi survey technique. J Adv Nurs. 2000;32:1008–15.
18. Lofmark A, Thorell-Ekstrand I. An assessment form for clinical nursing education: a Delphi study. J Adv Nurs. 2004;48(3):291–8.
19. Fischer RG. The Delphi method: a description, review and criticism. J Acad Librarianship. 1978;4(2):67–70.
20. Brady SR. Utilizing and adapting the Delphi method for use in qualitative research. Int J Qual Methods. 2015;14:1–6.
21. Palinkas LA, Aarons GA, Horwitz SM, Chamberlain P, Hurlburt M, Landsverk J. Mixed method designs in implementation research. Adm Policy Ment Health Ment Health Serv Res. 2011;38:44–53.
22. Gibbs W, Graves P. Evaluation guidelines for multimedia courseware. J Res Technol Educ. 2001;34(1):2–17.
23. Jones J, Sanderson C, Black N. What will happen to the quality of care with fewer junior doctors? A Delphi study of consultant physicians’views. J R Coll Physicians Lond. 1992;26(1):36–40.
24. Diamond IR, Grant RC, Feldman BM, et al. Defining consensus: a systematic review recommends methodologic criteria for reporting of Delphi studies. J Clin Epidemiol. 2014;67:401–9.
25. Sekaran U. Research methods for business. A skill building approach. 4th ed. New York: John Wiley & Sons; 2003.
26. De Vet E, Brug J, De Nooijer J, Dijkstra A, De Vries NK. Determinants of forward stage transitions: a Delphi study. Health Educ Res. 2005;20(2):195–205. 27. Von der Gracht HA. Consensus measurement in Delphi studies. Technol
Forecast Soc Chang. 2012;79:1525–36.
28. Cavanagh S. Content analysis: concepts, methods and applications. Nurse Researcher. 1997;4(3):5–16.
29. Harrison K, Dean H. Use of data systems to address social determinants of health: a need to do more, vol. 126; 2011. p. 1–5.
30. Krieger N, Chen JT, Ebel G. Can we monitor socioeconomic inequalities in health? A survey of U.S. health departments’data collection and reporting practices. Public Health Rep. 1997;112:481–91.
31. Mayernik M. Open data: accountability and transparency. Big Data Soc. 2017;4(2):1–5.https://doi.org/10.1177/2053951717718853.
32. Kostkova P, et al. Who owns the data? Open data for healthcare. Front Public Health. 2016;4:7.
33. Birkhead GS, Klompas M, Shah NR. Uses of electronic health records for public health surveillance to advance public health. Annu Rev Public Health. 2015;36:345–59.