• No results found

Assessment of Empirical Methods of Runoff Estimation by Statistical test (Case study: BanadakSadat Watershed, Yazd Province)

N/A
N/A
Protected

Academic year: 2020

Share "Assessment of Empirical Methods of Runoff Estimation by Statistical test (Case study: BanadakSadat Watershed, Yazd Province)"

Copied!
16
0
0

Loading.... (view fulltext now)

Full text

(1)

Volume 7, Issue 1, (2019) pp. 71-86

71 | Page Case Report

Assessment of Empirical Methods of Runoff Estimation

by Statistical Test (Case study: BanadakSadat

Watershed, Yazd Province)

Khabat Khosravi

1*

, Haidar Mirzai

2

, Iman Saleh

1

1Ph.D. student of Watershed management Engineering,Faculty of Natural Resources, Sari

Agriculture Science and Natural Resources University,Sari, Mazandaran, Iran.

2Assistant Profesor of Razi University, Faculty of Natural Resources, Kermanshah,

Kermanshah, Iran.

*Corresponding Author E-mail: [email protected]

Received: 20 November 2018, Revised: 30 December 2018, Accepted: 14 January 2019

ABSTRACT

Runoff estimation resulted from precipitation is the basis of more study in various develop and exploit design from water resource, then its measure and calculation due to environmental bottlenecks, always have a plenty problem. As a result of the importance of output runoff estimation and flood volume in watershed for the sake of country integrated watershed management in this study tried to 9 empirical methods of runoff estimation implemented in Banadaksadat and this provided result with observation runoff from Hydrometric station in watershed outlet have been evaluation by paired t-test, MD, BIAS, RE and RMSE tests then selected best model in Banadaksadat watershed to runoff height estimation that it’s have a most efficiency and precision. After preparation of necessary maps in GIS environment and Statistical test implementation in SPSS software, result showed that LACEY method with MD, BIAS, RE and RMSE value 0.016, 0.007, 4.36 , 0.026 respectively and also no significant difference with observation data in 95%confidence level, with runoff height equal to 1.53 cm, 2.29 MCM runoff volume and 18.79%runoff coefficient , determine the best empirical model to runoff estimation in the case study. The sensitivity analysis using Excel software was used for LACEY model to determine the influential reachs, according to the get result, F/Z parameter in 6-8, 8-10 and 18-20 reachs have a most effect in the model output.

Keyword: Runoff Estimation, Empirical method, Banadaksadat Watershed, GIS, SPSS,

Sensitivity Analysis.

Introduction

(2)

72 | Page

analysis and water resources management. The relationship between precipitation and runoff is a complicated and non-linear relationship which is depended on several factors. Forecasting and determination of the quantitative amount of created and transported runoff to the outflow point of watershed are very important (Ghafari et al., 2009; khayam and molavi, 2004; and velayati et al., 2004). In order to control and conduct the runoff also, to discharge and transporting surface flows to a proper location which is out of the region, various models have been developed and used by a plenty of researchers of scientific organizations throughout the world (Minras, 1975; Neshat, 2001). With regard to provide water demands, the importance of surface floods and runoffs in arid areas is really high. Usually, the floods in arid and semi-arid regions are short-time and basic flows are too low and perhaps there is no basic flow at all because, the rivers mostly are temporary or a kind of torrent. Using empirical models for estimating annual runoff in those watersheds in which there is no hydrometric station, has been recommended since several years ago and each empirical model is developed for a special watershed (Bajalan, 2005). Also, the accuracy and efficiency of each model is needed to be tested before using in other watersheds (Jandaghi and Mohammadi, 2007). In arid regions, water cycle has more speed and is formed in the absence of vegetative cover, soil and water management (Rahbar and Maasoudi, 2006). Recent studies have shown that, soil erosion and runoff are related with rainfall intensity, amount of precipitation, ground surface cover and vegetative cover also, soil erosion is more affected than runoff (Nearing et al., 2005). Davarirad (2006) evaluated the efficiency of some empirical methods and announced that, including Khosla, Coutgine, Turc , I.C.A,R, Justin and Lacey in the watershed of Namak lake and announced that I.C.A.R, Coutagine, Justin and Turc methods have more accuracy respectively comparing to other methods and Khosla method has not been proper. Zare et al. (2008) in addition to explain Khosla, Coutgine, Turc and Langbin formulations announced that, sometimes these methods have error compared to constant universal methods. Evaluation and measuring the amount of runoff and flow in watersheds is very important therefore, runoff estimation is needed for using empirical equations in the watersheds without measurement station. The purpose of this study is to apply various empirical methods of runoff estimation and to evaluate them with regard to observed amounts using statistical tests in Banadaksadat watershed. After determining a proper method, the other goal of this study is to apply sensitivity analysis on selected model and to determine the most effective parameter in the model in order to have more accuracy when the most effective parameter is being measured and achieving more proper results.

Materials and Methods Study area

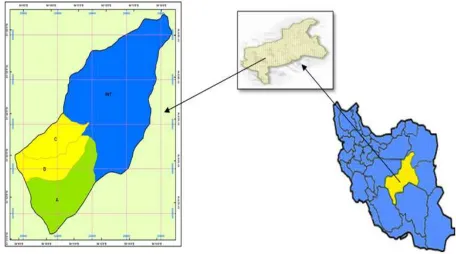
Area of the studied region is 39.32 km2 located in western south of Mahriz city, Yazd

(3)

73 | Page Figure 1. The situation of Banadaksadat in the province and Iran

Methodology of study

When the rain is occurring, runoff height in arid regions is achieved from the amount of precipitation minus evaporation and infiltrated water. Therefore, the mean precipitation of watershed area should be calculated firstly. For calculation of the mean precipitation of watershed area, the average of recorded precipitations by installed stations should be calculated. A method for calculating average is Tisen multi-aspects method (Jafari et al., 2009).

Evaluation of empirical models in annual runoff estimation

Empirical models include relationships and equations which have been determined using analysis of limited data and the region characteristics, and the models are used to estimate some special probabilistic parameters. Most of these methods are useful for a special zone so, it is not possible to use them for other areas. But, some of these methods have more expanded domain and can be used for some same regions by applying some corrections and choosing proper coefficients. There are several empirical models have been developed in order to estimate surface runoff (extra flow). The mentioned methods are divided to four categories including:

1. Surface runoff coefficient

2. Relationships between precipitation and runoff 3. The methods about surface flow shortage

4. The methods about to use physiographic characteristics

(4)

74 | Page

about surface flow shortage and methods about to use physiographic characteristics present more acceptable results considering physical and climatic factors.

1- Surface runoff coefficient

The simplest method for surface runoff estimation is to use surface coefficients. In other words, in this method the surface runoff estimation is a percentage of precipitation considering the parameters affecting runoff. The most important coefficient of those have been presented in this method, were suggested by Strange, Barlu, Bini and Rudier in various regions and Barlo coefficient has been recommended for tropical regions (Bashul, 2002).

2- Relationships between precipitation and runoff

A number of hydrologists presented their achieved results as some relationships between precipitation and annual surface runoff with this suppose that physical characteristics of the watershed is constant. In this context, there are plenty of relationships including Engli D, Souza, Dehir-Ehiuja-Majumdar, Irrigation Department of India, Institute of Irrigation Research of India, Paker and etc.

2.1) Engli D, Souza

These two scientists presented the following relationships in plains and mountains of Maharshtera region located in India (Mutereja, 1986):

(1)For highlands:

R0.85P30.5 (1)

(2) For plain areas:

254 P ) 8 . 17 P (

R  

(2)

Where:

P is annual precipitation by cm, and R is annual runoff by cm

2.2) Department of irrigation, India

Management of Reihand plan presented the following relationship between the amount of annual precipitation and runoff of Reihand River (Gupta, 1992):

RP1.17P0.86 (3)

Where:

(5)

75 | Page 3. Relationships about annual surface flow shortage

In these relationships it is assumed that, the amount of surface runoff flowing out from concentration point of a watershed is the difference between precipitation and annual surface flow shortage. Overlay, annual surface flow shortage includes physical and physiological evaporation which is affected by some factors like temperature, topography, geology and vegetative cover.

The most important methods in this context are Turc, Coutagine and Khosla.

3.1) Turc relationship

Mr.Turc presented following relationship for watersheds with the area less than 300 km2

based on achieved results from doing a study on 254 watersheds in various climatic and weather conditions.

2

0.9 ( )

P D

P LT

(4)

LT30025T0.05T3 (5)

RPD (6)

Where:

P is annual precipitation by cm, T is mean temperature by ˚C, R is annual runoff by cm and D is annual flow shortage.

3.2) Coutagine relationship

Coutagine also after doing many studies on various watersheds, presented a general relationship as below (Alizade, 2009):

2

D   PP (7)

1 0.8 0.14 T  

  (8)

RPD (9)

Where:

P is annual precipitation by m, T is mean temperature by ˚C, R is annual runoff by m, and D is annual flow shortage.

(6)

76 | Page 3.3) Khosla method

In this method, the amount of mean annual runoff is calculated by following formula:

3.74

T R  P

(10)

Where:

R is mean annual runoff of watershed by cm, P is mean annual precipitation by cm, and T is mean annual temperature by ˚C.

4) Runoff calculation using physiographic characteristics

Physiographic characteristics of each watershed including slope, length of main waterway, soil type and vegetative cover, are the most important controller factors of potential for producing surface runoff therefore, it is possible to determine a relationship between a watershed annual surface runoff and the factors mentioned above.

The most important presented relationships consist Indian Council of Agricultural Research (I.C.A.R), Justin, Lacy, World Meteorological Organization (WMO), and Soil Conservation Service (SCS) which estimates runoff resulted from individual precipitations so, this relationship is not concerned in this study.

4.1) Indian Council of Agricultural Research (I.C.A.R) method

This method has been presented based on studying the amount of 17 watershed annual runoff in Neilgiri region that was conducted by Indian Council of Agricultural Research:

1.44 0.63 0.66

2.05 2.05 1.34

15.19 f a

P A H

R

F L T

   

   (11)

Where:

P is annual precipitation by cm, R is annual runoff by cm, A is the watershed area by km2,

∆H is maximum height difference of watershed, Ff is the factor of watershed shape, T is

mean annual temperature by ˚C, and La is the length of main waterway by km.

4.2) Justin relationship

Justin conducted extensive researches on the relationships between annual precipitation and runoff in several watersheds with various climatic situations. He presented his achieved results as a general formula as below:

2 0.155

(1.8 32)

P

R K S

T

  

  (12)

0.5

H S

A

(7)

77 | Page

Where: K is regional coefficient, A is the watershed area by m2, ∆H is maximum height

difference of watershed by m, S is watershed slope, T is temperature by ˚C, P,R are precipitation and runoff respectively by cm. Regional coefficient (K) can be calculated using available data from hydrometric stations of adjacent watershed. Concerned parameters for calculating (K) are mean annual precipitation (P) and mean annual temperature (T).

4.3) Lacey relationship

Lacy; the Indian scientist, presented following formula based on several studies in various watersheds in order to estimate annual runoff:

304.8

1 ( )

P R

F

P Z

 

(14)

Where: R is annual runoff by cm, P is mean annual precipitation, F is a parameter related to durability of precipitation, and Z is a coefficient related to physiographic characteristics. Values of F/Z have been presented in Table1.

Table.1. Suggested coefficients of Lacey method

4.4) World Meteorological Organization (W.M.O) relationship

This method is based on studies which were conducted in desert and arid regions of the US and is applicable for the other same areas around the world as WMO has recommended. In other words, this method is applicable for those regions with the temperature above zero.

(15) Where: P is mean annual precipitation by cm, T is mean annual temperature by ˚C, and R is mean surface runoff by cm. Annual runoff can be calculated using estimated ratios in Table 2.

Durability of

precipitation Land type of the watershed Long Medium Short

6 4 2 Including plateaus, flat plains with deep soils and proper vegetative cover

2.5 1.67 0.83 Almost flat with semi-deep soil and vegetative cover of pasture plants

1.5 1 0.5 Relatively high hills with shallow soil weak vegetative cover

0.88 0.58 0.23 Sandy lands with lots of gravels and steep slopes in high lands

(8)

78 | Page Table 2. Estimated ratios in W.M.O relationship

14 12

10 8

7 6

5 4

3 2

1 0

9 7

5 3.4 2.7

1.9 1

0.415 0.2

0.75 0.026

0.009

Statistical tests

In order to evaluate the results and to determine a proper model, in this research the coupled t-test, mean deviation (MD), mean deference (BIAS), percentage of relative error (RE) and Root mean square error (RMSE) were used that more will be explained.

The Paired Sampel t-Test

Overall relationship of this test is as below:

(16)

Where d is mean difference of Paired Sampel observations and Sd is standard deviation of differnces.

This test was carried out using SPSS 18 software. - Mean deviation (MD):

(17)

Where QO is observed values, Qe is estimated values and n is the number of samples

- Mean difference (BIAS):

(18)

Where EO is observed values, Eeis estimated values and n is the number of samples

- Percentage of relative error (RE):

(19)

Where QO is observed values and Qe is estimated values

-Root Mean square error (RMSE):

(20)

(9)

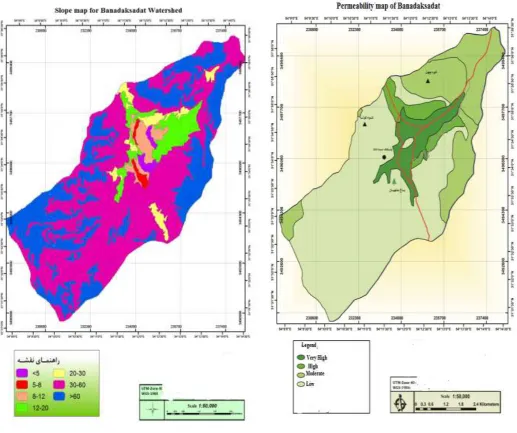
79 | Page Figure 2. Slope map Figure 3. Permeability Map

Results

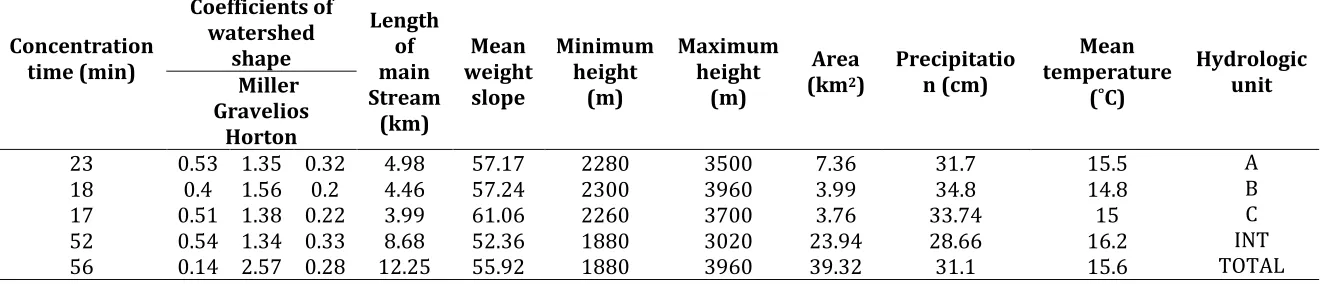
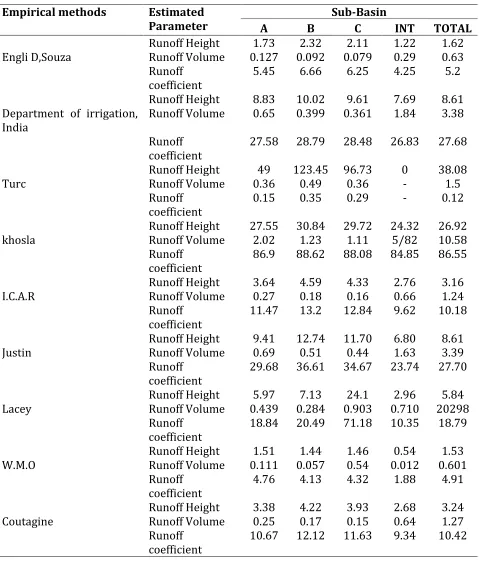
Required and main characteristics of the watershed have been presented in Table 3. With regard to previous explained formulas, calculation of runoff height, runoff volume and runoff coefficient were conducted for each sub-basins of Banadaksadat watershed. The

(10)

80 | Page Table 3. Physiographic characteristics of each studied hydrologic unit

Concentration time (min)

Coefficients of watershed

shape

Length of main Stream

(km)

Mean weight

slope

Minimum height

(m)

Maximum height

(m)

Area (km2)

Precipitatio n (cm)

Mean temperature

(˚C)

Hydrologic unit Miller

Gravelios Horton

(11)

81 | Page Table 4. The results of calculating empirical formulations in Banadaksadat sub-basin.

Empirical methods Estimated

Parameter A B Sub-Basin C INT TOTAL

Runoff Height 1.73 2.32 2.11 1.22 1.62 Engli D,Souza Runoff Volume 0.127 0.092 0.079 0.29 0.63

Runoff

coefficient 5.45 6.66 6.25 4.25 5.2 Runoff Height 8.83 10.02 9.61 7.69 8.61 Department of irrigation,

India Runoff Volume 0.65 0.399 0.361 1.84 3.38 Runoff

coefficient

27.58 28.79 28.48 26.83 27.68

Runoff Height 49 123.45 96.73 0 38.08 Turc Runoff Volume 0.36 0.49 0.36 - 1.5

Runoff

coefficient 0.15 0.35 0.29 - 0.12 Runoff Height 27.55 30.84 29.72 24.32 26.92 khosla Runoff Volume 2.02 1.23 1.11 5/82 10.58

Runoff

coefficient 86.9 88.62 88.08 84.85 86.55 Runoff Height 3.64 4.59 4.33 2.76 3.16 I.C.A.R Runoff Volume 0.27 0.18 0.16 0.66 1.24

Runoff

coefficient 11.47 13.2 12.84 9.62 10.18 Runoff Height 9.41 12.74 11.70 6.80 8.61 Justin Runoff Volume 0.69 0.51 0.44 1.63 3.39

Runoff

coefficient 29.68 36.61 34.67 23.74 27.70 Runoff Height 5.97 7.13 24.1 2.96 5.84 Lacey Runoff Volume 0.439 0.284 0.903 0.710 20298

Runoff

coefficient 18.84 20.49 71.18 10.35 18.79 Runoff Height 1.51 1.44 1.46 0.54 1.53 W.M.O Runoff Volume 0.111 0.057 0.54 0.012 0.601

Runoff

coefficient 4.76 4.13 4.32 1.88 4.91 Runoff Height 3.38 4.22 3.93 2.68 3.24 Coutagine Runoff Volume 0.25 0.17 0.15 0.64 1.27

Runoff coefficient

10.67 12.12 11.63 9.34 10.42

Results of statistical tests

(12)

82 | Page

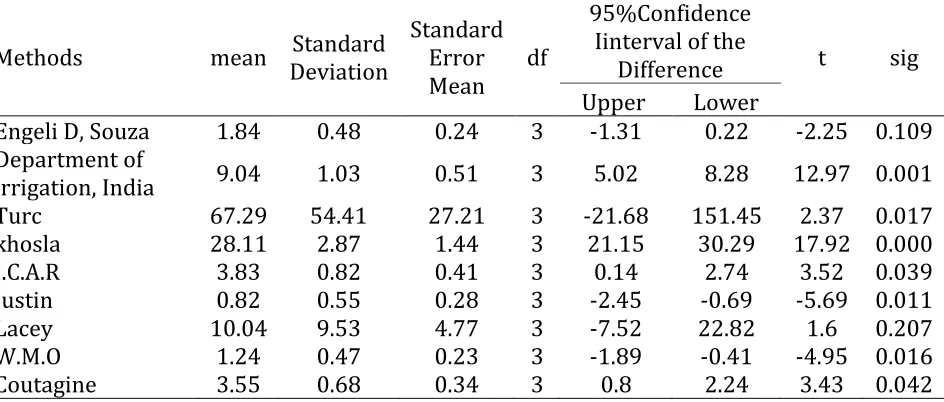
SPSS software have been shown in Table 6 and the results from other statistical methods including MD, BIAS, RE, and RMSE have been presented in Table 7. The results shown in Table 7 are significant by confidence of 95% and in table 8 the best model is the one with lowest amount of MD, BIAS, RE and RMSE.

Paired sampel t-test

Table 7. The statistical results of Paired sampel t- test for runoff estimation methods with

observed data in Banadaksadat wate rshed

Methods mean Standard Deviation Standard Error Mean

df

95%Confidence Iinterval of the

Difference t sig Upper Lower

Engeli D, Souza 1.84 0.48 0.24 3 -1.31 0.22 -2.25 0.109 Department of

irrigation, India 9.04 1.03 0.51 3 5.02 8.28 12.97 0.001 Turc 67.29 54.41 27.21 3 -21.68 151.45 2.37 0.017 khosla 28.11 2.87 1.44 3 21.15 30.29 17.92 0.000 I.C.A.R 3.83 0.82 0.41 3 0.14 2.74 3.52 0.039 Justin 0.82 0.55 0.28 3 -2.45 -0.69 -5.69 0.011 Lacey 10.04 9.53 4.77 3 -7.52 22.82 1.6 0.207 W.M.O 1.24 0.47 0.23 3 -1.89 -0.41 -4.95 0.016 Coutagine 3.55 0.68 0.34 3 0.8 2.24 3.43 0.042

Table 8. The results of statistical methods including MD, BIAS, RE and RMSE for used

empirical models in Banadaksadat watershed.

Evaluation of empirical runoff estimation equations in the watershed with regard to standards of comparison, in each standard for the most suitable method the lowest rank and for the worst method the highest rank is considered. By putting the ultimate resultsin the table, it is possible to consider the method with the lowest rank in all standards, as the most suitable method. The results is shown in Table 9 (Esmaeiliouri, 2011).

Methods MD BIAS RMSE RE

Engeli D, Souza 0.038 0.016 0.060 8.778

Department of

irrigation, India 1.036 0.435 1.642 72.24

Turc 5.948 2.488 9.424 93.72

khosla 4.088 1.710 6.477 91.12

I.C.A.R 1.191 0.080 0.303 92.58

Justin 1.035 0.434 1.643 72.25

Lacey 0.016 0.007 0.026 4.36

W.M.O 0.143 0.060 0.227 56.20

(13)

83 | Page Table 9. Ultimate results of ranking various empirical runoff estimation methods in

Banadaksadat watershed Evaluatio

n Standard

Engeli D, Souza

Departme nt of irrigation,

India

Turc Khosla I.C.A.R Justin Lacey W.M.O Coutagine

RMSE 2 6 9 8 5 7 1 4 3

BIAS 2 7 9 8 5 6 1 4 3

MD 2 6 9 8 7 5 1 3 4

RE 2 5 9 7 8 6 1 4 3

Total 8 24 36 31 25 24 4 15 13

Priority 2 5 8 7 6 5 1 4 3

Sensitivity analysis

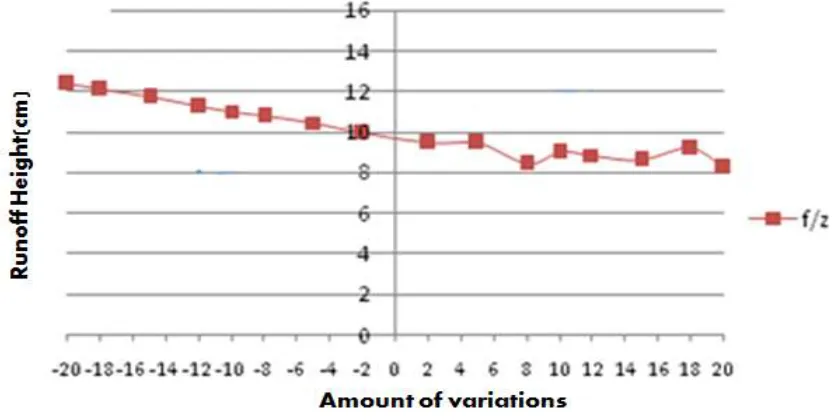
In order to do sensitivity analysis a parameter varies between its up and down limits while, another parameter (parameters) remains on its average. So it is possible to find the effect of a variation on outputs. In fig.4 sensitivity analysis graph has been shown. The line with higher slope is more sensitive. As it is obvious from fig. 5, in sensitivity analysis of Lacey formula for parameter F/Z it can be seen that, in variations of 6-8, 8-10 and 18-20 percent, Lacey model is very sensitive about parameter F/Z.

Figure 4. Sensitivity analysis of Lacey model

Discussion and Conclusion

(14)

84 | Page

suitable model among tested models in studied watershed that, was conducted using coupled t-test, MD, BIAS, RE and RMSE. The results shown in tables 7, 8, 9 show that, Lacey model with amounts of 0.016, 36.007, 4.0, 0.026 for MD, BIAS, RE and RMSE respectively, is the best model (with a runoff height by 1.53 cm, a runoff volume by 2.29 million m3 and a

runoff coefficient by 18.79%) for runoff height estimation in Banadaksadat and had the most efficiency and accuracy. Also with regard to coupled t-test performance, having no significant difference in a level of 95% confidence confirms the results above which is correspondent with Bashul(2002), Fath Zade (1999) and Ghazavi(2003) results. Ghazavi (2003)did not consider Coutagine method and corrected Langbin method, as suitable methods in arid regions and Khosroshahi(1991) has mentioned the estimation by I.C.A.R is more than observed varieties, this case is more obvious in the watersheds which are larger than 200 km2. Also, FathZade (1999) considered classic Coutagine and Turc approaches as

non-suitable methods with significant errors. In this research, according to the results of statistical tests Engli D, Souza method introduced as the best method after Lacy method, for runoff calculation in the studied area. Results above also, agree with achieved maps (Fig 1 and Fig2) which can be used for more accuracy of Lacy model results. The advantage of Lacey model is the application of combined effect of factors related to time interval of precipitation and physical characteristics of watershed. Flood nature of rivers of arid and semi-arid regions confirms the precipitation with high intensity and short time. Totally, the methods which are based on surface runoff coefficient and the relationship between precipitation and runoff are mostly local and are applicable by special physical and climatic conditions. But, considering physical and climatic results, the runoff estimation methods using surface shortage and physiographic characteristics present more acceptable results.

Refrences

Alizade, A. (1989). Principle of Applied Hydrology. Mashhad, Ghods Boniad Press. Pp. 860

Bajlan, A, Mahmoudian shooshtary, M, avlipoor, M, (2005).Monthly runoff predictions with artificial neural network (ANN) and compare its results with empirical methods in watershed kasilian,5th Iranian Hydraulic Conference. 877-885.

Bashul, R, (2002).empirical models usage to estimate annual runoff of rivers in arid and semi- arid of Iran, Articles Collections of the Sixth Seminar on River Engineering, Shahid Chamran

Davarirad, AA, (2006). Calibration of empirical relations for estimating runoff and compare them with mathematical models to estimate the height of elevation. Second Conference on

Water Resources Management.

Esmaili Ouri, A, Samiei, M, (2011). Assessment of empirical methods of runoff estimation in Tangesoye watershed in Fars provience, Articles Collections of the Seventh National

(15)

85 | Page

Fathzadeh, A, (2008). Comparision of Kotain and turc method with its conversion methods in dry land, master's thesis, Tarbiat Modarres University, college of Natural Resources and Marine Sciences.

Ghaffari, G, Karimizadeh, K, Fathi, G, Heydari, (2010). Comparision of Runoff Volume From Empirical Methods by Observation Data. Articles Collections of the Sixth National Conference on Watershed Management Science and Engineering, Tarbiat Modarres University.

Ghazavi, GH, Abasali, V, (2003). Determination of best estimation anual runoff empirical method no station watershed in semi-arid land in darab provience. Journal of Natural

resources and agriculture science, 10(3):10-25.

Khayam, M, Molavi, A, (2004). Runoff Quantitative Analysis in Saeedabadchai watershed.

Journal of Geography and development, 376:78-91.

Khosroshahi, M, (1991).water balance Calculation in small watershed areas and no hydrometric stations using empirical formulas in the Khorasan region, M.Sc Thesis, Department of Natural Resources, Tehran University.

Mahdavi, M, (2006). Applied Hydrology, Vol 1, Tehran university press.

Minras, JR, principle of Hydrology, Sedghi, H., Shahidchamran university press.

Mohamadi, M, Jandaghi, N, (2010). Comparison between runoff output from Khozla method and observation data in west Golestan provience watersheds. Articles Collections of the 5th

National Conference on Watershed Management Science and Engineering.

Mutereja, KN, (1986). Applied Hydrology. Tata Mc Graw- Hill, pp. 498-506

Nearing, MA, Jetten, V, Baffaut, C, Cerdan, O, Couturier, A, Hernandez, M, Lebissonnias, Y, Nicols, MH, Nunes, JP, Renschler, CS, Souchere, V, VanOost, K, (2005). Modelling response of soil erosion and runoff to change in precipitation and cover. Catena, 61:131-154.

Neshat, M, (2001). Use of SCS method for estimating the absorption and excretion of water and Design flood hydrograph in Baghemalek Watershed. drainage &Irrigation Master’s

thesis, Islamic Azad University, Research Science. 109pp.

Rahbar, A, Masoudi, M, (2008).Trend of river runoff Changes in the Kordan watershed. Iranian journal of Range and desert Research, 16(2):173-161.

Velayati, S, (2002). Water geographical, Jahad press of mashhad university.

Gupta, Bl, (1992). Engineering Hydrology, 2nd edn, Estimation of runoff, 4:63-64.

W.M.O.(1994). Guide to Hydrological Practice, 5th Edn, pp. 447-448.

(16)

86 | Page change on ecosystems Caspian conference, Sari University of Agricultural Sciences and

Natural Resources.

How to cite this article: Khabat Khosravi, Haidar Mirzai, Iman Saleh, Assessment of

Empirical Methods of Runoff Estimation by Statistical Test (Case study: BanadakSadat Watershed, Yazd Province). International Journal of Advanced Biological and Biomedical

Figure

Figure 1. The situation of Banadaksadat in the province and Iran
Table 2. Estimated ratios in W.M.O relationship
Figure 2. Slope map                                                                         Figure 3
Table 3. Physiographic characteristics of each studied hydrologic unit
+4

References

Related documents

The study was conducted using the survey model because its aim was to determine the TPACK of pre-service teachers in the departments of primary school elementary school teaching

Home theater experts agree that a theater-like experience is only achieved when the screen size is large enough with respect to the viewing distance from the screen – generally, when

How- ever, in section 4.3 we sample 10,000 words from the Reuters corpus and find the average number of synonyms, hypoynms, hypernyms, holonyms and meronyms associated with each

Finally, experiments were carried out to test the effectiveness of the proposed method and the results indicated that the proposed method can effectively extract the

In the present review we first summarize results identifying the PUFA binding site on K + ion channels, the molecular determinants that determine the affinity and potency within the

existem também variações fisiológicas encontradas nestes fenótipos, que podem ser confundidas com condições pa- tológicas e que devem ser reconhecidas a fim de se evitar

The idea is that firstly compute the latent representations of each node via graph attention networks with multi- heads self-attention strategy combined shortest path

Overall model performance and experimental results Combining the results from the experiments with penalty sweeps, immigration trials, and sub- setting approaches introduced to the