THE EFFECT OF KNOWLEDGE CREATION ON BANK PERSONNEL PERFORMANCE
Ali Shayesteh1* & Hamidreza Yaghubi2
1*Department of Management, Science and Research Branch, Islamic Azad University, Saveh, Iran 2Human Resources Department, Sarmayeh Bank, Tehran, Iran
Correspondence Author:[email protected]
Keywords:Knowledge Management, Knowledge Creation, Organizational Performance, Human Capital, Bank Personnel
Abstract
Today, organizations try to find new tools as solutions in order to survive. Knowledge management is a solution, which can help organizations to achieve their aims. This solution can reform functional specifications for organizations via giving the ability of “more intelligent performance”. To do so, this research has reviewed the effect of knowledge creation on the performance of staffs working at Sarmaye Bank as one the financial firms in Tehran. This research is a kind of practical, descriptive and non-experimental survey. The data gathered from research questionnaires. Richardson and Cronbach’s Alpha method used to validate the questionnaire. In addition, structural equation model with the help of AMOS software used to analyze the gathered data. The results showed that the process of knowledge creation has a positive and meaningful effect on staff performance.
Introduction
A definition of knowledge management is "collection of activities that contributed to the company's knowledge of inside and outside of the Organization to be achieved". Knowledge management to the process of capturing the collective intellectual and refers to specializations in organization and use them to foster innovation through continuous organizational learning. (Raheh, 2009). The knowledge creation (Newman 1999): A new knowledge behavior to the human – or social system has a wide range in size, such as the discovery, summon and development as well as closely linked to the behavior that is called innovation
Performance management
Performance management is a strategic process to improve the performance of people who work in the organization and with the development of individual and group capabilities, provides resistant organizations success. In fact, the difference in performance management and performance evaluation is that the performance we focus on evaluation of a person's work performance and behavior, measure it to be out of standards, But in performance management the objective is that the performance of the individual in the direction of the Organization's ideals and strategic goals. Therefore, based on the organizational goals for people also set targets and are supposed to keep their asses continually in order to not out of object ives of the Organization. The system performance evaluation and performance management is closely associated with the reward system, promotions and motivate their employees. In recent years human resource management experts have performance management insight that course within philosophy, performance management, performance evaluation, determine the amount of merit and the order of merit, and promotions are also in order to feature. In other words to manage the performance of ongoing review of the activities of the personnel and work schedule during the period of evaluation, performance measurement and personnel evaluation at the end of the course to provide the necessary guidance to improve the outcome of the work consists of three stages is as follows:
1. Functional planning: setting goals and the instruction at the beginning of the program and the formulation of plans to achieve the goal.
2. Training: to understand and recognize the power of right and wrong as the person finds everything clearly and doesn't imitate blindly.
3. Revision of performance: overall evaluation of the performance for a period of time, to carry out three super duties, manager should act appropriateness for each staff. (Herci , Blanchard. 1998:512 )
Performance evaluation:
Different definitions in connection with the performance evaluation have been considered, some of them are as follow:
1. Evaluation of performance or merit employees is systematic measurement and regular work people in relation to how to do their duties at the assigned jobs and determine their potential for growth and improvement. (Mir Sepasi, 1383: 223)
2. Performance evaluation ( evaluation) is adaptation of employee's behavior and his career responsibilities and expected behavioral structure of him (evaluation of government employees form , 1373 : 260)
3. The order of performance evaluation is process which is employees during special times have been investigated. (Sa'adat, 1375 :21)
4. Performance evaluation can be used as an instruction to select and program evaluation in progress.
One of the objectives of the performance evaluation program is giving feedback, create job satisfaction, collect ive participation and adherence to the rules of regulation is to eventually lead to improving the performance of human resources organization. As well as performance evaluation of manager and staff of each organization, make an opportunity to review their career behavior and planning some programs to edit shortcomings that authorities may caused.
Purpose:
Determine the impact of knowledge creation on employees of Sarmayeh Bank of the capital city of Tehran
Hypothesis
Knowledge creation has an effect on employees of Sarmayeh Bank. In this study have been used two tools for data collection:
Evaluation of the documents: Methods of documents has been used obtain general information on the organization including history, number of personnel, educational status, regulations, etc. Also, other information in literature of review, theoretical framework, and to determine the subject index of resources available in the library, which contains books, journals and dissertations and scientific reports, it has been used. The questionnaire: In this study data collection is a questionnaire which after a library based on the theoretical study of questionnaire in cooperation with supervisor and experts were planning. This questionnaire consists of three parts: The first part consisted of 5 questions with general questions, including gender, age, educational level and office background of respondents. The second part consists of 6 questions in accordance with the creation of knowledge management as described in table 1. In addition, the third part consists of 26 questions in accordance with the following table (2) dimensions of staff performance.
Table 1- creation of knowledge management questionnaire
Scale for assessment of attitudes The number of questions Dimensions
The five Likert scale (1) completely disagree (2) disagree
(3) unsure
(4) completely agree (5) agree
6 Knowledge creation
Table 2- staff performance dimensions questionnaire
Scale for assessment of attitudes Question number
The number of
questions Dimensions Row
The five Likert scale
(1) completely disagree (2) disagree
(3) unsure
(4) completely agree (5) agree
1-4 4 Ability 1
7-5 3 Understanding 2
9-8 2 Support 3
10-15 6 Motivation 4
16-19 4 Feedback 5
20-24 5 Validity 6
25-26 2 Compatible 7
Demographic characteristics of the respondents
Gender
The results of the analysis of demographic data show that among the respondents the men's group is the higher frequency. This category of respondents with 91 people in total, made 52% of the total volume of the sample that have given. In contrast, women with an abundance of 84 people made 48% of the sample. Many indicators related to both gender groups in the following table are provided:
Table 3-gender distribution of respondents
Valid percentage Percentage Frequency Gender
48 48 84 Woman
Marital status
Check the respondent's marital status specified that in total 175 people who were participating in the study, 133 people (76%) were married and the rest of them (24% or 42 people) are singles. On this basis, the number of respondents who has married status is more than unmarried in this study. Many indicators related to the subjects in terms of marital status are presented in the following table.
Table 4-marital status
The Valid percentage Percentage The frequency Marital status
76 76 133 Married
24 24 42 Single
100 100 170 Total
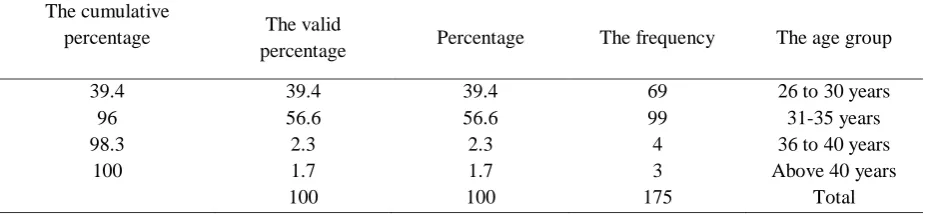
Age
The results of the analysis of demographic data show that most of the respondents are in 31-35 years old have showed great frequency. This group with frequency of 99 people assigned 56.6 percent of the total sample size. . In front of 40 years old group of respondents and older, with a frequency of 3 members (1.7% of the total), compared to other age groups is the lowest.
Table 5-Age of the respondents
The cumulative
percentage The valid
percentage Percentage The frequency The age group
39.4 39.4 39.4 69 26 to 30 years
96 56.6 56.6 99 31-35 years
98.3 2.3 2.3 4 36 to 40 years
100 1.7 1.7 3 Above 40 years
100 100 175 Total
Education level
Among the 175 people who were accused in the present study, the respondents group that has been at the level of undergraduate education, compared to other educational groups has a higher frequency. This group of respondents with frequency of 127 people, or are included .72.6 percent of the total respondents. In contrast, the Group of respondents who have a doctoral levels, with only 1 person the frequency, assigned. 0.6 percent of the total volume. Also the frequency index for other academic groups is provided in the following table:
Table 6-The level of respondent's education
The cumulative percentage
The valid
percentage Percentage The frequency Education level
5.7 5.7 5.7 10 Diploma
78.3 72.6 72.6 127 B. A
99.4 21.1 21.1 37 M. A
100 0.6 0.6 1 PhD
100 100 175 Total
Service Office
Table 7-serving officer in the subjects
The cumulative percentage
The valid
percentage Percentage The frequency Service Office
93.7 93.7 93.7 164 5 to 10 years
98.8 5.1 5.1 9 10 to 15 years
100 1.1 1.1 2 more than 20 years
100 100 175 Total
Reviews of causal relationships between variables
To assess the casual relationship of research or hypotheses testing of structural equations model detection with the Amos software has been used. The results of this assessment will be presented.
Hypotheses testing
The hypothesis of the research has been expressed to the following form:
• Knowledge creation has an effect on employees of Sarmayeh Bank. The result of hypothesis test presented in the following table:
Table 8-Preliminary model of hypothesis testing factor
Confidence
level Critical T The standard error Estimate
*** 4.205 .035 .149 Knowledge
creation ---> Performance As well as the standard of the preliminary model of hypothesis, testing factor is also provided in the following table:
Table 9- The preliminary model of hypothesis testing factor
Standardized coefficient
.284 Knowledge creation ---> Performance
The following table shows process the preliminary model of hypothesis test indicators
Table 10- process the preliminary model of hypothesis test indicators
The status of the model Calculated for model Acceptable value Indicators process
Adverse process 0.476 0.08 and less RMSEA
Adverse process 0.185 0.9 and above CFI
Adverse process 40.359 3 and less Chi 2- degree of freedom
The preliminary model for process indicators is below acceptable levels and so it went on, the model can be modified. Results of the modified model based on the software suggestions presented in the following table:
Table 11- The coefficient of the final model hypothesis testing (not standard)
Confidence level Critical T The standard error Estimate
.003 2.987 .050 .149 Knowledge
creation --->
Performan ce The following table suggests the standard coefficient of for relationships between variables (the hypothesis).
Table 12- Standard coefficient of final model hypothesis testing The standard error
.256 Knowledge creation ---> Performance
Table 13- the final model hypothesis testing
The status of the model Calculated for model Acceptable value Indicators process
Optimal process 0.928 0.9 and above GFI
Optimal process 0.907 0.9 and above CFI
Finally, in summary it can be stated that:
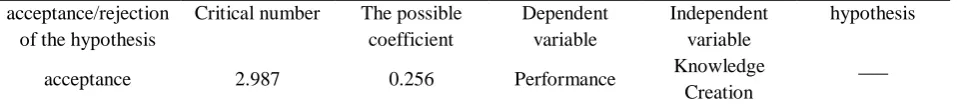
• Knowledge Creation has a positive impact of (γ = 0.256) and significant (T = 2.987, > 1.96) on the performance of employees, and therefore, the hypothesis of the research placed support.
Summary of the results of research hypothesis testing
The following table summarizes the results of research hypothesis testing
Table 14-Summary of results of hypothesis testing acceptance/rejection
of the hypothesis
Critical number The possible coefficient
Dependent variable
Independent variable
hypothesis
acceptance 2.987 0.256 Performance Knowledge
Creation
___
The impact knowledge Creation on the performance of employees
To determine the distribution of the normal variables, or non-normal distribution of the research data and evaluation was used a major test of numerical methods namely Colomograph-Smironoph and Shapiro-Vilik tests. This tests various amounts of each independent variable (create knowledge management) could adopt to complete that shows all the values of the independent variables are equal to (make knowledge management) distribution variable dependent was normal and so the condition of normal distributed for the data can be supported. Hence the test to perform, precondition of normal distributed for the data was selected for this study. The Effect of Knowledge Creation on Personnel’ Performance, even at the highest levels of decision-making in countries and organizations in the literature review of research is emphasis (Bonaccorsi & Daraio, 2007) and ultimately organizations and the people who are create organization's performance, also they will used the knowledge creation consequently in their improvement of individual performance. Studies by j. Zahir and colleagues (2012) also confirm this. In addition the knowledge creation in the Organization to being stored on the one hand, adds, the organizational knowledge On the other hand provides that information from your organization and it is best compatible with future needs and so it was not too far away from the expectation that such a positive influence to achieve.
References
1. Bonaccorsi, Andrea, & Daraio, Cinzia. (2007). Universities and strategic knowledge creation: Specialization and performance in Europe: Edward Elgar Publishing.
2. Bonaccorsi, A., Daraio C., Lepori, B. Slipersaeter, s. (2007). "Indicators on individual Higher Education Institutions. Addressing data problems and compatibility issues", Research Evaluation, Vol. 16, No. 2,1, June 2007, pp. 66-78.
3. Hersey, p. & Blanchard, K. H. (1988). management of organizational behavior: utilizing human resources (5th ed). Englewood cliffs, NJ: prentice- Hall.
4. Newman, B. (1999). "Managing knowledge: The HR Role," HR Executive Review, vol. 6, no. 4, pp. 3-18.
5. Rahe, Martin (2009). "Subjectivity and cognition in knowledge management", Journal of Knowledge Management, Vol. 13, No. 3, pp. 102-117.
6. Mirsephasi, N (2004). Strategic human resource management and work relations with regard to globalization trend. Tehran, Mir Publication.