PIC Simulation Study of Merging Processes of Two
Spheromak-Like Plasmoids
∗
)
Ritoku HORIUCHI, Toseo MORITAKA and Shunsuke USAMI
National Institute for Fusion Science, Toki 509-5292, Japan
(Received 25 December 2017/Accepted 25 March 2018)
Two different types of merging processes of spheromak-like plasmoids (SPs) without any external guide-field (toroidal) component, which are confined in a rectangular conducting vessel, have been investigated by means of two-dimensional PIC simulation, i.e., counter-helicity merging and co-helicity merging processes. The merging time scale is given by the transit time for ion sound wave to travel from the center of SP in the initial profile to the reconnection point for both cases. Through the counter-helicity SP merging process, toroidal magnetic field energy is effectively converted to thermal energy, while the energy transfer rate is suppressed to lower value for the co-helicity case because most of the toroidal magnetic field energy does not dissipate in the merging process. The reconnection process is impulsive for both cases, and, thus, the released energy is locally distributed around field lines connected to a reconnection point and forms the high temperature region with a spatial structure dependent on Larmor radius and the merging processes.
c
2018 The Japan Society of Plasma Science and Nuclear Fusion Research
Keywords: spheromak, counter-helicity merging, co-helicity merging, PIC simulation, magnetic reconnection, energy transfer
DOI: 10.1585/pfr.13.3403035
1. Introduction
Physics of magnetic reconnection have been studied typically through two approaches. One is an experimen-tal study using merging processes of two spheromak plas-mas [1] or spherical tokamak plasplas-mas [2]. The other is a particle-in-cell (PIC) simulation study in an open sys-tem [3, 4], which mimics the vicinity of the reconnection point in the merging process. Two approaches have so far clarified common pictures of magnetic reconnection [1–4]. However, because these studies have been carried out based on different configurations, we should be careful in comparing the results of the two approaches. For ex-ample, in contrast to collisionless reconnection in an open system [3, 4], most of the plasma and energy are confined inside a newly formed plasmoid after the merging in the experiments. Furthermore, because the magnetic energy available for the merging process is limited, reconnection itself is time-dependent and becomes impulsive in some cases. On the other hand, we can realize constant recon-nection phenomena in an open system by supplying the en-ergy from the outside of a system constantly. These char-acteristics in the merging processes reveal new features of magnetic reconnection different from those in an open sys-tem.
In this paper we have extended our PIC simulation model and applied it to the two different types of merg-ing processes of two spheromak-like plasmoids (SPs),
author’s e-mail: [email protected]
∗)This article is based on the presentation at the 26th International Toki Conference (ITC26).
which are confined in a conducting rectangular vessel, i.e., counter-helicity merging and co-helicity merging pro-cesses.
2. Simulation Model
Our PIC simulation model is implemented on two-dimensional Cartesian coordinates (x,y). The perfect con-ductor wall is located at the boundaries of the x-axis (x=±128dx), and the periodic condition is adopted at the boundaries of they-axis (y = ±512dy), wheredxanddy
(=dx) are the grid separations along thex-axis andy-axis, respectively. Two SPs, which satisfy an MHD equilibrium condition, are located along they-axis inside a conducting rectangular vessel at initial stage. After solving the Grad-Shafranov equation in terms of the poloidal flux function Ψ(x,y), initial magnetic fieldB(x,y) and thermal pressure
P(x,y) are given by the following equations as
B=(∂Ψ/∂y,−∂Ψ/∂x,Bz), (1)
Bz=Bpφα, p=paxφ, (2)
whereφ(x,y)=(Ψ−Ψlim)/(Ψax−Ψlim), andα(=1.6),
(=1.2),Ψax,Ψlim, andpaxare constant parameters. The
pa-rameterpaxis determined so that the average plasma beta
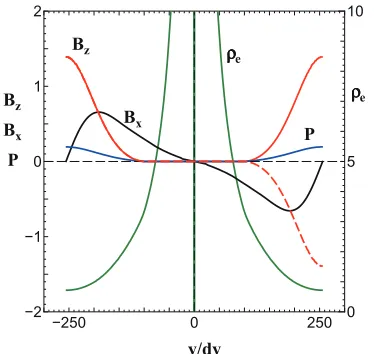
is equal toβ = 0.2. Figure 1 plots the spatial profiles of magnetic fields, thermal pressure, and electron Larmor ra-dius along the line connecting the centers of two SPs for the co-helicity (solid) and counter-helicity (dashed) merg-ing cases. The poloidal current density (Jx,Jy) and toroidal magnetic fieldBzin one SP have an opposite sign to those in the other SP for the counter-helicity case. The
ini-c
Fig. 1 MHD equilibrium solution for the co-helicity (solid) and counter-helicity (dashed) merging processes. The spatial profiles of magnetic field (Bx,Bz), thermal pressure (P),
and electron Larmor radius (ρe) are plotted along the line
connecting the centers of the two SPs.
tial conditions for the PIC simulation are obtained from the MHD equilibrium solution by assuming that electric current density consists of the force-free and diamagnetic components, the force-free component is carried only by electrons, and particle temperature and number density sat-isfy the following relations as
Te=Ti=constant, ne=ni. (3)
The number of space grids is (256×1024), and the total number of particles is 0.2 billion, including the uniform background particles of 20 per each space cell. The aspect ratio of the simulation box isYleng/Xleng = 4.0. We have
carried out eleven simulation runs for different mass ratio
Mi/Me(=100,200,400,800) and two types of the
combi-nation of magnetic helicity to clarify the roles of ion and electron dynamics for the co-helicity and counter-helicity cases. That is, two series of simulation runs were carried out to clarify the roles of (1) the electron dynamics and (2) the ion dynamics for the counter-helicity merging. On the other hands, a series of the simulation runs were carried out to clarify the role of the ion dynamics for the co-helicity merging. For example, when the electron dynamics is ex-amined, the electron parameters vary according to the mass ratio while keeping the ion parameters such as the ion Lar-mor radius constant.
3. Counter-Helicity Merging
It is well-known from the experimental studies [1] that the field-reversed configuration (FRC) is formed as a result of counter-helicity merging of two spheromaks which have the magnetic helicity of the same amplitude but opposite sign. First, let us examine the relaxation process of two SPs to one FRC-like plasmoid by using the PIC simula-tion. Figure 2 demonstrates the time evolution of the
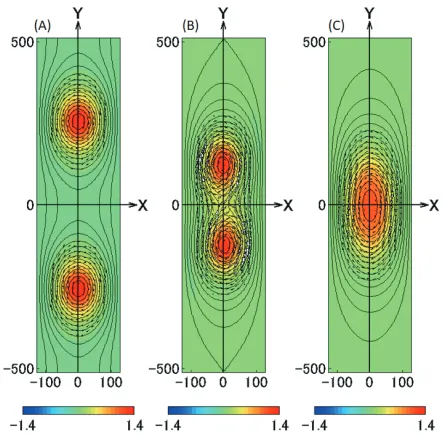
mag-Fig. 2 Time evolution of magnetic field and poloidal electron flow velocity for the counter-helicity merging case of Mi/Me = 400, where the color contours, lines, and
ar-rows stand for toroidal magnetic fieldBz, poloidal
mag-netic field lines, and electron flow velocity in (x,y) plane, respectively. Thex- andy-coordinates are normalized by the grid separationsdxanddyalong thex-axis andy-axis, respectively. Time evolves from the left to the right, i.e., (A)ωpit=0, (B)ωpit=230, and (C)ωpit=920.
netic field and the poloidal electron flow velocity (vx,vy) for the counter-helicity merging case of Mi/Me = 400.
Two SPs have the opposite electron rotation in poloidal plane, sustaining toroidal magnetic fields with the opposite sign. Magnetic reconnection takes place at the interface re-gion, where electrons flow in the positivex-direction. Be-cause most of the electrons are magnetized and their mo-tion drags magnetic field lines as soon as they leave the reconnection region, a reconnection point moves towards the positivex-direction. Thex-axis corresponds to the ra-dial direction in the toroidal system, and the motion of the reconnection point agrees with the counter-helicity experi-ment in MRX [5] and the Hall-MHD simulation study [6]. Both the toroidal magnetic field and the poloidal current density disappear and only the toroidal current sustaining the poloidal magnetic field exists after the merging. In this way, the FRC-like plasmoid is generated as a result of the counter-helicity merging of two SPs.
Figure 3 shows the time evolution of integrated en-ergies for the same case with Fig. 2, where the red, blue, green, black, orange, black dashed curves stand for the magnetic field energy (Wmag), the electric field energy
(Wefld), the ion kinetic energy (Wki), the ion thermal
en-ergy (Wti), the electron kinetic energy (Wke), the electron
thermal energy (Wte), respectively. The energy is averaged
Fig. 3 Time evolution of integrated energies for the counter-helicity merging case of Mi/Me = 400. The energy is
averaged over the confinement region, and expressed in an arbitrary unit.
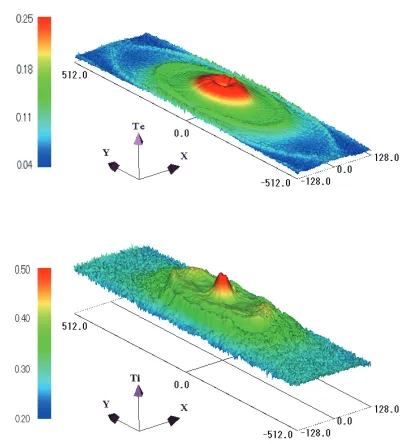
Fig. 4 Perspective view of electron (top) and ion (bottom) tem-perature profiles in the (x,y)-plane atωpit=920 for the
counter-helicity merging case ofMi/Me =400, where a
height and a color stand for the particle temperature.
through the merging process, the total energy integrated over the confinement region is not conserved at the merg-ing. Through the counter-helicity SP merging process, toroidal magnetic field energy is effectively converted to particle thermal energy. In particular, ion thermal energy becomes twice as much as electron thermal energy. It is also found that the relaxation time scale is almost inde-pendent of the electron mass for the counter-helicity merg-ing cases. Figure 4 demonstrates the perspective view of electron (top) and ion (bottom) temperature profiles in the
Fig. 5 Electron-mass dependence of the average electron (red) and ion (blue) temperatures after the counter-helicity merging, where the initial electron and ion thermal ve-locities are also plotted by black and green curves.
(x,y)-plane atωpit = 920 for the same case with Fig. 2,
where the particle temperature is defined by the average of the diagonal components of the pressure tensor divided byni/eMec2. The ion temperature profile is peaked at the
center, while a ring-shaped structure appears around the center in the electron temperature profile. Because the connection process is impulsive as seen in Fig. 3, the re-leased energy is locally distributed around a field line con-nected to a reconnection point when the reconnection rate becomes maximum. As soon as the electrons leave the re-connection region, they are magnetized and move along the field lines. Thus, high-temperature electrons distribute in a ring-shaped region formed around the center of the merged plasmoid. On the other hand, since the field-null region exists near the center and most of the ions are not magnetized there, the ions heated in the reconnection re-gion can easily move into the field-null rere-gion and form a peaked temperature profile at the center. It is well-known that high-temperature ions in the field-null region execute a betatron motion and play an important role in stabilizing the tilting instability as one of the most dangerous MHD instabilities in the FRC plasma [7, 8]. It is interesting to note in Fig. 4 that high-temperature ions exist also out-side the confinement region, while the electron tempera-ture is very low there. This is because the ion frozen-in condition is violated in a relatively wider region around the reconnection point compared with the electrons, and the ions heated through magnetic reconnection easily move outside the confinement region. The electron-mass depen-dence of the average electron and ion temperatures after the counter-helicity merging is plotted in Fig. 5, where the particle temperature is averaged over the confinement re-gion and normalized by its initial value. The average elec-tron temperature decreases in proportion to (Mi/Me)−1/2
ex-plained from the fact that the size of the electron dissipa-tion region is determined by the product of the electron meandering orbit size in thex-direction and that in they -direction, which is in proportion toMe1/2[9]. On the other
hands, the average ion temperature is almost constant, and becomes lower than the average electron temperature for
Mi/Me = 100. This phenomenon may be explained from
the fact that, as was shown in Fig. 4, the high-temperature ions are also distributed outside the confinement region as well as inside the confinement region, while most of the high-temperature electrons exist inside the confinement re-gion.
4. Co-Helicity Merging
Figure 6 demonstrates the time evolution of mag-netic field (color contours, lines) and poloidal electron flow velocity (arrows) for the co-helicity merging case of Mi/Me = 400. Two SPs have the same plasma
ro-tation in the poloidal plane, sustaining toroidal magnetic fieldBz with the same sign. Magnetic reconnection takes place at the center of the interface region in contrast to counter-helicity merging. As reconnection proceeds, the toroidal magnetic field penetrates into the reconnection re-gion, which tends to suppress reconnection itself. Thus, only a part of the poloidal magnetic field energy is con-verted to the particle energy. One large SP is generated as a result of the co-helicity merging of two SPs.
Let us compare the merging processes for the co-helicity and counter-co-helicity cases. Figure 7 plots the ion-mass dependence of the merging time scale for co-helicity (red) and counter-helicity (brown) cases, where the
merg-Fig. 6 Time evolution of magnetic field and poloidal electron flow velocity for the co-helicity merging case ofMi/Me=
400, where the left, middle, and right panels correspond to the spatial profiles at (A)ωpit=0, (B)ωpit=192, and
(C)ωpit=920, respectively.
ing time is defined by the time when the total magnetic energy dissipates and reaches the middle value between the initial and the final values. The merging time scale strongly depends on the ion mass for both cases, although it is almost independent of the electron mass. It is worthy of notice that the merging time is nearly equal to the tran-sit time for the ion sound wave to travel from the center of the SP in the initial profile to the reconnection point. Fig-ure 8 shows the ion-mass dependence of the average
elec-Fig. 7 Ion-mass dependence of the merging time scale for co-helicity (red) and counter-co-helicity (brown) cases, where the transit time for ion sound wave to travel from the cen-ter of SP in the initial profile to the reconnection point is also plotted by a blue line.
tron and ion temperatures after the co-helicity and counter-helicity mergings, where the average was taken over the confinement region. Both the ion and the electron tem-peratures are barely dependent on the ion mass except the small mass ratio case of Mi/Me = 100. This result
sug-gests that the dissipation of the electromagnetic energy in the two-dimensional collisionless reconnection takes place dominantly inside the electron dissipation region around the reconnection point, which is controlled by the electron dynamics but not by the ion dynamics [10]. The particle temperatures for the co-helicity case remains at the lower level compared with those for the counter-helicity case. This is because the toroidal component of magnetic field energy hardly dissipates for the co-helicity case, while it dissipates perfectly and is transferred to the particle ther-mal energy for the counter-helicity case.
5. Summary
Two different types of merging processes of spheromak-like (SP) plasmoids, which are confined in a rectangular conducting vessel, have been investigated by means of two-dimensional PIC simulation. Although our simulation model is constructed on the assumptions of no toroidicity and no three-dimensional effects, we have
succeeded in clarifying several fundamental aspects of merging processes of two SPs, i.e., mass-ratio dependence of the merging time scale, energy transfer process, motion of a reconnection point for counter-helicity case, the formation of a ring-shaped electron high-temperature region, and other phenomena.
Acknowledgments
The simulation was performed by employing the Plasma Simulator at the National Institute for Fu-sion Science (NIFS). This study was partially sup-ported by General Coordinated Research at the NIFS (NIFS17KNSS097).