© Universiti Tun Hussein Onn Malaysia Publisher’s Office
IJIE
Journal homepage: http://penerbit.uthm.edu.my/ojs/index.php/ijie
The International
Journal of
Integrated
Engineering
Resolving Gender Difference in Problem Solving Based On
the Analysis of Electroencephalogram (EEG) Signals
Norlaili Mat Safri
1, Ahmad Zuri Sha’ameri
2,*, Narina A. Samah
3&
Shaparas Daliman
41School of Electrical Engineering, Faculty of Engineering,
Universiti Teknologi Malaysia (UTM), Johor Bahru, Johor, 81310, MALAYSIA
2School of Electrical Engineering, Faculty of Engineering,
Universiti Teknologi Malaysia (UTM), Johor Bahru, Johor, 81310, MALAYSIA
3School of Education, Faculty of Social Sciences and Humanities,
Universiti Teknologi Malaysia (UTM), Johor Bahru, Johor, 81310, MALAYSIA
4Faculty of Engineering,
Universiti Malaysia Kelantan (UMK), Jeli, Kelantan, 17600, MALAYSIA
*Corresponding Author
DOI: https://doi.org/10.30880/ijie.2018.10.07.009
Received 30 October 2018; Accepted 19 November 2018; Available online 30 November 2018
1. Introduction
Within the area of human cognition, problem solving is considered to be "higher-layer cognitive process" (Wang & Chiew, 2010, p.81). As explained by the authors:
Abstract: Problem solving is regarded as one of the core work-related abilities and skills, which arehighly demanded
by the workplace and industry. Current literature suggests that problem solving abilities might differ from one individual to another due to biological factors such as brain activationa, cognitive functions and hormones, as well as due to socio-cultural and socio-economic factors like gender roles, self-perceptions and stereotyping. Hence, this study used electroencephalogram (EEG) signals to investigate the differences in problem solving skills among the Malaysian undergraduates based on their gender differences. 29 undergraduate students from the Facultyof Electrical Engineering, Universiti Teknologi Malaysia (UTM) served as the subjects of the experiments in this research. Specifically, 16 female and 13 male subjects engaged in two main problem-solving tasks: mental arithmetic task and Tower of Hanoi (TOH) task. The EEG data were analysed using partial directed coherence (PDC) and power spectrum estimation (PSE). Based on the results, female subjects achieved only 1% higher performance in mental arithmetic task, while male subjects achieved about 13% higher performance in TOH task. The differences in terms of the functional connectivity between brain regions, i.e. in PDC, as well as the power distribution of 6 EEG waveforms, i.e. delta, theta, alpha, beta, gamma and high gamma bands are also highlighted and represented graphically in this paper.
Problem solving is a cognitive process of the brain that searches a solution for a given problem or finds a path to reach a given goal. When a problem object is identified, problem solving can be perceived as a search process in the memory space for finding a relationship between a set of solution goals and a set of alternative paths. (ibid.)
In order to meet the demands and expectations of the real workplace, graduates need to equipped themselves with “work-related practical skills or competences that current employees (or prospective new hires) are able to use in order to perform various job tasks successfully" (World Economic Forum, 2016, p.18). Among the core work-related abilities and skills needed to accommodate the fourth industrial revolution is problem solving, which also one of the elements of higher order is thinking skills heavily emphasized by academic curriculum across the world.
In examining undergraduates' problem solving task by the use of brain functional connectivity, a number of fundamental concepts were suggested by the neuropsychological literature. The first concept acknowledges the fact that the initial stage of human problem solving is the understanding of the problem. Within this stage of problem identification, the elements of attention, mental representation of the problem and situated cognition need to be considered. This is in line with the conceptualisation of problem solving as a complex mental process resulted from "the culmination of all the process that make up (individuals) cognitive arsenal (which include) perception, pattern recognition, attention and immediate memory, language, and decision making" (Robinson-Riegler & Robinson-Riegler, 2012, p.494). Another crucial concept in problem solving is the strategies utilised, which include the analogy approach, the means-end heuristic and the hill-climbing heuristic (Matlin, 2014).
Past literature has suggested the differences between males and females in terms of cognition functions (Bell et al., 2006; Miller & Halpern, 2014; Weiss et al., 2003). Males and females might demonstrate the same cognitive performance but mentally they were actually gone through different information processing paths (Gong, He & Evans, 2011; Iddon & Williams, 2009; Jewel, 2009). Moreover, through numerous experiments, it was found out that females could perform better in some tasks compared to males. For instance, females tend to be better than males in linguistic tasks, are better in autobiographical memory and are more multitasking than males (Iddon & Williams, 2009; Weiss et al., 2003; Thilers, MacDonald & Herlitz, 2007). Males on the other hand outperformed women in visuo-spatial tasks like mental rotation and mathematical reasoning (Iddon & Williams, 2009; Weiss et al., 2003; Thilers, MacDonald & Herlitz, 2007). Furthermore, the differences of males and females could also be accessed through their creativity (Razumnikova, 2004). With reference to brain differences, a longitudinal study by Raznahan et al. (2010), for instance, revealed that sex hormones influence some specific aspects of brain development during puberty. The study provided the evidence that "adolescence (n=284) with higher androgen sensitivity showed more male-typical patterns of maturation in specific areas of the cerebral cortex" (Miller & Halpern, 2014, p.40. Such finding led to insights into cognitive sex differences mainly because the cerebral cortex supports most cognitive functioning. On the other hand, the authors also highlighted findings from other studies by Jausovec and Jausovec (2012) and Lenroot and Giedd (2010) which indicated that "women and men sometimes use brain regions differently to achieve equal cognitive performance" [ibid.].
It is suggested that gender differences in cognition functions is also due to the socio-cultural aspect of gender roles that resulted in other gender specific elements such as self-perceptions and stereotyping (Miller & Halpern, 2014; Weiss et al., 2003). From the aspect of cultural differences, studies on gender or sex differences in mathematics tests (e.g. Else-Quest, Hyde, & Linn; 2010; Kane & Mertz; 2012) challenged the universal idea of male advantages in mathematics as sex difference varied across socioeconomic levels of families and countries. For instance, it is found that males who belonged to families with higher socioeconomic status (e.g. Levine et al., 2005; Penner & Paret, 2008) and those who are living in wealthier countries (e.g. Lippa, Collaer, & Peters, 2010; Reilly, 2012) have more advantages in spatial (and mathematics) performance.
Engagement in sex-typed activities further explained the development of spatial skills among males. For example, spatial skills can be improved by playing construction toys or action video games that are male-typical activities (e.g. Miller & Halpern, 2014; Uttal et al., 2013). Research like one by Haier et al. (2009) further added that such male-typical activities could also caused neural changes in cortical thickness, as well as ex-differentiated patterns of brain activation. Despite extensive studies on brain connectivity conducted by a number of Malaysian researchers (Hashim et al., 2015; Kosnan, Safri & Khalid, 2015; Safri et al., 2008), it was found that less work had been done in incorporating neuropsychological concepts into that particular research area. Based on these observations, the researchers strongly believe that to explore brain functional connectivity from the neuropsychological perspective within the local subjects was worth researching on. In fact, Matlin (2014) suggested that problem solving strategies are contextualised and that researchers should consider individual and cultural differences when attempting to explore this dimension.
Owing to the gap within the Malaysian literature and having been guided by the recent and relevant literature within the neurocognitive aspect of problem-solving, this research seeks to identify the differences of performance based on brain functional connectivity with regards to gender of the Malaysian subjects. Hence, guided by the science of cognitive sex differences as emphasised by Miller and Halpern (2014), this research aimed to examine the Malaysian undergraduates' problem solving ability from the neurocognitive approach that specifically focuses on brain functional connectivity.
between each node can be defined by three types of connectivity: structural connectivity, for anatomical links; functional connectivity, for undirected statistical dependencies; and effective connectivity, for directed causal relationships among distributed responses Friston (1994). Functional connectivity is generally inferred by the correlation between nodal activities on the basis of blood oxygenation level–dependent (BOLD) functional MRI (fMRI) or coherence in electro- or magnetoencephalogram (EEG/MEG) signals.
EEG is one of techniques used to measure the electrical activity of the brain at different sites of the head. This is typically using electrodes placed on the scalp, i.e. by using cap electrode. One of its main benefits over other brain signal recording techniques are its high temporal resolution and the fact that it can be recorded noninvasively (Freeman & Quiroga, 2013). EEG is a very accessible and useful tool for the analysis of high level brain processes since it is relatively low cost and widely used both in clinical settings and research laboratories (ibid.)
Past literature suggested that EEG has been used on healthy participants or subjects in studies related to brain mapping (e.g. Tóth et al., 2017; Wens et al., 2015), within studies that examined the nature of brain connectivity in terms of its structure and functions (e.g. Allen et al., 2018; Amico et al., 2017; Chu et al., 2015; Hardmeier et al, 2014), as well as studies related to specific clinical conditions involving sleep patterns (e.g. Miraglia et al., 2018), or during a particular intervention (e.g. Myers et al., 2015). Within the clinical setting, EEG has also been utilised to study brain functional connectivity in research involving patients with certain diseases (e.g. Nunez, Srinivasan & Fields, 2015), autism (e.g. Righi et al., 2014), epilepsy (e.g. Adebimpe et al., 2016; Lagarde et al., 2018; Sargolzaei et al., 2015), dyslexia (e.g. González et al., 2018), Alzheimer’s disease (e.g. Engels et al., 2015; Vecchio et al., 2017; Yu et al., 2016), Parkinson’s disease (e.g. Yuvaraj et al., 2016), and schizophrenia (e.g. Damaraju et al., 2014).
2.
Methodology
2.1 Subjects
In this study, 29 healthy undergraduates from the then Faculty of Electrical Engineering (now School of Electrical Engineering), Universiti Teknologi Malaysia (UTM) served as the subjects. They consisted of 16 female and 13 male students. This as to accommodate the suggestions by Matlin (2014) that problem solving strategies are contextualised and that researchers should consider socio-cultural differences when attempting to explore this dimension. In this study, the subjects’ educational background was the main socio-cultural variable that was taken into consideration. The number of subjects was also aligned with other past studies conducted within the Malaysian context (e.g. Hashim et al., 2015; Kosnan, Safri & Khalid, 2015). The selection of subjects was based on convenience sampling approach. Those who volunteered to participate in the experiment were given choices to choose preferred time slots based on the schedules that the researchers provided.
2.2 Research Design
In order to gather the data, experimental research was used. Specifically, repeated measure design was employed to allow the same subjects to experience the same control and experimental conditions (Shaughnessy & Zechmeister, 1997). Through such method, subjects’ cognitive abilities can be explored and compared (Elmes, Kantowitz & Roediger, 2012).
2.3 Measurement
The experiment began with the researchers gaining approvals from the subjects through informed consent. Subjects were given a brief explanation regarding the terms and conditions in proceeding experiment as well as the experimental procedure (Priscilla, 2014). They were then set up with EEG instrument. The experiment was conducted inside a laboratory room where the room was equipped with natural experiment setting with limited users, in order to avoid any extraneous environment disturbance. The subject’s head was attached with EEG electrode and the signals were recorded using NeuroFax EEG 9000 signal acquisition software. The electrode placement for each subject is shown in Figure 1 while the experiment procedure flow chart is shown in Figure 2.
Fig. 2: The experimental procedure
The labeling electrodes placements were based on adjacent brain areas which the letter represented structural brain regions identification (Priscilla, 2014). The number besides the letter signified the position of the placements on the head where odd numbers represented left side of the head and even numbers represented right side of the head (Trans Cranial Technologies, 2012). Table 1 illustrates the electrodes labeling letters that represent the brain regions.
Table 1: Electrodes labeling representing brain regions
Electrode Brain Region
F Frontal
T Temporal
C Central
P Parietal
O Occipital
For the control task, subjects were required to be at rest and relax, and if possible with emptied mind. The subjects were asked to open their eyes during this task to meet the requirement of the recordings. The control task was recorded for 30 seconds for one to three times depending on a subject’s mental condition (for instance, nervousness) before they proceeded with the problem solving task.
The problem solving task consisted of two sub tasks: the arithmetic task and the Tower of Hanoi (TOH) task. In the arithmetic task, subjects were asked to mentally subtract 7 from 1000 continuously within 30 seconds. The final answer for each trial was noted and the process was repeated for three trials after resting for about 30 seconds per trial. EEG signals were recorded while the subjects were engaging in the thinking process.
Finally, the TOH task was divided into three difficulty levels: easy, medium and hard. The levels were chosen based on the feedback from subjects of the preliminary experiment. EEG signals were recorded when subjects were engaging in thinking (i.e. 30 seconds) and while solving the puzzle (i.e. maximum of two minutes). The rest time interval for each level was also 30 seconds. Overall, 10 EEG data (.csv) were recorded for each subject and the recorded EEG data were named using short form of the tasks name as shown in Figure 3.
Fig. 3: Codes for recorded EEG data
(1)
where x1[n], x2[n] and x3[n] represent the MVAR process at node 1, 2, and 3 which are driven by additive white Gaussian
noise sources v1[n], v2[n] and v3[n]. These equations represent the MVAR process show the correlation between each node
1, 2 and 3 except that for x3[n] there is no correlation with x1[n]. In general, x[n] with conjunction at y[n] in MVAR
determines the directional functionality. Thus, x[n] is operated as information sources that bidirectional functional connectivity to y[n] is regarded as information sink.
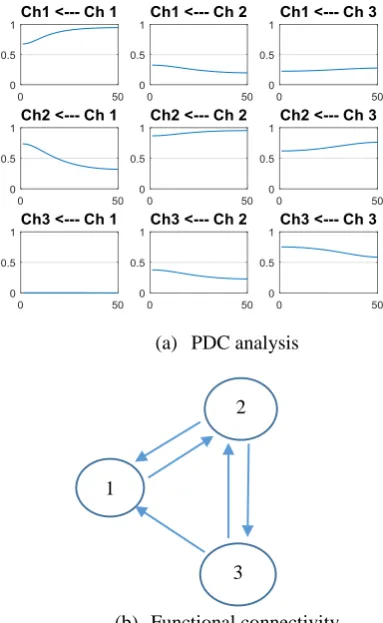
Using the MVAR model defined in Equation (1), PDC analysis is performed using the method defined in (Takahashi, 2007)and the results shown as a 3 x 3 matrix layout as shown in Figure 4a). The diagonal terms are not considered in the PDC analysis since it represents an interaction between a signal with itself. Thus, it is of interest to look for interactions for two different signals based on an acceptable magnitude. For discussions on the interpretation of PDC analysis is described in (Takahashi, 2007). Actual magnitude is obtained from prior knowledge of the characteristics of the signal interaction. From an acceptable magnitude of 0.1 for this example, functional connectivity does not occur only for x1[n]
to x3[n]. The resulting functional connectivity diagram is shown in Figure 4b). Since 19 electrodes are used in the 10/30
electrode placement system, the resulting matrix layout is 19 x 19 with a total of 19 elements in the functional connectivity diagram.
(a) PDC analysis
(b) Functional connectivity
Fig. 4: PDC analysis results shown in a 3 x 3 matrix layout and the derived functional connectivity. [Ch 1 refers to x1[n],
Ch2 refers to x2[n] and Ch3 refers to x3[n]; vertical axis represents magnitude and horizontal axis represents frequency in
samples].
The distribution of EEG signal power is segregated according to the following frequency bands: delta (0-4 Hz), theta (4-8 Hz), alpha (8-13 Hz), beta (13-31 Hz), gamma (31-51) and high gamma (51-120 Hz) (Dai, 2017; Omidvarnia, 2011). How much the power is distributed over the frequency band very depends on the performed task. For example, a high level in the gamma frequency band relates to active thinking. Thus, PSE can be utilized to determine how the power of the EEG signal is distributed over the frequency band. The most basic method for PSE is the periodogram which is defined as follows (Proakis, 2006).
1 1 2 3 1
2 1 2 3 2
3 2 3 3
[ ] 0.5 [ 1] 0.3 [ 1] 0.4 [ 1] [ ]
[ ] 0.5 [ 1] 0.3 [ 1] [ 1] [ ]
[ ] 0.3 [ 1] 0.2 [ 1] [ ]
x n x n x n x n v n
x n x n x n x n v n
x n x n x n v n
1
2
3
(2)
where x[n] is the signal of interest in discrete-time representation, and N is the duration of the signal. Since the periodogram is not an efficient estimator, alternative methods are considered which reduces the variance in the PSE as the signal length is increased. The Welch PSE is such a method and is utilized in this study (Proakis, 2006). An N length signal x[n] is segmented into length of M samples where the total number of sub-segments is L=N/M. The segmented signal can be expressed as
(3)
For each segment, the PSE is calculated similar to Eq. 3
(4)
where w[n] is the window function. Any window function such as Hamming or Bartlett window can be utilized for this purpose. Once all the PSE for each segment is calculated, the average PSE is obtained by
(5)
Overlapping of segments can be applied for the Welch PSE. If 50 percent is used, effectively the total number of segments doubles that results in reducing the variance in PSE by half compared to non-overlapping segments.
3.
Results
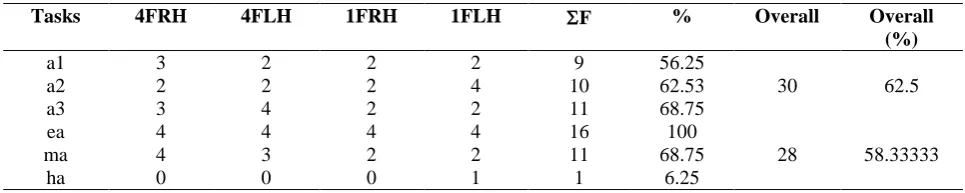
In this study, analyses of data were conducted based on two outputs from the experiment, i.e. the tabulated answer and the performances of subjects, and the recorded EEG data (.csv) during the tasks. The tabulated answer and performance of subjects refer to the subjects’ abilities in answering the given arithmetic questions with accurate final value for each trial. This also included their abilities to complete the TOH task within the maximum of two minutes provided for each level. Based on this, comparison for gender factors can be made by calculating the statistics of high performance versus low performance subjects as shown in Tables 2 and 3. It is further represented in a graphical form as in Figures 5 and 6.
In contrast, the recorded EEG data were analyzed using two methods, namely partial directed coherence (PDC) and power spectrum estimation (PSE) methods. The PDC analysis provided a more visual comparison based on the information pathway between the channels or brain regions of subjects when doing the given tasks. On the other hand, the PSE method analysed the change in power distribution of the EEG waveforms. In this project, both the PDC and PSE outputs were obtained on C-program running on a Linux platform. The outputs were further analysed using Microsoft Excel (for t-test) and Paint (for drawing).
Table 2: Subjects’ performance statistics for female subjects
Tasks 4FRH 4FLH 1FRH 1FLH F % Overall Overall
(%)
a1 3 2 2 2 9 56.25
30 62.5
a2 2 2 2 4 10 62.53
a3 3 4 2 2 11 68.75
ea 4 4 4 4 16 100
28 58.33333
ma 4 3 2 2 11 68.75
ha 0 0 0 1 1 6.25
Table 3: Subjects’ performance statistics for male subjects
Tasks 4FRH 4FLH 1FRH 1FLH F % Overall Overall
(%) 2 2 1 0 1 [ ] [ ] kn N j N x n
S k x n e
N
0 1 1
[ ] [ [ ] [ ]... [ ]...
l L[ ]]
x n
x n x n
x n
x
n
2 2 1 , 0 1 [ ] [ ] [ ] kn M j M
x l l
n
S k w n x n e
M
1 , , 0 1 [ ] [ ] Lx welch x l
l
S k S k
L
a1 4 1 2 1 8 61.53846
24 61.53846
a2 4 0 2 1 7 53.84615
a3 3 2 3 1 9 69.23077
ea 4 2 4 3 13 100
28 71.79487
ma 3 1 4 3 11 84.61538
ha 2 0 1 1 4 30.76923
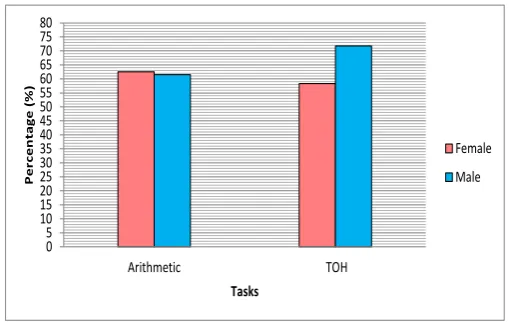
Fig. 5: Graph of gender performances (%) against tasks: all trials
Fig. 6: Graph of gender performances (%) against tasks: overall tasks
4.
Discussions
4.1 PDC Analysis
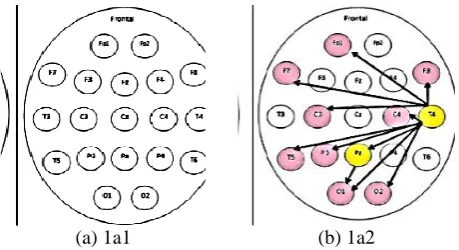
Using the methodology described in Section 2.3, the PDC output was plotted in the form a 19x19 matrix layouts of all the 19 channels used during EEG data recording for the 29 subjects and tasks. Figure 7 shows an example of function connectivity pattern for subject 1 while doing arithmetic task a1 and a2. For all functional connectivity patterns shown in this paper, the source for the signal is labeled as yellow while the sink for the signal is labeled as blue for male subject and pink for female subject respectively. Referring to task a1, the signal source is from the F2 region and the signal source for task a2 is from T4 region. Due to the large number of patterns, it is not possible to discuss each pattern for a given subject and task. The approach taken in this analysis is tabulate the signal sources according to task and gender as shown in Tables 4 and 5, and determine if there is any difference in the distribution of signal sources source from the functional connectivity pattern.
22 0 10 20 30 40 50 60 70 80 90 100
a1 a2 a3 ea ma ha
P e rc e n ta g e ( % ) Tasks Female Male 0 5 10 15 20 25 30 35 40 45 50 55 60 65 70 75 80
Arithmetic TOH
P e rc e n ta g e ( % ) Tasks Female Male (a) (b)
Figure 4.1: Graph of Gender Performances (%) against Tasks.
(a) All Trials. (b) Overall Tasks.
4.2.2 Handedness Differences
Based on the data, the following statistics were obtained and tabulated as
shown in Table 4.2.
22 0 10 20 30 40 50 60 70 80 90 100
a1 a2 a3 ea ma ha
P e rc e n ta g e ( % ) Tasks Female Male 0 5 10 15 20 25 30 35 40 45 50 55 60 65 70 75 80
Arithmetic TOH
P e rc e n ta g e ( % ) Tasks Female Male (a) (b)
Figure 4.1: Graph of Gender Performances (%) against Tasks.
(a) All Trials. (b) Overall Tasks.
4.2.2 Handedness Differences
Based on the data, the following statistics were obtained and tabulated as
(a) 1a1 (b) 1a2
Fig. 7: Functional connectivity diagram for respondent 1 of task a1 and a2
Basically, the functional connectivity pattern for problem solving should originate mainly from the frontal lobe. The tabulated PDC results have also shown that most of the signal sources for both the male and female subjects are from the frontal (F) regions. The results suggested that the female subjects outperformed the male subjects in arithmetic task while male subjects outperformed female subjects in TOH task.
The summarised signal sources as shown in Table 6 especially proved that the female subjects use more frontal regions in arithmetic task, while the male subjects use more frontal regions during TOH task. This shows that the utilization of the frontal regions as the source of EEG information flow during a task is proportional to the subject’s performance shown in Tables 2 and 3.
Table 4: Gender differences in PDC sources of information pathway for high task performance - Female subjects
a1 a2 a3 et ea mt ma ht ha
Fp1, Fp2, F8
F7, F8 Fp2, F3, F7, F8, Fz
Fp1, Fp2, F7, F8
Fp1, Fp2, F7, F8
Fp1, F7, F8
Fp1, F7, F8
F7 F7
T3, T4, T5, T6
T3, T4, T5
T3, T4, T5
T3, T4, T5
T3, T4, T5
T3, T4, T5
T3, T4, T5, T6
T3
O1 O2 O1, O2 O2 O2 O1
Pz Pz Pz Cz
Table 5: Gender differences in PDC sources of information pathway for high task performance - Male subjects
a1 a2 a3 et ea mt ma ht ha
Fp1, Fp2, F7, Fz
Fp1, Fp2, F7
Fp1, F4, F7, Fz
Fp1, Fp2, F7, F8
Fp1, F7 F4, F8 Fp1, F7 F8
T3 T3, T5,
T6
T3, T4 T3, T4 T3, T4,
T6
T3, T4, T6
T3, T4, T6
T3, T4 T3, T4
O2 O1 O2 O2 O2
Pz Pz Pz Pz
Table 6: Gender differences in PDC sources of information pathway for high task performance - Overall task
Arithmetic Task TOH Task
Female Male Female Male
Fp1, Fp2, F3, F7, F8, Fz Fp1, Fp2, F4, F7, Fz Fp1, Fp2, F7, F8 Fp1, Fp2, F4, F7, F8
T3, T4, T5,T6 T3, T4, T5,T6 T3, T4, T5, T6 T3, T4, T6
O1, O2 O1, O2 O1, O2 O2
Pz Pz Cz, Pz Pz
4.2 PSE
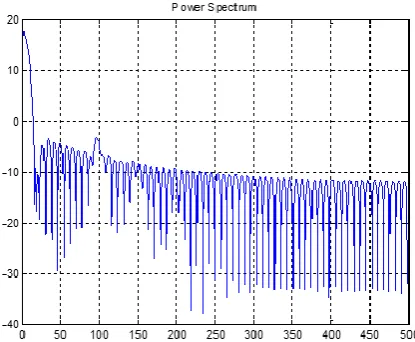
An example of the power spectrum measured at Fp1 is shown in Figure 8 where the distribution of signal power is segregated as follows bands: delta (0-4 Hz), theta (4-8 Hz), alpha (8-13 Hz), beta (13-31 Hz), gamma (31-51) and high gamma (51-120 Hz). In this example, it is observed that there is significant power at frequency less than 31 Hz indicating brain activities in the delta, theta, gamma and beta bands.
Fig. 8: Example of a power spectrum at Fp1 for a subject while performing a task
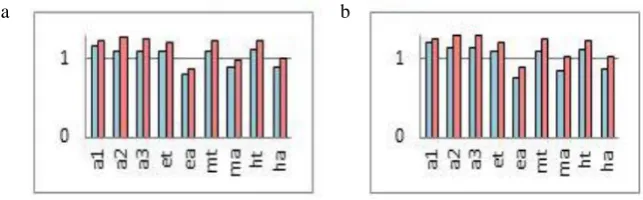
a b
Fig. 9: Comparison between the power in the delta band for Fp1 and Fp2 at state of rest with the various tasks
The gender differences results based on PSE show changes in control task to problem solving tasks ratio for each of the EEG waveform mentioned. For both male and female subjects, the labeled significant difference can be observed mostly at the frontal regions. During arithmetic task, the power of delta and theta band (especially in frontal region) increases for both genders with the decrease in power for the alpha, beta, gamma and high gamma bands. The major frequency band used by the female subjects is the theta band while the male subjects used theta and beta bands especially during the mental arithmetic task. In contrast, during TOH task, there is an increase in power for high gamma band for female subjects, while the power increases in both the gamma and high gamma power bands for male subjects. The difference power over the various bands during the problem solving tasks is directly related to the subjects’ performance. For instance, male subjects who showed the best performances in TOH task have correspondingly higher gamma and high gamma power compared to the female subjects.
5.
Conclusion
From this study, it can be inferred that the term ‘differences in problem solving’ not only refers to the ability of an individual to solve a given problem, but also refers to his/her way of thinking, thinking pattern or strategy in a given time to solve an encountered problem in order to reach the desired goal. This is especially when dealing with a close-ended solution problem. Often individuals would reach the same solution for the problem regardless of their gender or background. However, the way each individual solves a certain problem or the time taken for his/her to solve the same problem may differ from one to another.
Hence, the study of gender differences in problem solving highlighted by this study has been conducted by comparing the performance of subjects based on the gender groups (i.e. male and female). The EEG data analysed which involved PDC and PSE were useful to determine the relation between the subjects’ performances and the different parts of brain regions involved (as shown in PDC results) and wave power distributions (as shown in PSE results).
Acknowledgement
The authors would like to express their gratitude to Universiti Teknologi Malaysia (UTM) and the Ministry of Higher Education Malaysia for supporting this research under the Research University Grant (RUG) of UTM (Tier 1; Ref. No:
PY/2017/01815; Cost Center No. Q.J130000.2501.20H48).
References
[1] Wang, Y., & Chiew, V. (2010). On the cognitive process of human problem solving. Cognitive Systems Research, 11(1), 81-92.
[2] World Economic Forum (WEF) (2016). Global challenge insight report: the future of jobs: employment, skills and workforce strategy for the Fourth Industrial Revolution.
[3] Robinson-Riegler, G. & Robinson-Riegler, R. (2012). Cognitive psychology: applying the science of the mind. 3rd ed. Boston, MA: Pearson Education, Inc.
[4] Matlin, M. W. (2014). Cognitive psychology. Asia: John Wiley & Sons (Asia) Pte. Ltd.
[5] Bell, E. C., Willson, M. C., Wilman, A. H., Dave, S., & Silverstone, P. H. (2006). Males and females differ in brain activation during cognitive tasks. Neuroimage, 30(2), 529-538.
[6] Miller, D. I., & Halpern, D. F. (2014). The new science of cognitive sex differences. Trends in cognitive sciences, 18(1), 37-45.
[7] Weiss, E. M., Kemmler, G., Deisenhammer, E. A., Fleischhacker, W. W., & Delazer, M. (2003). Sex differences in cognitive functions. Personality and Individual Differences, 35(4), 863-875.
[8] Gong, G., He, Y., & Evans, A. C. (2011). Brain connectivity: gender makes a difference. The Neuroscientist, 17(5), 575-591.
[9] Iddon, J., & Williams, H. (2009). Memory boosters: 10 steps to a powerful memory. London: Bounty Books. [10] Jewell, J. (2009). Brain fitness at work: unlock your mind’s potential and achieve peak performance. London:
[11] Thilers, P.P., MacDonald, S.W.S., & Herlitz, A. (2007). Sex differences in cognition: The role of handedness. Physiology & Behavior, 92(1–2), 105-109.
[12] Razumnikova, O.M. (2004). Gender differences in hemispheric organization during divergent thinking: an EEG investigation in human subjects. Neuroscience Letters, 362(3), 193-195.
[13] Raznahan, A., Lee, Y., Stidd, R., Long, R., Greenstein, D., Clasen, L., Addington, A., Gogtay, N., Rapoport, J.L., & Giedd, J.N., (2010). Longitudinally mapping the influence of sex and androgen signaling on the dynamics of human cortical maturation in adolescence. Proceedings of the National Academy of Sciences, 107(39), 16988-16993.
[14] Jausovec, N., & Jausovec, K. (2012). Sex differences in mental rotation and cortical activation patterns: Can training change them?. Intelligence, 40(2), 151-162.
[15] Lenroot, R. K., & Giedd, J. N. (2010). Sex differences in the adolescent brain. Brain and Cognition, 72(1), 46-55. [16] Else-Quest, N. M., Hyde, J. S., & Linn, M. C. (2010). Cross-national patterns of gender differences in mathematics:
a meta-analysis. Psychological Bulletin, 136, 1, 103-127.
[17] Kane, J. M., & Mertz, J. E. (2012). Debunking myths about gender and mathematics performance. Notices of the AMS, 59(1), 10-21.
[18] Levine, S. C., Vasilyeva, M., Lourenco, S. F., Newcombe, N. S., & Huttenlocher, J. (2005). Socioeconomic status modifies the sex difference in spatial skill. Psychological Science, 16(11), 841-845.
[19] Penner, A.M. & Paret, M. (2008). Gender differences in mathematics achievement: exploring the early grades and the extremes. Soc. Sci. Res. 37, 239-253 .
[20] Lippa, R. A., Collaer, M. L., & Peters, M. (2010). Sex differences in mental rotation and line angle judgments are positively associated with gender equality and economic development across 53 nations. Archives of Sexual Behavior, 39(4), 990-997.
[21] Reilly, D. (2012). Gender, culture, and sex-typed cognitive abilities. PLoS ONE 7, e39904
[22] Uttal, D.H. et al. (2013). Exploring and enhancing spatial thinking: links to achievement in science, technology, engineering, and mathematics? Curr. Dir. Psychol. Sci. 22, 367-373
[23] Haier, R.J. et al. (2009). MRI assessment of cortical thickness and functional activity changes in adolescent girls following three months of practice on a visual–spatial task. BMC Res. Notes 2, 174
[24] Hashim, S., Safri, N. M., Othman, M. A., & Zakaria, N. A. (2015). Brain functional connectivity and power spectrum analyses during mental arithmetic. Jurnal Teknologi, 74(6), 41-47. DOI: 10.11113/jt.v74.4666
[25] Kosnan, H.Z.B., Safri N.M., & Khalid P.I., (2015) Dynamic features of handwriting and cortico-cortical functional connectivity during basic geometric drawing based on gender, In BioSignal Analysis, Processing and Systems (ICBAPS), 2015 International Conference on. 2015, pp. 112-117, IEEE.
[26] Safri, N. M., Ali, S. H. A., Salleh, S. Z., & Murayama, N. (2008). Modeling information pathway of motor control using coherence analysis. In Modeling & Simulation, 2008. AICMS 08. Second Asia International Conference on. pp. 917-922. IEEE.
[27] Park, H. J. & Friston, K. (2013). Structural and functional brain networks: from connections to cognition. The American Association for the Advancement of Science (AAAS). 342, pp. 579-586.
[28] Friston, K.J. (1994). Functional and effective connectivity in neuroimaging: A synthesis, Hum. Brain Mapp. 2, , pp. 56–78.
[29] Freeman, W., & Quiroga, R. Q. (2013). Imaging brain function with EEG: advanced temporal and spatial analysis of electroencephalographic signals. New York: Springer Science & Business Media.
[30] Tóth, B., Urbán, G., Háden, G. P., Márk, M., Török, M., Stam, C. J., & Winkler, I. (2017). Large‐scale network organization of Eeg functional connectivity in newborn infants. Human Brain Mapping, 38(8), 4019-4033. [31] Wens, V., Marty, B., Mary, A., Bourguignon, M., Op De Beeck, M., Goldman, S., Van Bogaert, P., Peigneux, P. &
De Tiège, X. (2015). A geometric correction scheme for spatial leakage effects in MEG/EEG seed‐based functional connectivity mapping. Human Brain Mapping, 36(11), 4604-4621.
[32] Allen, E. A., Damaraju, E., Eichele, T., Wu, L., & Calhoun, V. D. (2018). EEG signatures of dynamic functional network connectivity states. Brain Topography, 31(1), 101-116.
[33] Amico, E., Bodart, O., Rosanova, M., Gosseries, O., Heine, L., Van Mierlo, P., Martial, C., Massimini, M., Marinazzo, D. & Laureys, S. (2017). Tracking dynamic interactions between structural and functional connectivity: a TMS/EEG-dMRI study. Brain Connectivity, 7(2), 84-97.
[34] Chu, C.J., Tanaka, N., Diaz, J., Edlow, B.L., Wu, O., Hämäläinen, M., Stufflebeam, S., Cash, S.S. & Kramer, M.A. (2015). EEG functional connectivity is partially predicted by underlying white matter connectivity. Neuroimage, 108, 23-33.
[35] Hardmeier, M., Hatz, F., Bousleiman, H., Schindler, C., Stam, C. J., & Fuhr, P. (2014). Reproducibility of functional connectivity and graph measures based on the phase lag index (PLI) and weighted phase lag index (wPLI) derived from high resolution EEG. PloS one, 9(10), e108648.
[36] Miraglia, F., Vecchio, F., Gorgoni, M., Ferrara, M., Iberite, F., De Gennaro, L., & Rossini, P. M. (2018). S93. Cortical connectivity modulation during sleep onset: A study via graph theory on EEG data. Clinical Neurophysiology, 129, e177.
[37] Myers, M.M., Grieve, P.G., Stark, R.I., Isler, J.R., Hofer, M.A., Yang, J., Ludwig, R.J. & Welch, M.G. (2015). Family Nurture Intervention in preterm infants alters frontal cortical functional connectivity assessed by EEG coherence. Acta Paediatrica, 104(7), 670-677.
[38] Nunez, P. L., Srinivasan, R., & Fields, R. D. (2015). EEG functional connectivity, axon delays and white matter disease. Clinical neurophysiology, 126(1), 110-120.
[40] Adebimpe, A., Aarabi, A., Bourel-Ponchel, E., Mahmoudzadeh, M., & Wallois, F. (2016). EEG resting state functional connectivity analysis in children with benign epilepsy with centrotemporal spikes. Frontiers in neuroscience, 10, 143.
[41] Lagarde, S., Roehri, N., Lambert, I., Trebuchon, A., McGonigal, A., Carron, R., Scavarda, D., Milh, M., Pizzo, F., Colombet, B. and Giusiano, B. (2018). Interictal stereotactic-EEG functional connectivity in refractory focal epilepsies. Brain.
[42] Sargolzaei, S., Cabrerizo, M., Goryawala, M., Eddin, A. S., & Adjouadi, M. (2015). Scalp EEG brain functional connectivity networks in pediatric epilepsy. Computers in Biology and Medicine, 56, 158-166.
[43] González, G. F., Smit, D. J., van der Molen, M. J., Tijms, J., Stam, C. J., de Geus, E. J., & van der Molen, M. W. (2018). EEG resting state functional connectivity in adult dyslexics using Phase Lag Index and Graph Analysis. Frontiers in Human Neuroscience, 12, 341.
[44] Engels, M. M., Stam, C. J., van der Flier, W. M., Scheltens, P., de Waal, H., & van Straaten, E. C. (2015). Declining functional connectivity and changing hub locations in Alzheimer’s disease: an EEG study. BMC neurology, 15(1), 145.
[45] Vecchio, F., Miraglia, F., Piludu, F., Granata, G., Romanello, R., Caulo, M., Onofrj, V., Bramanti, P., Colosimo, C. and Rossini, P.M. (2017). “Small World” architecture in brain connectivity and hippocampal volume in Alzheimer’s disease: a study via graph theory from EEG data. Brain Imaging and Behavior, 11(2), 473-485.
[46] Yu, M., Gouw, A. A., Hillebrand, A., Tijms, B. M., Stam, C. J., van Straaten, E. C., & Pijnenburg, Y. A. (2016). Different functional connectivity and network topology in behavioral variant of frontotemporal dementia and Alzheimer's disease: an EEG study. Neurobiology of Aging, 42, 150-162.
[47] Yuvaraj, R., Murugappan, M., Acharya, U. R., Adeli, H., Ibrahim, N. M., & Mesquita, E. (2016). Brain functional connectivity patterns for emotional state classification in Parkinson’s disease patients without dementia. Behavioural Brain Research, 298, 248-260.
[48] Damaraju, E., Allen, E.A., Belger, A., Ford, J.M., McEwen, S., Mathalon, D.H., Mueller, B.A., Pearlson, G.D., Potkin, S.G., Preda, A. and Turner, J.A. (2014). Dynamic functional connectivity analysis reveals transient states of dysconnectivity in schizophrenia. NeuroImage: Clinical, 5, 298-308.
[49] Shaughnessy, J. J., & Zechmeister, E. B. (1997). Research methods in psychology, 4th ed. Singapore: McGrow-Hill.
[50] Elmes, D. G., Kantowitz, B. H. & Roediger III, H. L. (2012). Research methods in psychology, 9th ed. United States
of America: Wadsworth Cengage Learning.
[51] Priscilla Sim Chee Mei (2014). Gender and handedeness differences in problem solving based on
electroencephalography (EEG) signal. Bachelor in Electrical Engineering Thesis. Universiti Teknologi Malaysia. [52] Trans Cranial Technologies. (2012). 10/20 System Positioning Manual. Hong Kong: Trans Cranial Technologies
Ltd.
[53] Teplan, M. (2002). Fundamentals of EEG measurement, Measurement Science review, vol. 2, 2002, pp. 1-11. [54] Takahashi, D.Y., Baccala, L. A., & Sameshima, K. (Dec 2007) Connectivity inference between neural structures
via partial directed coherence, Journal of Applied Statistics, Vol. 34, No. 10, pp. 1255-1267.
[55] Omidvarnia, A., Mesbah, M.., et al, (2011). Analysis Of The Time-Varying Cortical Neural Connectivity In The Newborn EEG: A Time-Frequency Approach, 7th International Workshop on Systems, Signal Processing and their Applications (WOSSPA) 2011, Tipaza, Algeria, 9-11 May 2011.
[56] Proakis, J.G. & D. Manolakis, D. (2006). Digital Signal Processing, Prentice Hall.
[57] Dai, Z., Souza, J., et al, (2017). EEG Cortical Connectivity Analysis of Working Memory Reveals Topological Reorganization in Theta and Alpha Bands, Frontiers in Human Neuroscience, 12 May 2017.