Performance of Wavelets for Information Preservation in
Hyperspectral Image Compression
Sonal S. Save
PG Student
Department of Computer Engineering TCET, Mumbai
R. R. Sedamkar
Professor
Department of Computer Engineering TCET, Mumbai
ABSTRACT
This paper investigates various wavelets in terms of information preservation in hyperspectral image analysis. The compression method uses Principal Component Analysis (PCA) to provide spectral decorrelation and also dimensionality reduction. Principal Component (PC) images are then compressed by various wavelets and Set Partitioning in Hierarchical Trees (SPIHT) based coder. Experimental results by using five wavelets show that the compression method preserves spatial details and spectral features for all wavelets. Among the five wavelets used, coiflet achieves higher signal-to-noise ratio at high compression in spectral dimension. Performance is best when a few (10 or less than 10) PCs are retained for coding. The order of performance is coiflet2, biorthogonal2.2, symlet2, daubechies4 and biorthogonal1.1 for given AVIRIS dataset.
General Terms
Hyperspectral image compression, Principal component analysis, Karhunen Loeve Transform
Keywords
Dimensionality reduction, Information preservation, Spectral angle mapper, covariance matrix
1.
INTRODUCTION
Hyperspectral imaging (HSI) is one of the most powerful and fastest growing technologies in the field of remote sensing. Hyperspectral images are three dimensional multivariate data structures (called hypercube) with two spatial dimensions (x – y) and one wavelength dimension (λ). The hyperspectral data refers to the large number of measured wavelength bands that are continuous and narrow. The data corresponds to the reflected radiation from a particular region of earth’s surface. Each pixel in a hyperspectral image represents a radiation that is a characteristic feature of light absorbing and/or scattering properties of the spatial region corresponding to that pixel. This forms the spectral signature of the object and it can be used to uniquely characterize and identify any given material. As the hyperspectral imagery is collected by capturing hundreds of continuous wavelength bands, the size of the data is huge. For example, Airborne Visible/Infrared Imaging Spectrometer (AVIRIS) is capable of capturing several gigabytes of data per day. These images contain geographical information and reflect the characteristics of geographical features and spatial structures on the earth surface. This huge amount of information is very useful in large number of applications such as detection and identification of the surface and atmospheric constituents present, analysis of soil type, monitoring agriculture and forest conditions, environmental analysis and military surveillance [1]. As the HSI data is typically collected by satellites, the transmission and storage of such a data to
terrestrial receiver sites is a research issue that requires the employment of compression technology [2]. There are spectral as well as spatial redundancies in hyperspectral image. So the compression method is effective that removes the redundancy. In literature, there are number of approaches to the compression of hyperspectral imagery proposed. Prominent techniques include Principal Component Analysis (PCA) [3], vector quantization [4], KLT, DWT, DCT (e.g. [5-7]) applied to spectral dimension. The dimensionality reduction and compression method for HSI data based on Independent Component Analysis (ICA) and wavelet transform is proposed in [8]. Wavelet based lossy compression techniques are widely used as they provide excellent performance for traditional 2D images. Further, 3D compression algorithms are extensions of 2D algorithms. Widely used 3D wavelet based techniques are 3D-SPECK, 3D-SPIHT [9].
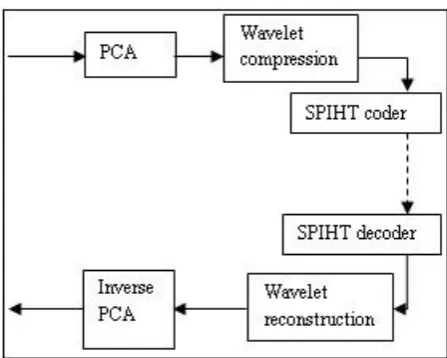
In this paper, PCA is used to remove spectral redundancy and achieve the dimensionality reduction in order to preserve the spectral features of hyperspectral image. This feature preservation is important for further analysis. The obtained principal component images have spatial correlation. Under lossy compression scheme, wavelet decomposition is used here for data reduction. This paper examines various wavelets like coiflet, symlet, daubechies, biorthogonal wavelets etc, which can be used in hyperspectral image compression. The functional block diagram of hyperspectral image compression and decompression based on PCA and DWT is presented in Figure 1.
In this paper, the performance of Principal Component Analysis (PCA) for dimensionality reduction, along with Discrete Wavelet Transform (DWT) for spatial compression, in terms of information preservation i.e. in terms of usefulness of the reconstructed data in analysis such as, classification, and object identification, is investigated. Experimental results indicate that, the compression and decompression of hyperspectral image based on PCA and DWT performs well, in terms of SNR, RMSE, MAE and SAM, even when only low resolution subbands of a few (10 or less than 10) PCs are coded.
2.
PCA BASED DIMENSIONALITY
REDUCTION OF HYPERSPECTRAL
IMAGE
Principal Component Analysis is a simple mathematical tool from linear algebra, which provides a roadmap for how to reduce a complex data set to a lower dimension. It is a well known technique used in multivariate data analysis. As hyperspectral images (HSI) are 3-Dimensional multivariate data structures with two spatial dimensions and one wavelength dimension, PCA is widely used in HSI for spectral decorrelation and spectral dimensionality reduction.
In hyperspectral imagery, multiple images are captured at wide range ofwavelength in an electromagnetic spectrum and with a narrow and continuous bandwidth. Thus, resultant consecutive bands are highly correlated and may contain redundant information. Hence, the smaller number of spectral bands must be selected for storage such that they describe the data that is useful to the end use application. PCA is used in hyperspectral imaging as it is capable of representing the spectral variance from the hundreds of bands into a small set (typically less than 10) of principal component images.[10]
The case when all principal components are retained, PCA is commonly termed as Karhunen Loeve Transform (KLT). In any KLT based compression system, for a hyperspectral image with n spectral bands, a covariance matrix called KLT matrix of n×n dimension is generated. This matrix is data dependent and need to be communicated to the decoding end.
In PCA, only those eigenvectors from covariance matrix are retained that correspond to largest P eigen values. The data volume passed to the decoder has P < n spectral components. In [3] it is shown that rate distortion performance can be significantly improved by employing principal component analysis for spectral decorrelation. As the minor PCs are almost noisy, it is better to preserve a subset of PCs for dimensionality reduction.
The conventional PCA works on 2-Dimensional data matrix. For this reason, hyperspectral data cube is unfolded to form a 2-Dimentional matrix where each column represents spectrum of a pixel and each row represents each band of the cube as illustrated in Figure 2.
The mean vector can be computed by the sample average as,
. (1)
Each input vector differs from the average. The mean is then subtracted from each input vector to get the zero mean data. This set of very large vectors is subjected to PCA.
Fig. 2.2D representation of 3D hypercube [11]
The covariance matrix Cx is computed as (2).
. (2)
The size of Cx is n×n. Covariance measures the variation of
each dimension from mean, with respect to each other. The eigenvalues D and eigenvector matrix V of Cx are then
computed. The term (K-1) is used to obtain an unbiased estimate of covariance matrix from the samples.
The PCA based dimensionality reduction algorithm is summarized as follows,
i. Convert the hyperspectral image cube to a matrix X with n rows and MN columns.
ii. Compute the mean vector as (1).
iii. Subtract the mean from each input vector to get the zero mean data or the centered data.
iv. Compute the covariance matrix as (2).
v. Compute the eigenvalues D and the corresponding eigenvectors V of the covariance matrix.
vi. Compute VT × X to obtain PC images.
vii. Select those PC images with the first P largest eigenvalues to achieve dimensionality reduction.
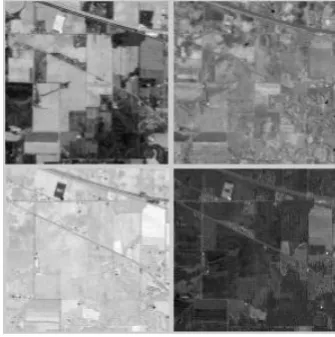
Figure 3 shows first four principal components obtained by applying PCA to AVIRIS Indian Pine data.
3.
WAVELET COMPRESSION
Wavelets are finite energy functions having localization properties. This means a small finite number of coefficients are required to represent a complicated signal. Due to this localization feature, wavelet transformation is used in data compression. Wavelet transform provides a good time resolution at high frequencies and good frequency resolution at low frequencies. Low amplitudes correspond to the frequency bands that are not so prominent in the original signal. Hence, those wavelet coefficients can be discarded without much loss of data. This facilitates data reduction.
In literature, wavelet analysis is applied to hyperspectral image data in various ways. Scholl and Denmark [12] propose a discrete wavelet transform that consists of 2-D discrete wavelet transform in spatial dimension and 1-D DWT in spectral dimension. In this paper, principal components images are subjected to wavelet based compression. Each PC is a 2D image. A 2D DWT is implemented as a filter bank. Wavelet transform helps in embedded coding in that majority of the signal energy is concentrated in low frequency components and thus they are important than high frequency components in reconstruction [2]. Schmanske and Loew [5] propose a lossy compression by setting all highpass subband coefficients to zero, providing higher compression ratios, without necessarily degrading the overall performance. The various wavelets that we encounter are coiflet, symlet, daubechies and biorthogonal wavelets.
4.
SPIHT BASED CODING AND
DECODING
Wavelet transform efficiently approximates each PC image by representing it with small number of coefficients. The next important step is to represent wavelet coefficients by a coder. Shapiro [13] used the zerotrees of wavelet coefficients to develop the embedded zerotree coding of wavelet coefficients (EZW) and later Said and Pearlman [14] proposed a good WT coding technique, set partitioning in hierarchical trees (SPIHT). Here basic SPIHT is implemented in coding the coefficients. Also coding based on linear set partitioning is proposed. Experimental results show that the distortion parameters in linear partitioning are same as those using hierarchical sets. The difference is in number of coded bits. The bits in the encoded bitstream are more in linear partitioning than that in hierarchical trees. The advantage of linear partitioning lies in simplicity during implementation. The coding based on linear partitioning is summarized as follows,
i. Low pass subband of each principal component is arranged as a column vector of a matrix CA. Number of columns of a matrix CA is equal to the number of principal components.
ii. Number of sets is equal to the number of rows of a matrix CA such that partitioning is linear rowwise.
iii. Coding is performed using the SPIHT coding and then decoding.
iv. Matrix CA is then regenerated.
v. Each column is then arranged as 2D image. These images are subjected to inverse wavelet transform.
5.
PERFORMANCE COMPARISON OF
VARIOUS WAVELETS
The performance of the lossy compression is determined by measuring the distortion. Distortion measures the fidelity of the reconstructed data to the original data. Distortion may be evaluated according to the radiometric distortion and to spectral distortion [3]. Sagrista and Llinas [15] gives the various radiometric distortion parameters used like signal to noise ratio (SNR), root mean squared error (RMSE), mean absolute error (MAE) etc. and also proposed the other distortion measures like Spectral Angle Mapper (SAM) to help evaluation and to guide the compression approach. SAM provides us the value of spectral angle (in degrees or radians) between the pair of vectors. The spectral angle is more appropriate for spectral signature comparison as it considers the shape of the spectra and not the overall energy.
6.
RESULTS AND DISCUSSION
The Airborne Visible/Infrared Imaging Spectrometer (AVIRIS) dataset – Indian Pine is used in the experiment. The image resolution is listed in Table 1. The architecture shown in Figure 1 is implemented in MATLAB as discussed in sections 2, 3, 4 and 5.
Table 1. Indian Pine Dataset
Data set size (in pixels) 145 × 145 (21025)
Number of bands 220
Ground resolution 17m
Spectral region 0.4-2.5μm
bandwidth 10-nm
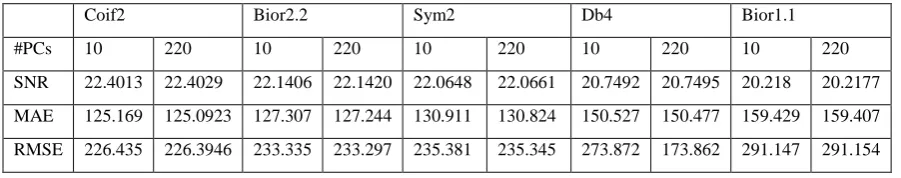
Table 2. Compression performance in terms of radiometric distortions
Coif2 Bior2.2 Sym2 Db4 Bior1.1
#PCs 10 220 10 220 10 220 10 220 10 220
SNR 22.4013 22.4029 22.1406 22.1420 22.0648 22.0661 20.7492 20.7495 20.218 20.2177
MAE 125.169 125.0923 127.307 127.244 130.911 130.824 150.527 150.477 159.429 159.407
Table 3. Compression performance in terms of spectral distortion
Coif2 Bior2.2 Sym2 Db4 Bior1.1
#PCs 10 220 10 220 10 220 10 220 10 220 ρ 0.9899 0.9899 0.9893 0.9893 0.9891 0.9891 0.9853 0.9853 0.9833 0.9833 μSAM 2.8063 2.8044 2.8544 2.8522 2.9622 2.9607 3.3981 3.3976 3.6324 3.6324
σSAM 1.9459 1.9467 2.1209 2.1217 2.0690 2.0696 2.4973 2.4975 2.8264 2.8266
var 0.0661 0.0661 0.0785 0.0786 0.0747 0.0748 0.1088 0.1089 0.1394 0.1394
#PCs = number of PCs coded, ρ = spatial correlation coeficient,
μSAM, σSAM , var – mean, standard deviation and variance of SAM in degrees over entire dataset
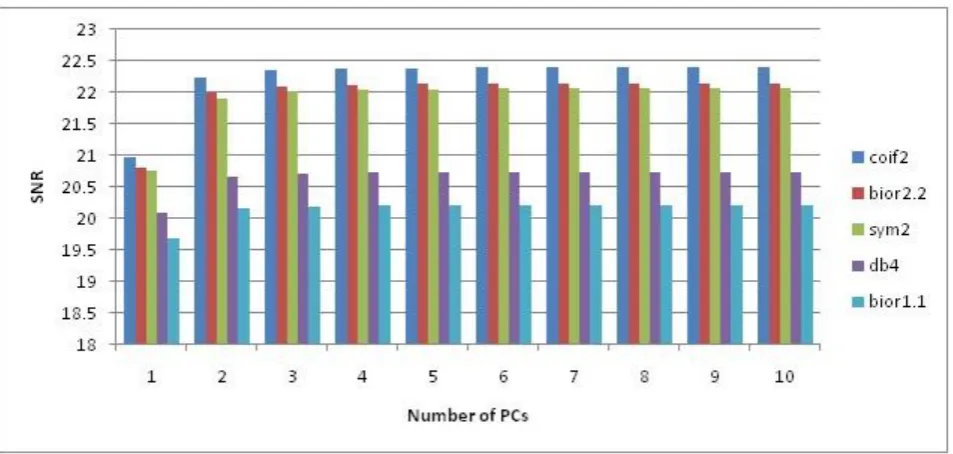
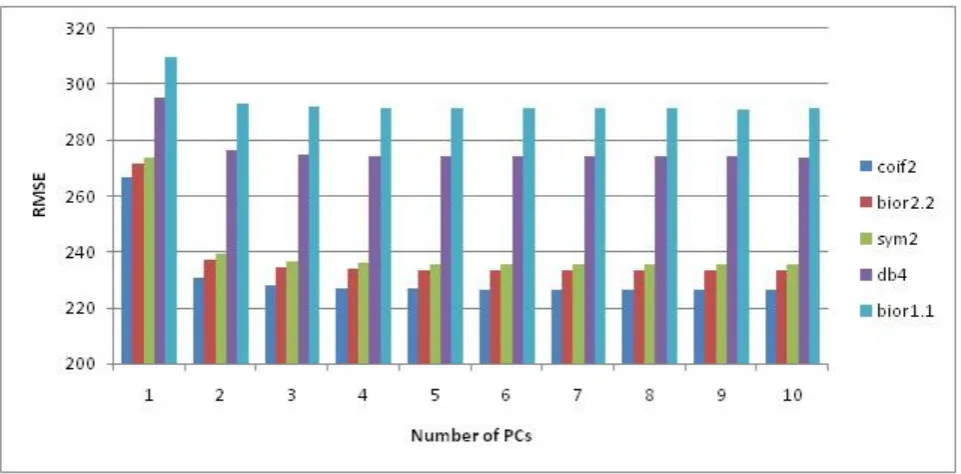
Figure 4 shows the SNR performance of AVIRIS Indian Pine dataset for various wavelets. From Figure 4, it is observed that SNR values for coeflet are maximum as compared to other wavelets used when same numbers of PCs are coded. In terms of SNR, the performance order is coiflet2, biorthogonal2.2, symlet2, daubechies4 and biorthogonal1.1 for the given dataset. Figure 5 and Figure 6 shows the MAE and RMSE performance, respectively, of AVIRIS Indian Pine dataset for five wavelets used. From Figure 5 and Figure 6, it is observed that the coiflet performance is best among the five wavelets when same numbers of PCs are coded. In terms of MAE as well as RMSE, the performance order of wavelets is same as coiflet2, biorthogonal2.2, symlet2, daubechies4 and biorthogonal1.1.
From Table 2, it is observed that if all 220 PCs are retained, then there is no substantial improvement in SNR, MAE and RMSE values. By keeping 10 PCs, the compression ratio of 0.045 can be achieved in spectral dimension. This means data occupies 4.5% of its original size.
In practical applications of hyperspectral image compression, it is important to consider the usefulness of the reconstructeddata.
Table 3 presents the distortion measures in terms of information preservation when original image cube is compared with the reconstructed image cube. The measure of similarity comparison is the spatial correlation coefficient ρ – the closer ρ is to 1.0, the better performance is considered to be. Table 3 also shows the mean and standard deviation of the SAM in degrees over the entire image. It is observed that the average spectral distortion is quite small even when a few (10 or less than 10) PCs are coded for various wavelets used. In comparing Table 2 and Table 3, it is observed that number of PCs yeilding maximum SNR, minimum MAE and RMSE is close to the number of PCs yeilding maximum performance in terms of information preservation. If the dataset is coded using 10 PCs, the reconstructed image is still useful for practical data analysis, such as classification because these PCs should perform good in that terms also. Table 3 also dipicts the same order of performance of wavelets as coiflet2, biorthogonal2.2, symlet2, daubechies4 and biorthogonal1.1. Among the various wavelets used, coiflet stands better in terms of radiometric as well as spectral distortion measures for the given AVIRIS dataset.
Fig. 5.MAE performance as the number of principal components coded varies for various wavelets on Indian Pine dataset
Fig. 6.RMSE performance as the number of principal components coded varies for various wavelets on Indian Pine dataset
7.
CONCLUSION
This paper investigates the performance of various wavelets in hyperspectral image compression. Experimental results on AVIRIS dataset show that five wavelets, each from different wavelet family, when used in hyperspectral image compression, perform well in terms of radiometric distortion measures like SNR, RMSE, MAE as well as spectral distortion parameter like SAM. It is observed that the average spectral distortion is quite small even when 10 or less than 10 PCs are coded. Thus it can be concluded that, all these wavelets when used for spatial compression provide the data that can be useful after reconstruction in analysis such as classification. Among the five wavelets used, the coif2 provides maximum performance in radiometric distortion parameters as well as in terms of
information preservation. So it can be used for compressing hyperspectral images to be useful for classification. Future work is to perform the classification so that compression method can be modified to achieve high classification accuracy.
8.
REFERENCES
[1] X. Tang, W. Pearlman: Three Dimensional Wavelet Based Compression of Hyperspectral Images. In Hyperspectral Data Compression, pp 273-308, Springer.
[3] Qian Du, and James E. Fowler, “Hyperspectral Image Compression Using JPEG2000 and Principal Component Analysis”, IEEE Geosci. Remote Sens.Lett., pp. 201-205, April 2007
[4] S.E. Qian, A.B. Hollinger, S. Williams, and D. Manak, “Vector quantization using spectral index based multiple subcodebooks for hyperspectral data compression”, IEEE transactions on Geoscience and Remote Sensing, vol.38, no.3, pp. 1183-1190, May 2000.
[5] B.M. Schmanske, M.H. Loew, “Effect of Lossy Wavelet based Compression on Classification Accuracy”, IEEE 0-7803-7031-7/01, 2001
[6] B. Penna, T. Tillo, E. Magli and G. Olmo, “Transform coding techniques for lossy hyperspectral data compression”, ”, IEEE Transaction on geoscience and remote sensing, vol.45, no.5, May 2007.
[7] I. Blanes, J. Serra-Sagrista, “ Cost and scalability improvements to the Karhunen-Loeve Transform for remote sensing image coding”, IEEE Transaction on geoscience and remote sensing, vol.48, no.7, July 2010
[8] Y. Feng, Jiakai Lv, J. Su, “Feature preserving compression for hyperspectral remote sensing images”, ICIEA 978-1-4244-2800-7/09, IEEE 2009
[9] E Christophe, C Mailhes, P Duhamel, “Hyperspectral Image Compression: Adapting SPIHT and EZW to
Anisotropic 3-D Wavelet Coding”, IEEE Transactions on Image Processing, vol. 17, No. 12, December 2008 [10] J. Burger, A. Gowen, “Data handling in hyperspectral
image analysis”, in Chemometrics and Intelligent Laboratory Systems, Elsevier 2011,pp.13-22.
[11] Gonzales, Woods, Eddins Digital Image Processing Using MATLAB 2nd edition, Tata McGraw Hill, 2012
[12] J.F. Scholl, E.L. Dereniak, “Higher-dimensional wavelet transforms for hyperspectral data compression of Data/Image Coding, Compression and feature recognition”, in: M.S. Schmalz (Ed.), Mathematics and Encryption VI with Applications, Proceedings of SPIE, Volume 5208, 2003, pp. 129–140
[13] J.M. Shapiro, “Embedded image coding using zerotrees of wavelet coefficients”, IEEE Trans. Signal Process. Vol.41, no.12, pp.3445-3462, Dec1993.
[14] A. Said, W. A. Pearlman, “A New Fast and Efficient Image Codec Based on Set Partitioning in Hierarchical Trees”, IEEE Transactions on circuits and systems for video technology, vol. 6, June 1996