International Journal of Advanced Engineering Research and Applications May – 2015
www.ijaera.org 10
Effect of Process Parameters on MRR for HCHCr in WEDM using RSM
Pawan Bishnoi1 & Kartik Kaushal2*
1Assistant Professor & HOD, Mechanical Engineering Department Yagyavalkya Institute of Technology, Opposite Chokhi Dhani, Jaipur, INDIA
E-mail: [email protected]
2U.G. Student, Department of Mechanical Engineering, M. M. University, Mullana, Haryana, INDIA *E-mail: [email protected]
Abstract: Wire electrical discharge machining (WEDM) is a specialized thermal machining process capable of accurately machining parts of hard materials with complex shapes. Response surface methodology (RSM) with central composite design is selected for experimentation. In the present work, four factors are taken as input parameters, and the effect of these parameters on MRR are studied. The influence of the input parameters on response in WEDM process has been examined. The input parameters are Pulse on time (Ton), Pulse off time (Toff), Servo voltage (SV) and peak current (IP). The experiments have been performed on high chromium high carbon steel with a wire of diameter 0.2 mm and the obtained data has been analyzed with the help of RSM using design expert software. The work piece material was a high carbon high chromium (HCHCr) die steel with excellent wear resistance, hot toughness and good thermal shock resistance. The experiments shows that Pulse on time (Ton), Pulse off time (Toff), Servo voltage (SV) and peak current (IP) influence MRR. Results show that machining speed increases with increase in the pulse on-time and the pulse off-time increases as the number of discharges within given period of time decreases. Moreover, there is not much influence of servo voltage on MRR and it increases very slightly with increase in peak current. Also, as the Ton increases the MRR increases and as Toff increases MRR decreases. This is because as Ton increases number of sparks per unit time increases and as Toff increases the sparks per unit time decreases.
Keywords: Wire Electric Discharge Machining, Material Removal Rate, Central Composite Design, Response Surface Methodology
I. INTRODUCTION
Wire Electric Discharge Machining (WEDM) has become an important machining because it can machine the difficult-to-machine materials like titanium alloys and zirconium which cannot be machined by conventional machining processes. It can produce parts with complex shapes and profiles and performed by a series of spark erosions. These sparks are produced between the work piece and a wire electrode (usually less than 0.30 mm diameter) separated by a dielectric fluid and erodes the work piece to produce complex two and three dimensional shapes according to a numerically controlled pre-programmed path. The sparks produce heating and melt work piece surface to form debris which is then flushed away by dielectric pressure. During the cutting process there is no direct contact between the work piece and the wire electrode [1, 14].
www.ijaera.org 11
researchers. Patil and Waghmare [14] presented the good amount of literature on WEDM. Some of the contributions related to the present study are discussed below.
Spedding and Wang [1] made an attempt at modeling the process through RSM and ANN. RSM model based on a central composite rotatable experimental design, and a 4-16-3 size back-propagation neural network has been developed. The pulse-width, time between two pulses, wire mechanical tension and injection set-point were selected as the factors (input parameters); whilst the cutting speed, surface roughness and surface waviness were the responses (output parameters). Both models were compared and verification experiments have been carried out to check validity of models. They concluded that both models provide accurate results for the process. Mohri et al [2] carried out an investigation on the dynamic wire vibration mechanism and a mathematical model was derived. The measured displacement of a wire electrode in machining a thin plate was analyzed with impulsive force measured through impulse response by a single discharge. They concluded that the force acting on wire depends on direction of wire movement in vibration. Huang et al [3] made an attempt to unveil the influence of machining parameters (pulse-on time, pulse-off time, table feed-rate, flushing pressure, distance between wire periphery and work piece surface) on machining performance of WEDM in finish cutting operations. Mathematical models relating machining parameters and performance were established by regression and non-linear programming using feasible-direction algorithm to obtain optimal machining parameters. Experimental results show that the proposed approach can achieve better performance than that achieved by a well-skilled operator.
Puri and Bhattacharya [4] carried out an extensive study of wire lag phenomenon in WEDM and established trend of variation of geometrical inaccuracy caused due to wire lag with various machine control parameters. Guo et al [5] adopted a method of computer simulation to study the vibration of wire electrode under the action of successive discharges, by which the effect of wire fluctuation on distribution of discharge points was also analyzed.
Tosun et al [6] carried out an investigation on the effect and optimization of machining parameters on the kerf (cutting width) and MRR in WEDM operations. The experimental studies were conducted under varying pulse duration, open circuit voltage, wire speed and dielectric flushing pressure. The settings of machining parameters were determined by using Taguchi experimentation. The level of importance of machining parameters on cutting kerf and MRR was determined by using ANOVA. The optimum machining parameter combination was obtained by using analysis of signal-to-noise ratio. The variation of kerf and MRR with machining parameters was mathematically modeled by using regression analysis method. The optimal search for machining parameters for the objective of minimum kerf together with maximum MRR was performed by using the established mathematical models. Hasçalýk and Çaydaş [7] adopted an experimental investigation of the machining characteristics of AISI D5 tool steel in WEDM. During experiments, parameters such as open circuit voltage, pulse duration, wire speed and dielectric fluid pressure were changed to explore their effect on the surface roughness and metallurgical structure. Optical and scanning electron microscopy, surface roughness and micro hardness tests were used to study the characteristics of the machined specimens. Taking into consideration the experimental results, it is found that the intensity of process energy does affect the amount of recast and surface roughness as well as micro cracking, wire speed and dielectric fluid pressure not seeming to have much of an influence.
www.ijaera.org 12
to optimize WEDM machining parameters. This paper outlines the development of a model and its application to optimize WEDM machining parameters. Experiments were conducted to test the model and satisfactory results were obtained.
Kanlayasiri and Boonmung [10] presented an investigation of the effects of machining variables on surface roughness of WEDMed DC53 die steel. Result shows that pulse-on time and pulse-peak current were significant variables to the surface roughness of WEDMed DC53 die steel. The surface roughness of test specimen increases when these two parameters increase. The developed mathematical model was validated with a new set of experimental data and maximum prediction error of the model was less than 7% . Haddad and Tehrani [11] carried out a surface roughness (Ra), roundness and MRR study on the cylindrical wire electrical discharge turning. The material chosen in this case was AISI D3 tool steel due to its growing range of applications in the field of manufacturing tools dies and moulds. This study was conducted only for the finishing stages to investigate the influence of four design factors power, voltage, and pulse off time and spindle rotational speed, over the three previously mentioned response variables. For MRR, Ra and roundness, regression models have been developed by using RSM.
Portillo [12] presented the design and development of a real-time monitoring and diagnostic system for diagnosing the degraded behavior in WEDM. The detection in advance of degraded behavior was crucial since this can lead to the breakage of cutting tool (wire), reducing process productivity and required accuracy. Singh and Garg [13] investigated the effects of various process parameters of WEDM like pulse on time (TON), pulse off time (TOFF), gap voltage (SV), peak current (IP), wire feed (WF) and wire tension (WT) to reveal their impact on MRR of hot die steel (H-11) using one variable at a time approach. The optimal set of process parameters has also been predicted to maximize the MRR .
II. METHODOLOGY AND EXPERMENTATION
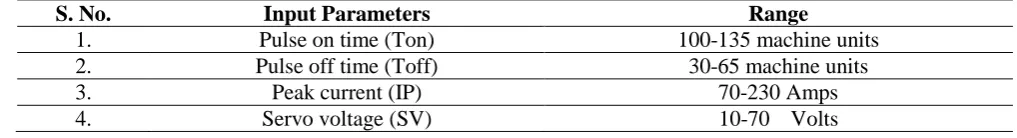
RSM methodology with central composite design is selected for experimentation. RSM is a compilation of mathematical and statistical methods which is used to build up, advance and optimise a process or product. This methodology was initially presented by Box and Wilson in 1951. The key scheme of RSM is to use a series of planned experiments in order to find an optimal answer (response). It comprises statistical experimental designs, regression modeling techniques, and optimization methods. Most applications of RSM involve experimental situations where several independent (or control) variables potentially impact one or more response variable. The independent variables are controlled by the experimenter, in a designed experiment, while the response variable is an observed output of the experiment. The most popular response surface design is the central composite design (CCD). A CCD has three groups of design points: (a) Factorial points (b) Axial points (c) Center points. CCD's are designed to estimate the coefficients of a quadratic model. In the present work, four factors are taken as input parameters and the effect of these parameters on MRR are calculated. There are various process parameters of WEDM affecting the machining characteristics. On the basis of literature review and some pilot investigations (not reported here), the following process parameters have been selected for study in the range shown in table 1.
Table 1: Process parameters with their ranges
S. No. Input Parameters Range
1. Pulse on time (Ton) 100-135 machine units
2. Pulse off time (Toff) 30-65 machine units
3. Peak current (IP) 70-230 Amps
www.ijaera.org 13
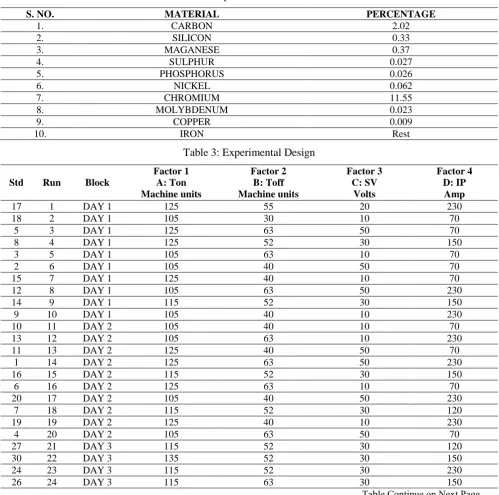
The experimental study was performed on ELECTRONICA© SPRINTCUT WEDM machine installed at AMT Lab of the Mechanical Engineering Department, NIT Kurukshetra. WEDM is a four axes machine and capable to control all four axes simultaneously. The machine performs multiplicity of operations in one setup. The work piece material is a high carbon high chromium (HCHCr) die steel with excellent wear resistance, hot toughness and good thermal shock resistance. The chemical composition of the material is shown in table 2.
The experimental work is carried out as per the central composite design using RSM methodology. The design is prepared with the help of Design expert software version 8.0.3 which is used to create experimental designs. The design is shown in table 3.
Table 2: Composition of work material
S. NO. MATERIAL PERCENTAGE
1. CARBON 2.02
2. SILICON 0.33
3. MAGANESE 0.37
4. SULPHUR 0.027
5. PHOSPHORUS 0.026
6. NICKEL 0.062
7. CHROMIUM 11.55
8. MOLYBDENUM 0.023
9. COPPER 0.009
10. IRON Rest
Table 3: Experimental Design
Std Run Block
Factor 1 A: Ton Machine units
Factor 2 B: Toff Machine units
Factor 3 C: SV
Volts
Factor 4 D: IP Amp
17 1 DAY 1 125 55 20 230
18 2 DAY 1 105 30 10 70
5 3 DAY 1 125 63 50 70
8 4 DAY 1 125 52 30 150
3 5 DAY 1 105 63 10 70
2 6 DAY 1 105 40 50 70
15 7 DAY 1 125 40 10 70
12 8 DAY 1 105 63 50 230
14 9 DAY 1 115 52 30 150
9 10 DAY 1 105 40 10 230
10 11 DAY 2 105 40 10 70
13 12 DAY 2 105 63 10 230
11 13 DAY 2 125 40 50 70
1 14 DAY 2 125 63 50 230
16 15 DAY 2 115 52 30 150
6 16 DAY 2 125 63 10 70
20 17 DAY 2 105 40 50 230
7 18 DAY 2 115 52 30 120
19 19 DAY 2 125 40 10 230
4 20 DAY 2 105 63 50 70
27 21 DAY 3 115 52 30 120
30 22 DAY 3 135 52 30 150
24 23 DAY 3 115 52 30 230
26 24 DAY 3 115 63 30 150
www.ijaera.org 14
21 25 DAY 3 105 52 30 150
28 26 DAY 3 105 63 70 150
22 27 DAY 3 125 52 30 230
25 28 DAY 3 125 52 20 230
23 29 DAY 3 125 40 20 230
29 30 DAY 3 95 40 20 120
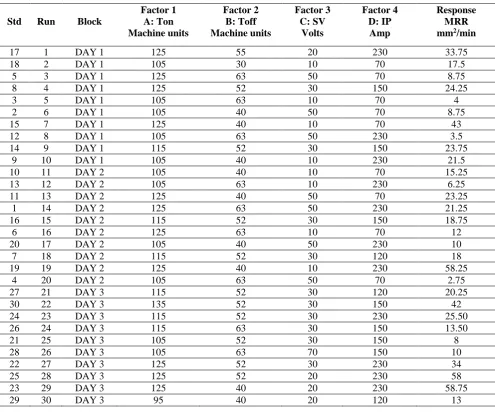
Based on the experimental design as given in table 3 the specimens were prepared and the values of selected machining characteristics i.e. MRR are reported in table 4.
Table 4: Experimental Design with Response Data
Std Run Block
Factor 1 A: Ton Machine units Factor 2 B: Toff Machine units Factor 3 C: SV Volts Factor 4 D: IP Amp Response MRR mm2/min
17 1 DAY 1 125 55 20 230 33.75
18 2 DAY 1 105 30 10 70 17.5
5 3 DAY 1 125 63 50 70 8.75
8 4 DAY 1 125 52 30 150 24.25
3 5 DAY 1 105 63 10 70 4
2 6 DAY 1 105 40 50 70 8.75
15 7 DAY 1 125 40 10 70 43
12 8 DAY 1 105 63 50 230 3.5
14 9 DAY 1 115 52 30 150 23.75
9 10 DAY 1 105 40 10 230 21.5
10 11 DAY 2 105 40 10 70 15.25
13 12 DAY 2 105 63 10 230 6.25
11 13 DAY 2 125 40 50 70 23.25
1 14 DAY 2 125 63 50 230 21.25
16 15 DAY 2 115 52 30 150 18.75
6 16 DAY 2 125 63 10 70 12
20 17 DAY 2 105 40 50 230 10
7 18 DAY 2 115 52 30 120 18
19 19 DAY 2 125 40 10 230 58.25
4 20 DAY 2 105 63 50 70 2.75
27 21 DAY 3 115 52 30 120 20.25
30 22 DAY 3 135 52 30 150 42
24 23 DAY 3 115 52 30 230 25.50
26 24 DAY 3 115 63 30 150 13.50
21 25 DAY 3 105 52 30 150 8
28 26 DAY 3 105 63 70 150 10
22 27 DAY 3 125 52 30 230 34
25 28 DAY 3 125 52 20 230 58
23 29 DAY 3 125 40 20 230 58.75
29 30 DAY 3 95 40 20 120 13
III. ANALYSIS OF EXPERIMENTAL RESULTS
www.ijaera.org 15
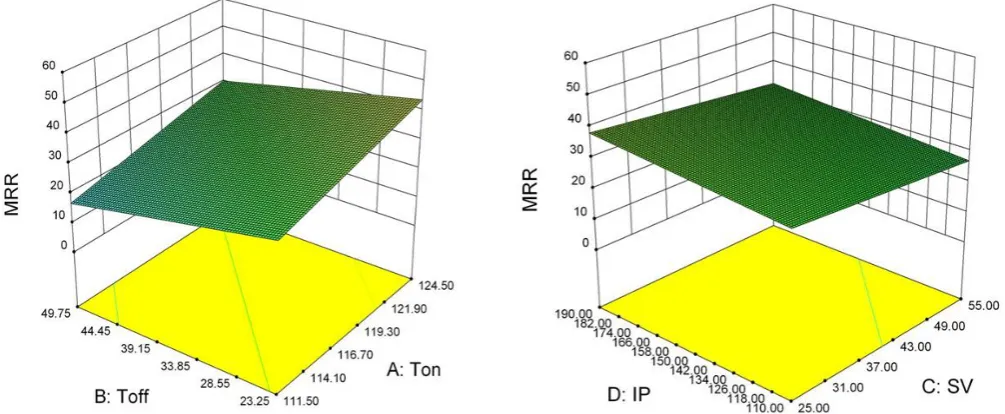
Figure 1 revealed that machining speed increases with increase in the pulse on-time. It means that the number of sparks in unit time increases which increase in discharge energy. As a result machining speed becomes faster with increase in pulse on time. So the pulse on time can be adjusted to get the desired MRR. Figure 2 presenting that the pulse off-time is increases as the number of discharges within given period of time decreases. This will lead to a lower machining speed. Figure 3 presents that there is not much influence of servo voltage on MRR. It can be seen from figure 4 that MRR increases very slightly with increase in peak current. So the peak current should be high to obtain higher MRR.
Figure 1: Effect of Ton on MRR Figure 2: Effect of Toff on MRR
Figure 3: Effect of SV on MRR Figure 4: Effect of IP on MRR
IV. 3-DGRAPH OF EFFECTS OF MACHINING PARAMETERS ON MRR
www.ijaera.org 16
increases and as IP increases MRR increases.This is because as Ton increases number of sparks per unit time increases and as IP increases, spark energy increases which results in increased MRR.
Figure 5: 3-D graph of Effects of Ton and Toff on MRR Figure 6: 3-D graph of Effects of IP and SV on MRR
Figure 7: 3-D graph of Effects of Ton and IP on MRR
V. DISCUSSION OF RESULTS
www.ijaera.org 17 Table 5: ANOVA for Response Surface Linear Model
Source Sum of
Squares
df Mean F
Square Value
F-Value p-Value
Block 608.33 2 304.16
Model 5823.52 4 1455.88 28.39 <0.0001 Significant
A-Ton 3112.93 1 3112.93 60.69 <0.0001
B-Toff 1152.54 1 1152.54 22.47 <0.0001
C-SV 255.31 1 255.31 4.98 0.0357
D-IP 546.24 1 546.24 10.65 0.0034
Residual 1179.64 23 51.29
Cor Total 7611.49 29
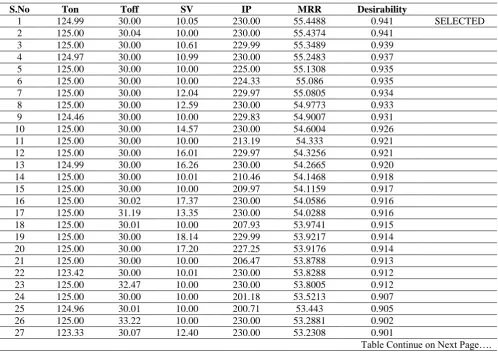
The results are optimized for desirability objective function that ranges from 0 to 1 (i.e (outside limit to goal). Optimization finds a point that maximizes the desirability function. The characteristics of a goal may be altered by adjusting the weight or importance. One desirability function contains various goals of factors and responses. The value is dependent on settings of lower and upper limits corresponding to real optimum. Optimization finds a superior set of conditions that will meet all the goals, not to acquire to a desirability value of 1.0. According to desirability the solutions are reported in table 6.
Table 6: Solutions according to desirability
S.No Ton Toff SV IP MRR Desirability
1 124.99 30.00 10.05 230.00 55.4488 0.941 SELECTED
2 125.00 30.04 10.00 230.00 55.4374 0.941
3 125.00 30.00 10.61 229.99 55.3489 0.939
4 124.97 30.00 10.99 230.00 55.2483 0.937
5 125.00 30.00 10.00 225.00 55.1308 0.935
6 125.00 30.00 10.00 224.33 55.086 0.935
7 125.00 30.00 12.04 229.97 55.0805 0.934
8 125.00 30.00 12.59 230.00 54.9773 0.933
9 124.46 30.00 10.00 229.83 54.9007 0.931
10 125.00 30.00 14.57 230.00 54.6004 0.926
11 125.00 30.00 10.00 213.19 54.333 0.921
12 125.00 30.00 16.01 229.97 54.3256 0.921
13 124.99 30.00 16.26 230.00 54.2665 0.920
14 125.00 30.00 10.01 210.46 54.1468 0.918
15 125.00 30.00 10.00 209.97 54.1159 0.917
16 125.00 30.02 17.37 230.00 54.0586 0.916
17 125.00 31.19 13.35 230.00 54.0288 0.916
18 125.00 30.01 10.00 207.93 53.9741 0.915
19 125.00 30.00 18.14 229.99 53.9217 0.914
20 125.00 30.00 17.20 227.25 53.9176 0.914
21 125.00 30.00 10.00 206.47 53.8788 0.913
22 123.42 30.00 10.01 230.00 53.8288 0.912
23 125.00 32.47 10.00 230.00 53.8005 0.912
24 125.00 30.00 10.00 201.18 53.5213 0.907
25 124.96 30.01 10.00 200.71 53.443 0.905
26 125.00 33.22 10.00 230.00 53.2881 0.902
27 123.33 30.07 12.40 230.00 53.2308 0.901
www.ijaera.org 18
28 122.73 30.09 10.00 230.00 53.0584 0.898
29 122.65 30.00 10.00 230.00 53.0339 0.898
30 125.00 30.00 10.00 192.55 52.9367 0.896
31 124.99 30.00 10.06 191.79 52.8682 0.895
32 125.00 32.96 13.54 230.00 52.7976 0.894
33 125.00 30.00 25.26 230.00 52.5727 0.890
34 124.26 30.00 21.40 230.00 52.5362 0.889
35 125.00 30.00 10.00 182.77 52.2772 0.884
36 121.43 30.00 10.00 230.00 51.7609 0.875
37 123.65 30.00 10.00 185.02 51.0321 0.862
38 125.00 30.00 37.00 230.00 50.3382 0.850
39 125.00 30.00 10.72 155.36 50.2882 0.849
40 119.93 30.00 10.42 230.00 50.1295 0.846
41 125.00 30.00 38.76 230.00 50.009 0.844
42 120.48 30.00 10.35 217.33 49.8562 0.841
43 125.00 30.01 10.00 143.85 49.6378 0.837
44 125.00 30.00 10.10 137.44 49.1938 0.829
45 125.00 30.00 43.41 230.00 49.1264 0.828
46 118.94 30.00 10.04 227.21 48.9841 0.826
47 125.00 30.02 10.00 125.48 48.3919 0.815
48 125.00 30.00 48.12 230.00 48.2337 0.812
49 125.00 30.03 49.69 230.00 47.9137 0.806
50 124.96 30.00 10.00 116.19 47.731 0.803
51 125.00 41.95 10.00 230.00 47.3881 0.797
52 124.64 30.00 10.00 115.41 47.3514 0.796
53 124.91 30.00 10.00 106.66 47.0399 0.791
54 124.57 54.19 10.00 230.00 38.6565 0.641
55 120.02 30.18 70.00 70.00 27.9702 0.450
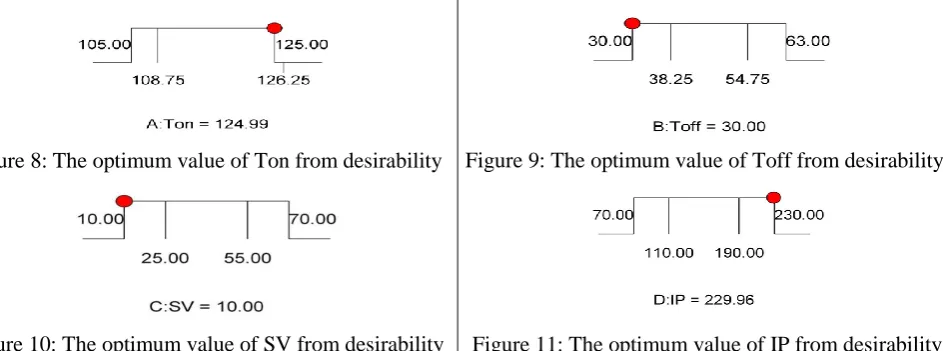
The optimal values of process parameters and response (MRR) using desirability are as shown in ramp graphs (Figure 8 to 12). The correlation between the four input process parameters - Pulse on time (Ton), Pulse off time (Toff), Servo voltage (SV), peak current (IP), and the MRR has been ascertained through RSM. Final equation in terms of coded factors can be given by; MRR= +32.74 + 6.76 * A- 8.99 * B - 2.86 * C +2.72 * D and the final equation in terms of actual factors is
MRR= -67.72224+1.03954*Ton-0.67843*Toff-0.19063*SV+0.06791*IP. Three confirmation
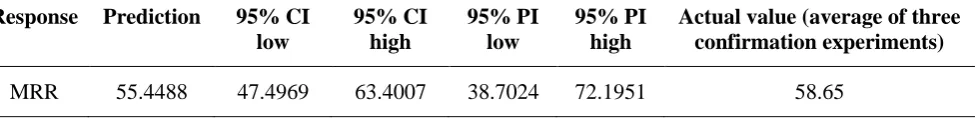
experiments were conducted at the pridicted optimal setting of the process parameters and there average values have been reported in table 7.
Figure 8: The optimum value of Ton from desirability Figure 9: The optimum value of Toff from desirability
www.ijaera.org 19 Figure 12: The optimum value of MRR from desirability
Table 7: Point prediction at optimal value of response (MRR)
Response Prediction 95% CI low
95% CI high
95% PI low
95% PI high
Actual value (average of three confirmation experiments)
MRR 55.4488 47.4969 63.4007 38.7024 72.1951 58.65
VI. CONCLUSIONS AND FUTURE SCOPES
The following conclusions are drawn from the experimental study: (1) when pulse on time is increased the MRR increases, (2) when pulse off time is increased the MRR decreases, (3) when servo voltage is increased the MRR decreases, (4) when peak current is increased the MRR is increases, (5) the mathematical model for MRR is given by (-67.72224+1.03954*Ton-0.67843*Toff-0.19063*SV+0.06791*IP) and (6) the optimum value of four process parameters are: (i) the optimum value of Ton = 125, (ii) the optimum value of Toff = 30, (iii) the optimum value of SV = 10, (iv) the optimum value of IP = 230 and (v) the optimum value of MRR is 55.4509 mm2/min.
Analysis of the results obtained from the current work suggests several feasible extensions to the research. Some of them are; (1) the process parameters can be increased for investigation, (2) multiple response optimizations may be carried out instead of single response study, (3) in this work de-ionized water is used as dielectric. It would be interesting to compare the process performance of other gaseous dielectrics, (4) in terms of applications, the WEDM process may be implemented for micromachining. Not much work has been done in this field so far and it would require building up a knowledge base for the process at the micro-level to make Wire Electric Discharge Micromachining feasible.
VII. REFERENCES
[1] Spedding, T. A., & Wang, Z. Q. (1997). Study on modeling of wire EDM process. Journal of Materials Processing Technology, 69(1), 18-28.
[2] Mohri, N., Yamada, H., Furutani, K., Narikiyo, T., & Magara, T. (1998). System identification of wire electrical discharge machining. CIRP Annals-Manufacturing Technology, 47(1), 173-176.
[3] Huang, J. T., Liao, Y. S., & Hsue, W. J. (1999). Determination of finish-cutting operation number and machining-parameters setting in wire electrical discharge machining. Journal of materials processing technology, 87(1), 69-81.
[4] Puri, A. B., & Bhattacharyya, B. (2003). An analysis and optimisation of the geometrical inaccuracy due to wire lag phenomenon in WEDM. International journal of Machine tools and manufacture, 43(2), 151-159.
www.ijaera.org 20
[6] Tosun, N., Cogun, C., & Tosun, G. (2004). A study on kerf and material removal rate in wire electrical discharge machining based on Taguchi method. Journal of Materials Processing Technology, 152(3), 316-322.
[7] Hasçalýk, A., & Çaydaş, U. (2004). Experimental study of wire electrical discharge machining of AISI D5 tool steel. Journal of Materials Processing Technology, 148(3), 362-367.
[8] Hewidy, M. S., El-Taweel, T. A., & El-Safty, M. F. (2005). Modelling the machining parameters of wire electrical discharge machining of Inconel 601 using RSM. Journal of Materials Processing Technology, 169(2), 328-336.
[9] Mahapatra, S. S., & Patnaik, A. (2006). Parametric optimization of wire electrical discharge machining (WEDM) process using Taguchi method. Journal of the Brazilian Society of Mechanical Sciences and Engineering, 28(4), 422-429.
[10] Kanlayasiri, K., & Boonmung, S. (2007). An investigation on effects of wire-EDM machining parameters on surface roughness of newly developed DC53 die steel. Journal of Materials Processing Technology, 187, 26-29.
[11] Haddad, M. J., & Tehrani, A. F. (2008). Investigation of cylindrical wire electrical discharge turning (CWEDT) of AISI D3 tool steel based on statistical analysis. Journal of materials processing Technology, 198(1), 77-85.
[12] Portillo, E., Marcos, M., Cabanes, I., & Orive, D. (2009). Real-time monitoring and diagnosing in wire-electro discharge machining. The International Journal of Advanced Manufacturing Technology, 44(3-4), 273-282.
[13] Singh, H., & Garg, R. (2009). Effects of process parameters on material removal rate in WEDM. Journal of Achievements in Materials and Manufacturing Engineering, 32(1), 70-74.