Original Research Article
Evaluation of the performance of a nutrition rehabilitation centre in a
tertiary care hospital in Eastern India
Mayadhar Panda
1, Sikata Nanda
1*, Mangala Charan Murmu
1,
Rama Chandra Giri
1, Lila Lalantika Debi
2INTRODUCTION
Globally, 35% of the 7.6 million deaths among children under five years of age can be attributed to nutrition-related factors and 4.4% to severe wasting, making it clear that prevention and treatment of acute malnutrition is critical to child survival and development.1 In 2013, 2.9 million under-five children were admitted globally for treatment of SAM.The latest World Health Organization
(WHO)-UNICEF-World Bank (2015) joint estimate indicates that globally, the numbers of under-five children with wasting have remained high between 1990 and 2014, with the largest proportions of wasted children living in Asia (68.0%) and Africa (28.0%).2
Odisha has a total population of approximately 42 million and an under-five population of approximately 3.7 million.According to the NFHS -4 conducted in 2015-16, at the national level severely wasted children comprise
ABSTRACT
Background: Severe acute malnutrition (SAM) places extraordinary challenges in the way of survival, growth and development of the child under five years of age. Our aim was to evaluate the functioning and performance of facility based management of SAM children admitted in the nutrition rehabilitation centre (NRC) and to identify the existing bottlenecks in the NRC.
Methods: Children above 1 month and less than 5 years of age with severe acute malnutrition were included during the study period. Demographic details of the SAM children, clinical features during admission were recorded. Anthropometric measurements like MUAC, weight, height/length and WHZ scores were taken at admission and compared with the findings at discharge. Statistical analysis: the data after collection, compilation was analysed by SPSS.
Results: Majority 277 (78.47%) of them belonged to rural areas. 300 (85%) SAM children were referred by medical officers. Bilateral oedema was recorded in 12 (17.9%) admitted children during 2014-2015, 22 (17.9%) children in 2015-2016 and in 37 (22.7%) children during 2016-2017. There was significant improvement in the mean weight (kg) and mean MUAC (cm) at discharge was in comparison to the weight and MUAC of the children at admission and this difference in increase in the mean weight and MUAC were found to be statistically significant.
Conclusions: Implementation of WHO feeding guidelines resulted in adequate weight gain of inpatient malnourished children, however the frontline workers in the community and health care providers of PHCs should be trained and given hands on training for early identification and referral of SAM cases.
Keywords: SAM, Nutrition rehabilitation centre
1
Department ofCommunity Medicine, S.C.B. Medical College, Cuttack, Odisha, India
2NRC, SVPPGIP, Shishu Bhawan, Cuttack, Odisha, India
Received: 20 February 2019
Revised: 20 March 2019
Accepted: 20 March 2019
*Correspondence:
Dr. Sikata Nanda,
E-mail: [email protected]
Copyright: © the author(s), publisher and licensee Medip Academy. This is an open-access article distributed under the terms of the Creative Commons Attribution Non-Commercial License, which permits unrestricted non-commercial use, distribution, and reproduction in any medium, provided the original work is properly cited.
7.5% of the under-five population, 38.4 % of children between 0-5 years were severely stunted, 35.7 % were severely underweight. In Odisha, as per NFHS-4, 20.4% of children between 0-5 years of age are wasted, 6.4% are severely wasted, and 34.4% are underweight.3 In Odisha, facility based management of SAM through NRC has been an important intervention to treat children with SAM. Under nutrition results in adverse physical, cognitive and/or emotional results in the short term as well as in the long-term health and well-being of an individual. Its deleterious effects on the socio economic development and health of the society are well recognised, and under nutrition is taken to be an indication of a society’s wellbeing. Facility based management takes place in a NRC, a unit in the health facility, where children with SAM are admitted and managed through medical and nutritional therapeutic care. The identification of children with SAM is carried out through platforms such as the monthly village health and nutrition days (VHND). Frontline workers like, ASHA, AWWs, ANMs play an important role in identification of SAM cases while conducting the VHND sessions. Identification of SAM cases is also being carried out by rashtriya bal swasthya karyakram (RBSK) team as well.4 Nutritional status among young children is commonly assessed through three standard physical indices: (i) length/height for age; (ii) weight for age; and (iii) weight for length/ height. The extent to which the index of each child differs from the ‘norm’ i.e., the child’s z-score can be calculated.5
Classification of acute childhood under nutrition as follows:6
Moderate acute malnutrition (MAM): A child with weight for height Z (WHZ) score of less than -2SD but greater than -3SD and/or MUAC between 11.5 cm to 12.4 cm.
SAM
A child with severe visible wasting and/or WHZ score of less than -3SD and/or mid-upper arm circumference (MUAC) less than 11.5 cm and/or presence of bilateral pitting oedema.
SAM places extraordinary challenges in the way of survival, growth and development of the child under five years of age. Children with SAM are nine times more likely to die than well-nourished children.6 Facility based management is provided to SAM children with medical complications. During the stay in NRC, along with
medical and nutritional therapeutic care,
mothers/caregivers are also provided counselling and support to address the reasons for poor nutrition and health in their child. Global guidance for SAM children with complications is to provide the in-patient child with F75 (75 kcal or 315 kJ/100 ml) or F100 (100 kcal or 420kJ/100 ml) or RUTF as per their requirements.7 The child is discharged when following criteria are met: oedema has resolved; child has achieved weight gain of ≥15% and has satisfactory weight gain for 3 consecutive
days (>5 g/kg/day); child is eating an adequate amount of nutritious food that the mother can prepare at home; all Infections and other medical complications have been treated.8 After discharge, the child is followed up in the community to avoid relapse. Hence this particular study was undertaken with the following aims and objectives.
Objectives were to evaluate the functioning and performance of facility based management of SAM children admitted in the NRC, to identify the existing bottlenecks in the NRC and to propose recommendations to address these bottlenecks.
METHODS
Type of study
A cross sectional hospital based study was conducted among the SAM children between the age group of 1 month to 5 years, admitted to the NRC.
Place of study
Nutrition rehabilitation centre, Sishu bhawan, Cuttack, Odisha.
Period of study
Study conducted from May 2014 to March 2017.
Study participants
All the SAM children in the age of 1 month to 5 years admitted in the NRC.
Study tool
Apre-designed and pretested questionnaire was used for collection of data regarding various aspects of the SAM. Informed consent from the care-givers of the participants was taken prior to enrolment of children in the study. The data included socio demographic details, baseline characteristics like mother’s education and SES was assessed by BG Prasad SES scale. Interview schedule of mothers was translated into Odia and again retranslated into English by language experts to rectify the discrepancies. Anthropometric measurements including weight in kg and length/height in cm, MUAC, WHZ score were recorded. Weight of the children was taken every day in the morning at same time before starting their morning feed. The weight change was calculated daily in gm/kg/day. Similarly weight, MUAC, WHZ score and presence/absence of oedema at discharge was compared with that of the admission findings.
Statistical analysis
percentages. To compare the quantitative data at admission and discharge, paired t- test was applied for the three consecutive years. P<0.05 was considered to be significant and p<0.01 was considered as highly significant.
RESULTS
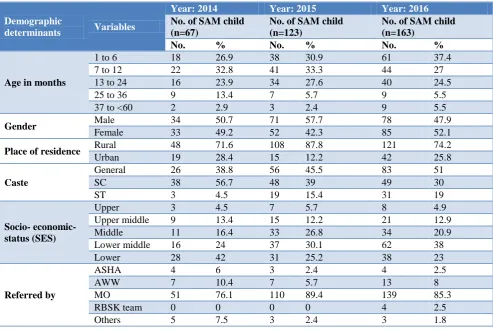
Table 1 reveals that the number of SAM children admitted to the NRC from 2014 to 2017 was 353. Out of which 67 were admitted during 2014-2015, 123 were admitted during 2015-2016 and 163 were admitted during 2016-2017. There has been an increase in the number of
admissions of SAM children over the three years. Of the total 353 admitted SAM children during this three years, 170 (48.16%) were girls while183 (51.84%) were boys. Analysis by age group showed that 117 (33.14 %) were in the age group of 0-6 months, 107 (30.31%) were in the age group of 7-12 months, 90 (25.5 %) cases were in the age group of 13-24 months, 25 (7.08 %) were in the age group of 25-36 months, and 14 (3.97 %) in the age group of 37-59 months. So majority (89%) of the SAM children were within 24 months. 135 (38.24%) of the admitted children were from SC, 53 (15.01 %) were from ST, and the remaining major portion 165 (46.75 %) were from general category.
Table 1: Distribution of SAM children according to socio-demographic determinants.
Demographic
determinants Variables
Year: 2014 Year: 2015 Year: 2016
No. of SAM child (n=67)
No. of SAM child (n=123)
No. of SAM child (n=163)
No. % No. % No. %
Age in months
1 to 6 18 26.9 38 30.9 61 37.4
7 to 12 22 32.8 41 33.3 44 27
13 to 24 16 23.9 34 27.6 40 24.5
25 to 36 9 13.4 7 5.7 9 5.5
37 to <60 2 2.9 3 2.4 9 5.5
Gender Male 34 50.7 71 57.7 78 47.9
Female 33 49.2 52 42.3 85 52.1
Place of residence Rural 48 71.6 108 87.8 121 74.2
Urban 19 28.4 15 12.2 42 25.8
Caste
General 26 38.8 56 45.5 83 51
SC 38 56.7 48 39 49 30
ST 3 4.5 19 15.4 31 19
Socio- economic- status (SES)
Upper 3 4.5 7 5.7 8 4.9
Upper middle 9 13.4 15 12.2 21 12.9
Middle 11 16.4 33 26.8 34 20.9
Lower middle 16 24 37 30.1 62 38
Lower 28 42 31 25.2 38 23
Referred by
ASHA 4 6 3 2.4 4 2.5
AWW 7 10.4 7 5.7 13 8
MO 51 76.1 110 89.4 139 85.3
RBSK team 0 0 0 0 4 2.5
Others 5 7.5 3 2.4 3 1.8
Table 2: Year wise distribution of admitted SAM children based on diagnostic criteria.
Diagnosis of SAM Children by
Year: 2014-15 Year: 2015-16 Year: 2016-17
Total no. of
cases (n=67) %
Total no. of cases (n=123) %
Total no. of
cases (n=163) % Z score <3SD
(among children having length ≥45cm) 58 86.6 93 75.6 126 77.3
MUAC <11.5 cm
( among children >6 months) 48 71.6 76 61.7 78 47.9
Presence of B/L oedema 12 17.9 22 17.9 37 22.7
Table 2 shows the year wise distribution of SAM children admitted to NRC based on different diagnostic criteria as per NRC guideline. Bilateral oedema was recorded in 12 (17.9%) admitted children during the period 2014-2015,
place in May and June because this was considered the lean season for agricultural work. The lowest number of admissions (15%) took place in November, December and January months. In Odisha, these months are the paddy-harvesting season. The cause may be during this season, mothers are reluctant to commit 2-3 weeks of their time to the children with SAM, as it would mean a loss of daily income.
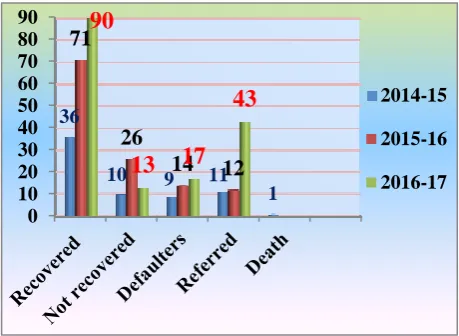
Figure 1 shows that, during 2014-15, out of the total 67 admitted SAM children, 11 cases were referred to ICU for better management, 9 cases were defaulters and one case died. 46 children were discharged from the NRC out of which 36 had recovered (cured) with a weight gain of ≥15% than the admission weight, but 10 cases did not recover. Similarly outcome status of NRC in the year 2016-17 showed that 12 cases were referred, 14 were defaulters. 71 out of a total of 97discharged children were recovered and 26 could not recover during their NRC stay. During 2016-17 out of a total of 163 SAM admissions 103 children were discharged from the NRC, among them 90 children recovered. During this year the
number of SAM children referred to higher facility and the total defaulters were 43 and 17 respectively.
Figure 1: Year wise outcome status of the SAM children admitted in the NRC.
Table 3: Year wise comparison of mean weight of SAM children at the time of admission and discharge.
Age group (months)
2014-2015 2015-2016 2016-2017
No. of SAM children Mean weight at admission (kg) Mean weight at discharge (kg) No. of SAM children Mean weight at admission (kg) Mean weight at discharge (kg) No. of SAM children Mean weight at admission (kg) Mean weight at discharge (kg)
1 to 6 12 2.43±0.78 2.89±0.85 31 2.39 +0.74 2.82± .79 35 2.26± .71 2.7±0.78
7 to 12 14 4.08 ±1.21 4.57 ±1.23 33 4.44 +1.37 5.07±1.5 32 4.44±1.16 5.08±1.2
13 to 24 12 5.67±1.15 6.4 ±1.60 25 6.1 +1.2 6.87±1.2 26 6.09±1.5 6.94±1.5
25 to 36 7 6.36±1.96 7.13±1.88 6 6.83±0.65 7.97±.80 7 7.22 ± .98 8.16±.87
37 to 60 1 6.4 7.39 2 8.23±0.55 9.84±.12 3 8.21±1.74 9.55±1.75
Total 46 4.46 ±1.89 5.06±2.08 97 4.44±1.97 5.09±2.2 103 4.42±2.12 5.08 2.33
Signifi-cance
N=46 , t=9.095, df=45, p<0.001 (highly significant)
N=97, t=17.789, df=96, p≤0.001 (highly significant)
N=103, t=18.61, df=102, p<0.001 (highly significant)
Table 4: Year wise comparison of MUAC of SAM children at time of admission and during discharge.
Age group (months)
2014-2015 2015-2016 2016-2017
No. of SAM children Mean MUAC at admission (cm) Mean MUAC at discharge (cm) No. of SAM children Mean MUAC at admission (cm) Mean MUAC at discharge (cm) No. of SAM children Mean MUAC at admission (cm) Mean MUAC at discharge (cm) 7 to 12 14 9.41±1.66 9.9±1.53 33 10.22±1.64 10.61±1.5 32 9.96±1.4 10.18±1.5
13 to 24 12 10.32±1.58 10.71±1.64 25 10.74±1.22 11.3±1.05 26 10.84±1.2 11.23±1.2
25 to 36 7 10.21±1.90 10.98±1.4 6 10.26±0.65 11.06±1.17 7 11.7±1.6 12.24±1.3
37 to 60 1 11.3 11.4 2 10.35±1.2 10.9±1.27 3 10.33±2.5 10.66±2.2
Total 34 9.95±1.68 10.45±1.5 66 10.43±1.41 10.94±1.33 68 10.5±1.5 10.82±1.56
Signifi-cance
N=34, df=33, t=4.557, p<0.001 (highly significant)
N=66, t=7.830, df=65, p≤0.001 (highly significant)
N=68, df=67, t=3.482, p<0.001 (highly Significant)
Table 3 shows year wise comparative analysis of mean weight at the time of admission and during discharge among the SAM children, during the study period i.e., in
the year (2014-2015), (2015-2016) and (2016-2017). Overall mean weight of the SAM children during admission and discharge in the 3 different years was
0 10 20 30 40 50 60 70 80 90 36
10 9 11 1
71
26
14
12
90
13 17
43
2014-152015-16
(4.46±1.89 kg and 5.06±2.08 kg) in 2014-2015, (4.44±1.97 kg and 5.09±2.2 kg) in the year 2015-2016 and (4.42±2.12 kg and 5.08±2.33 kg) during the year 2016-2017 respectively. The difference in the mean weights at the time of admission and discharge was found to be statistically highly significant across all the 3 years.
Table 4 shows, comparative analysis (year wise) of MUAC of SAM children at the time of admission and
discharge in the year 2014-2015. MUAC in cm at admission and discharge in the 3 different years (9.95±1.68cm and 10.45±1.5 cm) in 2014-15, (10.43 ±1.41cm and 10.9±1.33cm) in 2015-16 and (10.5±1.5cm and 10.82±1.56 cm) in the year 2016-17 respectively. There was significant improvement in the MUAC of the children at discharge with compared to MUAC at admission which was also statistically highly significant in all the 3 years.
Table 5: Comparison of WHZ scores of the SAM children at time of admission and discharge.
WHZ score
2014-2015 (n=46) 2015-2016 (n=92) 2016-2017 (n=96)
Admission (%)
Discharge (%)
Admission (%)
Discharge (%)
Admission (%)
Discharge (%) -1SD to >-2SD
(Mild) 2 (4.3) 11(23.9) 5(5.4) 20(21.7) 6(6.3) 29(30.2)
-2SD to -3SD
(MAM) 6 (13) 12(26.1) 13(14.2) 27(29.4) 13(13.5) 27(28.1)
<-3SD to ≥-4SD
(SAM) 8(17.4) 4(8.7) 16(17.4) 28(30.4) 21(21.9) 16(16.7)
<-4SD (SAM) 30 (65.2) 19(41.3) 58(63) 17(18.5) 56(58.3) 24(25)
Significance X2=12.03, df=3, p=0.007 X2=39.58, df=3, p<0.001 X2 =33.49, df=3, p<0.001
Table 5 shows year wise comparative analysis of WHZ score and depicts the proportion of SAM children showing improvement in the WHZ score at discharge in comparison to the admission findings across 3 different years. In 2014-15 all the discharged children (n=46) were taken for calculating the Z score whereas in the year 2015-16 and 2016-17, 5 children and 7 children respectively were not included for analysis, since their body length was below 45cm.
Of the total 67 SAM children admitted in the year 2014-2015, 46 children were discharged from the NRC. 38 out of 46 (82.6%) were having WHZ score below -3SD, out of which 30 (65.2%) were having Z score below–4SD. This provides an idea of the degree of severity of the acute malnutrition cases or the alertness of the frontline workers who could refer these cases to the NRC. Similarly proportion of SAM children in the year 2015-16 having WHZ score below -3SD i.e., 74 out of 92 children (80.4%) at admission was reduced to 45 (48.9%), and also in the year 2016-17 proportion of SAM children having WHZ score below -3SD was reduced from 77 (80.2%) to 40 (41.7%). This suggests that, there was significant improvement in the WHZ score at discharge in comparison to the admission finding and this difference was also found statistically significant.
DISCUSSION
A study on children with under-nourishment, conducted by Peter et al revealed that, majority of the SAM cases (94.5%) were from back ward castes (SC, ST, OBC).9 In a study by Hashmi et al most of the admitted children (41.77%) were in 12-23 months age group.10 88 (51.76%)
were females and 82 (48.24%) were males. In a similar study by Mulla et al majority of SAM children belong to age group less than 2 years, female gender, caste wise OBC, SC and ST category.11 ASHAs (accredited social health activists) played a key role in referring them to MTC (malnutrition treatment centre). In Odisha Das et al in their study revealed that out of total 130 patients the overall prevalence of SAM was 2.5%.12 Majorities (77%) were non edematous SAM (marasmus) and rest were oedematous (kwashiorkor). There was no variation in sex as both male and female patients were with equal percentage.
Sengupta et al conducted a cross-sectional survey of 200 randomly selected under-five children to determine the prevalence and risk factors of under-nutrition amongst under-five children living in an urban slum of Ludhiana.13 The study showed that 74% of the children were stunted and 29.5% of them were under-weight. A study done by Sharma et al showed that on the basis of IAP classification 72.5% were suffering from any form of malnutrition, and 22.4% from grade- III and IV (severe form) malnutrition.14 Srivastava et al carried out a cross-sectional study in selected urban slums of Bareilly district, Uttar Pradesh which showed that 66.3% were malnourished15 Nearly 32.5%, 16.9%, 8.4% and 8.4% were suffering from grade I, II, III and IV malnutrition respectively.
difference was observed between the mean weight at discharge and admission for the study group (t=14.552, p<0.001) and for boys (t=9.904, p<0.001) and girls (t=10.475, p<0.001) separately. Similarly mean MUAC at admission was 11.32±1.18 cm and at discharge was 11.94±1.38 cm. The difference was observed to be statistically significant (t=9.548, p<0.001).
CONCLUSION
A concrete set of recommendations to narrow the gaps in NRC’s effective implementation is essential which are as follows. Frontline workers, health workers in the community and PHCs should be trained and given hands on training to measure the weight, MUAC, WHZ score, and oedema of children aged 1-59 months. Process of identification and referral of SAM children from the community to NRC need to be further strengthened for early referral. During the VHND session, mothers/ caregivers are also to be provided counselling and support to address the reasons for poor nutrition and health to their child. Awareness generation amongst community members should actively be taken up regarding Iinfant and young child feeding (IYCF) practices.
ACKNOWLEDGEMENTS
The authors would like to thank caregivers of patients for their cooperation. They also would like to thank the medical superintendent, administrative officer, staff nurses of the Institute for providing infrastructure facilities for this study.
Funding: No funding sources Conflict of interest: None declared
Ethical approval: The study was approved by the Institutional Ethics Committee
REFERENCES
1. Operational Guidelines on Facility Based
Management of Children with Severe Acute Malnutrition, Ministry of Health and Family Welfare Government of India, 2011.
2. UNICEF Data: Monitoring the situation of children and women, 2016. Available at: http://data.unicef. org/ nutrition/malnutrition.html. Accessed on 1 February 2019.
3. India Fact sheet NFHS-4; 2015-16. Ministry of Health and Family Welfare, Government of India. Available at: http://rchiips.org/NFHS/pdf/NFHS4/ India.pdf. Accessed on 1 February 2019.
4. Guidelines for Management of Severe Acute
Malnutrition (SAM) Children at Nutrition
Rehabilitation Center; National Rural Health
Mission Department of Health and Family Welfare Government of Odisha (GoO), 2015.
5. Ghai OP. Text Book Of Essential pediatrics. 6th edition. CBS; 2011: 96-116.
6. World Health Organization, Country Office For India; National Rural Health Mission (IN). Facility Based Care of Severe Acute Malnutrition: Participant Manual (New Dehli), 2011.
7. Elizabeth K. Nutrition and child development; 4th edition. Triple Burden of Malnutrition. Paras Medical Publisher; 2014: 163-251.
8. International Institute for Population Sciences (IIPS): National Family Health Survey: NFHS-4:2015-16: District Fact Sheet: Cuttack: Ministry of Health and Family Welfare, Government of India, 2017.
9. Paul GP. Effect of Nutritional Intervention in
Undernourished Children at Nutritional
Rehabilitation Centre, Ongole, Andhra Pradesh. J Dental Med Sci. 2016;15(6):20-3.
10. Hashmi G. Evaluation of the effects of nutrition intervention measures on admitted children in nutritional rehabilitation centre, Gulbarga, India. Int J Community Med Public Health. 2016:3(9):2550-4. 11. Mulla S. An experience on facility based management at one of the malnutrition treatment centrein district Baran of Rajasthan, India. Int J Community Med Public Health. 2017:4(6):2163. 12. Das K. Clinical profile and outcome of children
with severe acute malnutrition. Int J Pediatric Res. 2017;4(5):350-6.
13. Sengupta P. Epidemiological correlates of under-nutrition in under-5 years children in an urban slum of Ludhiana. Health Population Perspectives Issues. 2010;33(1):1-9.
14. Sharma MK. Status of child undernutrition: some socio-demographic concerns in Allahabad, Uttar Pradesh. Indian J Prev Soc Med. 2011;42(1):38-43. 15. Srivastava A. Nutritional status of school-age
children - A scenario of urban slums in India. J Belgian Public Health Association. 2012:70-8 16. Taneja G, Dixit S, Khatri A, Yesikar V, Raghunath
D, Chourasiya S. A study to evaluate the effect of nutritional intervention measures on admitted children in selected nutrition rehabilitation centers of indore and ujjain divisions of the state of madhya pradesh (India). Indian J Community Med. 2012;37(2):107-15.