Original Research Article
A hospital based exploratory study to assess the reasons and timings of
seeking abortion services in a tertiary care hospital in Mumbai
Suradharadhika Ramkrishna, Nirbha Shirish Ghurye, Prashant Vilas Howal
*
INTRODUCTION
The annual abortion rate worldwide has declined from 40 per 1000 women of childbearing age (15-49 years) in 1990-1994 to 35 abortions per 1000 women in 2010-2014. The estimated total numbers increased from 50 million in 1990-94 to 56 million in 2010-14. This increase was mainly attributed to population growth.1 Globally there are regional variations. For e.g., eastern Europe has the highest annual abortion rate at 43 per 1000, but western Europe has the lowest abortion rate at
12 per 1000, whereas for England and Wales the figure is 16.5 per 1000.2
In India, The Medical Termination of Pregnancy Act was passed by the Parliament in 1971. It allows the termination of a pregnancy up to 20 weeks of gestation, on the grounds of wide-ranging medical and social reasons which are as follows
The continuance of the pregnancy would involve a risk to the life of the pregnant woman or of grave injury to physical or mental health.
ABSTRACT
Background: The adoption of the Medical Termination of Pregnancy (MTP) Act has allowed for abortion on the grounds of medical and social reasons since 1972.The aim of the present study is to establish the demographic of women seeking abortion care services and to determine the role of different factors in the timing of seeking an abortion.
Methods: A retrospective hospital record-based study was carried out among pregnant women seeking an MTP in a
tertiary care hospital in Mumbai. The records of women seeking MTP over a 5-year period from January 2012 to December 2016 were accessed and data pertaining to their demographic and obstetric history was recorded. Statistical tests of significance and analysis were done.
Results: A total of 803 women underwent an MTP from January 2012 to December 2016. The number of deliveries
during the same time period was 13735. The most common age group was 25-30 years. Stratification in terms of the educational backgrounds showed that 45.7% had received only secondary school education while 12.7% had no schooling. Majority of the women (74.8%) availed an MTP in the first trimester, out of which, most of them (36.9%) had 2 previous pregnancies. Most women coming in the second trimester (43.6%) hadn’t conceived before.
Conclusions: Education didn’t seem to be a significant factor in determining the timing of seeking an MTP. School education did not necessarily include exposure to sexual education. Experience in terms of parity was more relevant in identifying signs of pregnancy and seeking appropriate services in a timely manner.
Keywords: Medical termination of pregnancy, Safe abortion, Hospital based retrospective study, Timing and Mumbai
Department of Community Medicine, Grant Government Medical College, Mumbai, Maharashtra, India
Received: 26 August 2019
Accepted: 09 October 2019
*Correspondence:
Dr. Prashant Vilas Howal,
E-mail: [email protected]
Copyright: © the author(s), publisher and licensee Medip Academy. This is an open-access article distributed under the terms of the Creative Commons Attribution Non-Commercial License, which permits unrestricted non-commercial use, distribution, and reproduction in any medium, provided the original work is properly cited.
There is a substantial risk that if the child were born, it would suffer from such physical or mental abnormalities as to be seriously handicapped.
Where any pregnancy is alleged by the pregnant woman to have been caused by rape.
Where any pregnancy occurs as a result of failure of any device or method used by any married woman or her husband for the purpose of limiting the number of children.
According to the National Family Health Survey-4 conducted in 2015-2016, abortions accounted for 3.4% of the total pregnancies in India.3
A study was carried out by the Guttmacher Institute and the International Institute of Population Sciences, in 2015 which comprised of data on the number of MTP’s in both public and private institutions in India. Their findings showed a huge discrepancy in comparison to the numbers obtained in government surveys. According to their findings, an estimated 15.6 million abortions occurred in India in 2015, accounting for almost one third of all pregnancies. The abortion rate was 47·0 abortions per 1000 women in the reproductive age group (15-49 years). This discrepancy was attributed to the lack of reliable information on the incidence of induced abortion in India and the incomplete coverage provided by official statistics and national surveys.4
Despite the adoption of the Medical Termination of Pregnancy (MTP) Act more than 40 years ago, access to safe abortion services still remains inadequate.5 Access to safe MTP comes under the umbrella of reproductive rights, which every woman should be entitled to. The aim of the present study was to establish the demographic of women seeking abortion care services and to determine the role of different factors in the timing of seeking an abortion. This data could help devise strategies pertaining to sexual and reproductive health matters adapted to the demographic of women identified in the study.
METHODS
A retrospective hospital record-based study was carried out among pregnant women seeking an MTP in a tertiary care hospital in Mumbai. Ethical approval was granted by
the institutional ethics committee. Permission to access MTP records was obtained from the Head of Department of Obstetrics and Gynaecology.
The records of women seeking MTP over a 5 year period from January 2012 to December 2016 were accessed and data pertaining to their demographic and obstetric history was recorded in a data collection sheet. Strict confidentiality regarding their identity was maintained while recording the data. We hypothesized that younger, lesser educated women with no previous pregnancies were more likely to access MTP in the second trimester. Statistical tests of significance, odds ratio and logistic regression analysis was done using appropriate statistical software.
RESULTS
A total of 803 women underwent an MTP from January 2012 to December 2016. The mean age was 28.1 years. The majority of them were married (91.2 %) with unmarried women constituting 8.3% and 0.5% of the women were either divorced or widowed. Majority of the women (74.8%) availed an MTP in the first trimester (up to 12 weeks of gestation) while the remaining women came in the second trimester (25.2%).
Women in the age group 25-30 constituted 29.76% of the total making it the most common age group for women accessing an MTP, followed by 30-35 (26.2%), 20-25 (20.4%), 35-40 (13.8%) and 40-45 (1.6%). Extremes of age saw fewer numbers with women below 20 years of age constituting 7.6% and those above 45 years of age being 0.6%, therefore less than 10% of the total abortions were contributed by women in these age groups. However, women below 20 years of age constituted a larger proportion of second trimester abortions (18.3%) as compared to first trimester abortions (3.9%). When age was compared to timing of seeking an MTP, the age group most frequently attending in the first trimester was 25-30. However, this trend was not followed in 2nd trimester MTP. It in fact saw a nearly uniform distribution from ages 20 through 40 with 20-25 being the most common age group. This suggested that age did not play a major role in the timing of seeking an MTP (Table 1).
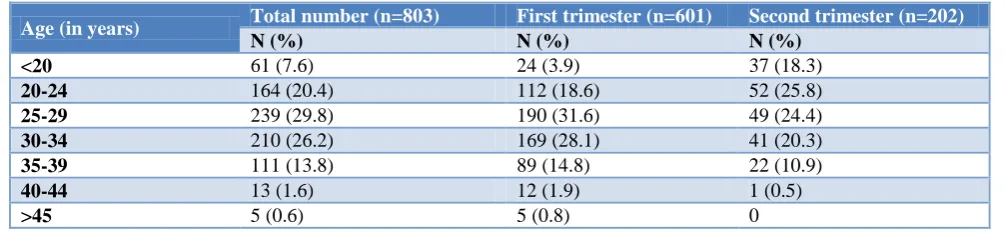
Table 1: Age wise distribution.
Age (in years) Total number (n=803) First trimester (n=601) Second trimester (n=202)
N (%) N (%) N (%)
<20 61 (7.6) 24 (3.9) 37 (18.3)
20-24 164 (20.4) 112 (18.6) 52 (25.8)
25-29 239 (29.8) 190 (31.6) 49 (24.4)
30-34 210 (26.2) 169 (28.1) 41 (20.3)
35-39 111 (13.8) 89 (14.8) 22 (10.9)
40-44 13 (1.6) 12 (1.9) 1 (0.5)
Women were categorised on the basis of their formal educational level in terms of schooling. Almost 3/4th of the women coming in for an MTP were secondary or higher educated. Most women coming in the first
trimester were educated up to the secondary school level, while most women coming in the second trimester were educated up to the higher secondary level. Out of 102 uneducated women who came in for an MTP, 79 (77.4%) of them came in the first trimester (Table 2).
Table 2: Distribution according to level of formal education.
Education Total number (n=803)
First trimester (n=601)
Second trimester (n=202)
N (%) N (%) N (%)
Uneducated (no formal schooling) 102 (12.7) 79 (13.1) 23 (11.4)
Standards 1-5 (primary) 96 (11.9) 76 (12.6) 20 (9.9)
Standards 6-10 (secondary) 367 (45.7) 273 (45.4) 94 (46.5)
Standards 11 and 12 (higher secondary) 127 (15.8) 89 (14.8) 38 (18.8)
Graduate 91 (11.3) 66 (11.0) 25 (12.4)
Post graduate 20 (2.5) 18 (3.0) 2 (1)
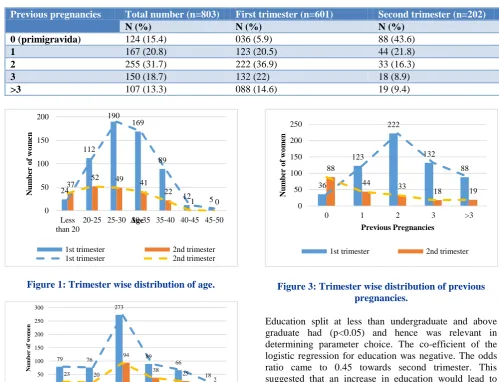
Table 3: Distribution according to previous pregnancies.
Previous pregnancies Total number (n=803) First trimester (n=601) Second trimester (n=202)
N (%) N (%) N (%)
0 (primigravida) 124 (15.4) 036 (5.9) 88 (43.6)
1 167 (20.8) 123 (20.5) 44 (21.8)
2 255 (31.7) 222 (36.9) 33 (16.3)
3 150 (18.7) 132 (22) 18 (8.9)
>3 107 (13.3) 088 (14.6) 19 (9.4)
Figure 1: Trimester wise distribution of age.
Figure 2: Trimester wise distribution of education.
Figure 3: Trimester wise distribution of previous pregnancies.
Education split at less than undergraduate and above graduate had (p<0.05) and hence was relevant in determining parameter choice. The co-efficient of the logistic regression for education was negative. The odds ratio came to 0.45 towards second trimester. This suggested that an increase in education would lead to women coming in earlier for an MTP.
Women were differentiated by their previous pregnancy status, such as primigravida and multigravida’s. Previous pregnancies were first split into women who hadn’t conceived before and those who had (p<0.05). This was further split into those who had one previous pregnancy and those who had two or more, which had a p<0.05 and
24 112
190 169
89
12 5
37 52 49 41
22
1 0
0 50 100 150 200 Less than 20
20-25 25-30 30-35 35-40 40-45 45-50
N u m b er o f w o m en Age
1st trimester 2nd trimester
1st trimester 2nd trimester
79 76
273
89 66
18
23 20
94 38 25 2 0 50 100 150 200 250 300
Uneducated Primary Secondary Higher
secondary Graduate Post Graduate Num b er of wom en Education
1st trimester 2nd trimester
1st trimester 2nd trimester
36 123 222 132 88 88
44 33
18 19
0 50 100 150 200 250
0 1 2 3 >3
N u m b er o f w o m en Previous Pregnancies
hence was relevant in determining parameter choice. The co-efficient of the logistic regression for previous pregnancies was negative.
The odds ratio came to 0.279 towards second trimester for the split between women who hadn’t conceived before and those who had, whereas the odds ratio for the split between women who had one previous pregnancy and those who had two or more was 0.59. This suggested that an increase in the number of previous pregnancies would lead to women coming in earlier for an MTP.
DISCUSSION
According to the Medical Termination of Pregnancy Act, pregnancies can be terminated up to 20 weeks. Termination of pregnancy performed during the first trimester only need the opinion of one registered medical practitioner and those taking place in the second trimester require the opinions of two doctors.6 Second trimester terminations have more legal stipulations and have a higher risk of complications. According to Bartlett et al., the risk of death increases exponentially by 38% for each additional week of gestation.7 Although second trimester abortions account for a lesser percentage of induced abortions, they are associated with a disproportionately higher rate of morbidity.8 Second trimester terminations also have higher cost and resource implications and are nearly twice as expensive in a government set-up in India.9 A quarter of women coming in for an MTP to tertiary hospital between January 2012 and December 2016 came during the second trimester.
This study tries to highlight the relation between the trimester in which MTP is sought to certain demographic factors and obstetric factors such as age, educational status and previous pregnancies.
The mean age of the women was 28.1 (range 13-50 years), with 29.8% of them being between the ages of 25 and 30. Similar results were obtained in studies conducted in the cities of Mangalore (South India) and Bareilly (North India). The study in Mangalore had results indicating the mean age to be 27.6 years (49.1%).10 Study conducted in Bareilly had findings indicating the most common age group to be 26-30 years (38%).11
The women coming in for first trimester MTP’s more commonly were between the ages of 25 and 30, whereas the most common age group among second trimester MTP’s was 20-25 years. Out of 61 women, less than the age of 20 years, 37 (60.7%) came in the second trimester, while 24 (39.3%) of them came in the first trimester. Our findings suggested that, when age was compared to timing of seeking abortion, the distribution of age across the second trimester was almost uniform. Although 20-25 was the most common age group, the distribution was
nearly uniform. Hence, age did not play a significant role in women coming for second trimester abortions. This was contrary to our hypothesis.
In our study, formal school education significantly affected the timing of seeking an abortion. A study conducted in Bareilly (North India) indicated that the majority of the patients were uneducated while one conducted in Chennai (South India) stated that majority of the women were primary school educated.11,12
We hypothesised that more of the uneducated women would avail an MTP in the second trimester owing to their lack of education. However, our findings showed that 77.45% of the uneducated women came in the first trimester (79 out of 102).
When numbers of previous pregnancies were observed relative to the timing of seeking MTP, it was seen in our study that 71% of primigravid women (88 out of 124) came in the second trimester as compared to 29% in the first trimester (36 out of 124).
This is in contrast to a study carried out in Delhi where it was observed that second trimester abortions are directly proportional to an increase in parity.13 This difference could have risen due to the small sample size (n=84) investigated by the researchers compared to ours (n=202). The number of second trimester abortions seen by the researchers was 2% of the total while our findings showed second trimester abortions constituting 25% of the total. These could be possible reasons why there was a discrepancy between the two studies.
A study titled “timing of steps and reasons for delays in obtaining abortions in the United States” demonstrated an inverse relationship between number of previous pregnancies and time taken to recognize the signs of a pregnancy. Women with no previous children took more time to recognize a pregnancy as compared to their counterparts with one or more children and hence were more likely to come in at a later time.14
Similarly, we found that with an increase in the number of previous pregnancies, the number of MTP’s in the second trimester saw a decreasing trend. This suggests that most women who came in for an MTP in the second trimester were pregnant for the first time.
A multi-pronged intervention in 253 villages in the Silli and Khunti blocks of Jharkhand (North India) was conducted between 2007 and 2009. It sought to improve medical abortion services and create awareness at the community level by providing information through community intermediaries and creating an enabling environment.
at all intervention sites over the duration of the intervention. There was a shift towards women seeking care earlier in pregnancy.15
The demonstrated success of this intervention shows that with the necessary modifications there is a potential for replication on a larger scale. Although our study is restricted to one public hospital, it can serve as a starting point for larger prospective studies to identify target groups which should be the focus of intended counseling. Knowledge of the characteristics of women who avail late abortion can help to design counseling programs tailor made to suit their needs.
Limitations
Since this study is a record based retrospective study, it is heavily reliant on accurate recording of information at the first point of contact with the abortion services. No follow up could be done if there were mistakes in the hospital record entries or if the data was insufficient the population sample was not necessarily representative of the situation at the community level. The information in this study, does not include the abortions undertaken in private clinics and hospitals in the catchment area of the hospital which conducted this study. There might be confounding variables such as income levels and ease of access to health care services which lead to a delay in seeking services, which our study has not addressed.
CONCLUSION
Experience in terms of parity was much more relevantin seeking appropriate services in a timely manner. There may be cases in which the first time a woman comes across a gynecologist is when she is showing signs of pregnancy, hence vital information such as management of a pregnancy, use of contraceptives or planning pregnancies may not have been possessed by these women until they are counselled about the same. Therefore, women who had not been pregnant before, may have suffered from a paucity of sexual and reproductive health information and were more likely to be late in accessing the termination of pregnancy services. Hence, women with previous pregnancies who may have been counselled, have the added benefit of utilizing this information to prevent and plan pregnancies accordingly. A few other factors that may have led to delays in accessing the abortion services are inability to identify early signs of pregnancy, lack of cheap and accessible pregnancy tests, poor knowledge about the legality of MTP and uncertainty about where to avail these services. Therefore, there is a need for all women of reproductive age, irrespective of their marital status, religious affiliations and economic status to be educated about matters pertaining to their sexual and reproductive health. This can aid them in making a timely and informed decision.
ACKNOWLEDGEMENTS
We gratefully acknowledge the Dean of our Medical College, Dr. Ashok Anand, Professor and Head, Department of Obstetrics and Gynaecology, Dr. Meena Kakeri, Professor and Head, Department of Community Medicine, Mr. Adit, Mr. Mihir, Ms. Sukanya, Mr. Rajiv Kaka, Ms. Suchitra, Ms. Alka for their support.
Funding: No funding sources Conflict of interest: None declared
Ethical approval: The study was approved by the Institutional Ethics Committee
REFERENCES
1. D. O. H. and F. Welfare, Annual Report 2015-16. Ministry of Health and Family Welfare, New Delhi; 2016. Available at: https://mohfw.gov.in/sites/ default/files/56324455632156323214.pdf. Accessed on 4 May 2018.
2. Lohr PA, Fjerstad M, DeSilva U, Lyus R. Abortion. BMJ. 2014; 348:f7553.
3. National family health survey (NFHS-4), 2012-14. Mumbai: International Institute for Population Sciences (IIPS) and Macro International; 2018. 4. Singh S. The incidence of abortion and unintended
pregnancy in India, 2015. Lancet Global Health. 2018;6(1).
5. Jesani A, Iyer A. Women and abortion. Economic and Political Weekly. 1993;28(27):2591-94.
6. The Medical Termination of Pregnancy Act, 1971 (Act No. 34); 1971.
7. Bartlett LA, Berg CJ, Shulman HB, Zane SB, Green CA, Whitehead S, et al. Risk factors for legal induced abortion-related mortality in the United States. Obstetric Gynecol. 2004;103(4):729-37. 8. Dalvie SS. Second trimester abortions in India.
Reproductive Health Matters. 2008;(16):37-45. 9. Duggal R. The Political Economy of Abortion in
India: Cost and Expenditure Patterns. Reproductive Health Matter. 2005;(2):130-7.
10. Holla R, Kanchan T, Unnikrishnan B, Kotian MS, Kumar N, Thapar R, et al. Profile of women seeking medical termination of pregnancy in South India. Int J Gynaecol Obstetric. 2014;125(3):253-5.
11. Shivakumar BC, Vishvanath D, Srivastava PC. A profile of abortion cases in a tertiary care hospital. J Indian Acad Forensic Sci. 2011;33(1):33-8.
12. Maheswari UR, Jayanthi TP. Abortion seeking behaviour: a study from tertiary care hospital. Int J Community Med Public Health. 2017;4:2303-7. 13. Aggarwal P, Zutshi V, Batra S. Do women
presenting for first and second trimester abortion differ socio-demographically?. Ann Med Health Sci Res. 2013;3(2):187-90.
15. Banerjee SK, Andersen KL, Baird TL, Ganatra B, Batra S, Warvadekar J. Evaluation of a multi-pronged intervention to improve access to safe abortion care in two districts in Jharkhand. BMC Health Services Res. 2014;14:227.