Original Research Article
A comparative study of prevalence of overweight and obesity among
urban, and rural population of South India
B. Babu Rao
1, Syam Sundar Junapudi
2*
INTRODUCTION
Obesity is a medical condition in which excess body fat has accumulated to the extent that it may have a negative effect on health.1 People are generally considered obese when their BMI, a measurement obtained by dividing a person's weight by the square of the person's height, is over 30 kg/m, with the range 25-30 kg/m defined as overweight.1,2 Some East Asian countries use lower values.2 Obesity increases the likelihood of various diseases and conditions, particularly cardiovascular
diseases, type 2 diabetes, obstructive sleep apnea, certain types of cancer, osteoarthritis and depression.3,4 Obesity is most commonly caused by a combination of excessive food intake, lack of physical activity, and genetic susceptibility.1,5 A few cases are caused primarily by genes, endocrine disorders, medications, or mental disorder.6 Obesity is mostly preventable through a combination of social changes and personal choices.1 Changes to diet and exercising are the main treatments.2 Diet quality can be improved by reducing the consumption of energy-dense foods, such as those high in ABSTRACT
Background: Obesity is a medical condition in which excess body fat has accumulated to the extent that it may have a negative effect on health.1 People are generally considered obese when their body mass index (BMI), a measurement obtained by dividing a person's weight by the square of the person's height, is over 30 kg/m2, with the range 25–30 kg/m2 defined as overweight.Aims and objectives were to estimate the prevalence of overweight and obesity among the study population and to compare the study results between urban and rural area population.
Methods: A community based cross-sectional study from April 2008 to May 2009 (1 year) conducted at urban health centre, Harazpenta and rural health centre, Patancheruvu. Total of 1409 persons in the age group of above 15 years were involved in this study. Data collection by using pre-designed, pretested questionnaire. Data analysis by using MS office 2016. Epi info2016, rates, ratios, proportions and Chi-square tests were used.
Results: Among urban population prevalence of obesity was 12.7% compared to 5.4% in rural area. The prevalence of pre obesity was more among males (26.2%) in urban area than rural area (16.72%). In the study population 42.9% of the individual who had BMI>25 were from upper middle class in urban area, when compared to 43.3% with BMI>25 belongs to upper class in rural area.
Conclusions: All over weight and obese subjects should be educated to know about the occurrence of various health problems due to overweight.
Keywords: Overweight, Obesity, Rural, Urban
Associate Professor, Department of Community Medicine, 1Osmania Medical College, Hyderabad, 2Government Medical College, Suryapet, Telangana, India
Received: 12 November 2018
Revised: 14 February 2019
Accepted: 15 February 2019
*Correspondence:
Dr. Syam Sundar Junapudi, E-mail: [email protected]
Copyright: © the author(s), publisher and licensee Medip Academy. This is an open-access article distributed under the terms of the Creative Commons Attribution Non-Commercial License, which permits unrestricted non-commercial use, distribution, and reproduction in any medium, provided the original work is properly cited.
fat or sugars, and by increasing the intake of dietary fiber.1 Obesity is a leading preventable cause of death worldwide, with increasing rates in adults and children.7 In 2015, 600 million adults (12%) and 100 million children were obese in 195 countries.8 Obesity is more common in women than men.1 Authorities view it as one of the most serious public health problems of the 21st century. Obesity can lead to social stigmatization and disadvantages in employment.9
Obesity in India has reached epidemic proportions in the 21st century, with morbid obesity affecting 5% of the country's population.10 India is following a trend of other developing countries that are steadily becoming more obese. Unhealthy, processed food has become much more accessible following India's continued integration in global food markets. This, combined with rising middle class incomes, is increasing the average caloric intake per individual among the middle class and above income households.11 Obesity is a major risk factor for cardiovascular disease; NGOs such as the Indian Heart Association have been raising awareness about this issue.12
Aims and objectives were to estimate the prevalence of overweight and obesity among the study population and to compare the study results between urban and rural area population.
METHODS
Study design: A community based cross-sectional study.
Study place: Field practice area of Osmania medical college, urban area of Harazpenta, Hyderabad and rural area of Patancheru, Medak district.
Study period: April 2008 to May 2009 (1 year).
Selection of the study population: Adults above 15 years of age in Harazpenta and Patancheruvu.
Selection procedure: Random sampling.
Statistical analysis: By using MS office 2016,
epiinfo2016.
Statistical test: Rates, ratios, proportions and chi-square tests.
Data collection: By using pre-designed, pretested
questionnaire after taking ethical committee approval.
Calculation of sample size
According to Chow, Cardon et al prevalence of hypertension was 20.3%, diabetes was identified in 3.7%, prevalence of overweight was 16.9%, and obesity was 4.4% in rural Andhra Pradesh.13 Using this prevalence of overweight 16.9 in Andhra Pradesh was calculated the sample size with the following formula: 4 PQ/L2 (L=20%, P=16.9% and Q=100-P, Where L=allowable error, P=prevalence, calculated sample size=4×16.9×83.1/3.38 ×3.38=658.
Required sample size is 658 the total study subjects in the urban area was 708 and in the rural area 701.
RESULTS
This Table 1 shows that male population was 20.32% high in urban than female population where as in rural area the female population was 11.28% more.
Table 1: Sex and age wise distribution of study group in urban and rural areas.
Age group (years) Urban Rural
Male N (%) Female N (%) Total N (%) Male N (%) Female N (%) Total N (%)
15-25 98 (23.0) 78 (27.7) 176 (24.9) 111 (35.7) 113 (29.0) 224 (32.0)
26-35 168 (39.4) 70 (24.8) 238 (33.6) 63 (20.3) 94 (24.1) 157 (22.4)
36-45 66 (15.5) 42 (14.9) 108 (15.3) 56 (18.0) 65 (16.7) 121 (17.3)
46-55 48 (11.3) 48 (17.0) 96 (13.6) 44 (14.1) 47 (12.1) 91 (13.0)
56-65 34 (8.0) 36 (12.8) 70 (9.9) 25 (8.0) 55 (14.1) 80 (11.4)
Above 66 12 (2.8) 8 (2.8) 20 (2.8) 12 (3.9) 16 (4.1) 28 (4.0)
Total 426 (60.16) 282 (39.84) 708 (100) 311 (44.36) 390 (55.64) 701 (100)
In the study population in the urban area there was a higher proportion of males (60.16%) compared to females (39.84%). Where as in the rural study population there was higher proportion of females (55.64%) compared to males (44.36%).
Among urban population prevalence of obesity was 12.7% compared to 5.4% in rural population, this
difference was found to be statistically significant (X2=22.67, p<0.00001, CI=95%).
Over weight was 22% in urban population, 19.8% in rural population, but this difference was statistically not significant (X2=1.03, p<0.30, CI=95%).
found to be statistically significant (X2=15.12, p<0.0001, CI=95%).
Overall prevalence of overweight and obesity (BMI>25) in the study group was 30%.
Table 2: Sex wise distribution of overweight/obesity among urban and rural areas.
Sex Urban (n=708) Rural (n=701)
Normal weight BMI 18.55-24.99
Overweight and
obesity BMI >25 Total
Normal weight BMI 18.55-24.99
Overweight and
obesity BMI >25 Total
Male 236 (55.4) 158 (37.1) 426 (100) 214 (69.4) 67 (21.5) 311 (100)
Female 146 (51.7) 88 (31.3) 282 (100) 238 (61.0) 110 (28.2) 390 (100)
Total 382 (53.9) 246 (34.7) 708 (100) 452 (64.4) 177 (25.1) 701 (100)
*Underweight was not included in this Table.
Table 3: Socio economic status wise distribution of overweight/obesity among urban and rural areas.
Socio economic status
Urban (n=708) Rural (n=701)
Normal weight BMI 18.55-24.99
Overweight and
obesity BMI >25 Total
Normal weight BMI 18.55-24.99
Overweight and
obesity BMI >25 Total
Upper class 120 (49.5) 100 (41.3) 242 (100) 34 (56.6) 26 (43.3) 60 (100)
Upper
middle class 88 (54.3) 66 (40.7) 162 (100) 135 (71.8) 47 (26.1) 188 (100) Middle class 84 (54.5) 46 (29.8) 154 (100) 192 (67.1) 50 (17.5) 286 (100)
Upper lower
class 76 (59.3) 24 (18.7) 128 (100) 87 (54.3) 51 (31.8) 160 (100)
Lowerclass 14 (63.6) 8 (36.3) 22 (100) 4 (57.2) 3 (42.8) 7 (100)
Total 382 (53.9) 246 (34.7) 708 (100) 453 (63.3) 177 (25.1) 701 (100)
*Under weight was not included in this Table.
The prevalence of over weight and obesity (BMI>25) among urban males was 37.1% and urban females was 31.3%, but difference was statistically not significant (X2=2.08, p>0.05, CI=95%).
Figure 1: Prevalence of overweight and obesity in study population.
The prevalence of overweight and obesity (BMI>25) among rural males was 21.5% and rural females was 28.2%, this difference was found to be statistically significant (X2=4.07, p<0.04, CI=95%).
In urban area 37.1% of males were overweight and obese, where as in rural males were 21.5% this observed difference was found to be statistically significant (X2=20.48, p<0.0001, CI=95%).
In urban area 31.3% of females were overweight and obese, where as in rural females were 28.2%, but the observed difference was statistically not significant (X2=0.71, p>0.05, CI=95%).
The highest prevalence of overweight and obesity was seen in the upper class both in the urban area (41.3%) and in the rural area (43.3%).the observed difference was found to statistically not significant (X2=0.08, p>0.05, CI=95%).
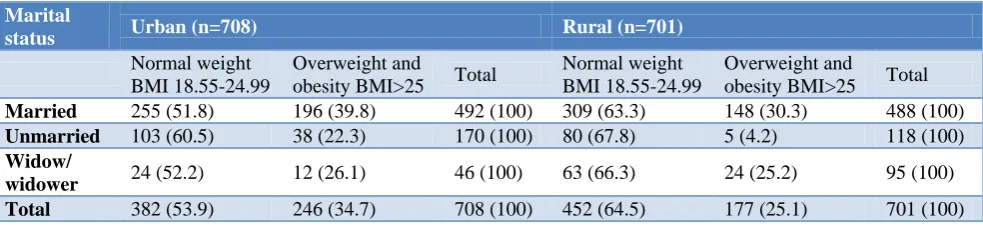
The prevalence of obesity/overweight was high among married population both urban and rural areas (39.8% and 30.3% respectively, cut off level of BMI is >25. The observed difference was found to be statistically significant (X2=10.30, p<0.001, CI=95%).
80(11.3%)
382(54%)
156(22.0%)
90(12.7%) 72(10.2%)
452(64.6%)
139(19.8%)
38(5.4%)
Table 4: Distribution of overweight/obesity according to marital status.
Marital
status Urban (n=708) Rural (n=701)
Normal weight BMI 18.55-24.99
Overweight and
obesity BMI>25 Total
Normal weight BMI 18.55-24.99
Overweight and
obesity BMI>25 Total
Married 255 (51.8) 196 (39.8) 492 (100) 309 (63.3) 148 (30.3) 488 (100)
Unmarried 103 (60.5) 38 (22.3) 170 (100) 80 (67.8) 5 (4.2) 118 (100)
Widow/
widower 24 (52.2) 12 (26.1) 46 (100) 63 (66.3) 24 (25.2) 95 (100)
Total 382 (53.9) 246 (34.7) 708 (100) 452 (64.5) 177 (25.1) 701 (100) *Underweight was not included in this table.
DISCUSSION
Our study results (Figure 2) was comparable to studies conducted by a study by Sood et alinan epidemiological study of obesity in Simla town. Prevalence of obesity was 34.7% among urban area using cut off level BMI>25.14 A study done by Reddy et al among a cross-sectional population of Andhra Pradesh have noted that prevalence of obesity was 36%.15
In a report called priority non-communicable disease-health situation in the South East Asia region-1998-2000-WHO: 135‖ it was seen that the prevalence of obesity (BMI>25) in urban areas of India is ranged between 20-40%.
The study results (Table 2) correlates with the following studies conducted by Sonmez et al In their study has noted that 15% of males are obese and 32% females are obese.16 A study conducted by Sidhu et al have noted that overall prevalence rate of overweight/obesity in their study was 43.88% and 22.26%, respectively, for urban and rural females.17 A study conducted by Singh et al ―in their study the overall prevalence of obesity was 6.8% and overweight 35% among women and 32.0% among men.18 A similar finding was noticed by Chow et al in their study have noted that the prevalence of overweight was 16.9%, obesity was 4.4% in rural India. In the present study the prevalence of overweight was19.8%, obesity was 5.4% in rural area.13
A study conducted by Rezende et al in their study has noted that the prevalence of overweight and obesity in their study population was high mainly among females. In our study prevalence of overweight and obesity was more in males.19
CONCLUSION
Among urban population prevalence of obesity was 12.7% compared to 5.4% in rural area. The prevalence of pre obesity was more among males (26.2%) in urban area than rural area (16.72%).In the study population 42.9% of the individual who had BMI>25 were from upper
Recommendations
All over weight and obese subjects should be educated to know about the occurrence of various health problems due to overweight.
To bring awareness among the family members of overweight/obesity subjects by way of providing health education to them.
Funding: No funding sources Conflict of interest: None declared
Ethical approval: The study was approved by the Institutional Ethics Committee
REFERENCES
1. Obesity and overweight Fact sheet. WHO, 2015. Available at: https://www.who.int/news-room/fact-sheets/detail/obesity-and-overweight. Accessed on 12 October 2019.
2. Kanazawa M, Yoshiike N, Osaka T, Numba Y, Zimmet P, Inoue S. Criteria and classification of obesity in Japan and Asia‐Oceania. Asia Pacific j clin nutrition. 2002;11:732-7.
3. Haslam DW, James WP. Obesity. Lancet.
2005;366(9492):1197–209.
4. Luppino FS, de Wit LM, Bouvy PF, Stijnen T, Cuijpers P, Penninx BW, et al. Overweight, obesity, and depression: a systematic review and meta-analysis of longitudinal studies. Arch General Psychiatr. 2010;67(3):220-9.
5. Yazdi FT, Clee SM, Meyre D. Obesity genetics in mouse and human: back and forth, and back again. Peer J. 2015;3:856.
6. Bleich SN, Cutler D, Murray C, Adams A. Why is the developed world obese? Annu Rev Public Health. 2008;29:273-95.
7. Howard Friedman. Encyclopedia of Mental Health. 2nd ed. Academic Press. 2015: 158.
8. Afshin A, Forouzanfar MH, Reitsma MB, Sur P, Estep K, Lee A, et al. Health Effects of Overweight and Obesity in 195 Countries over 25 Years. N Engl J Med. 2017;377:13-27.
10. India facing obesity epidemic: experts, 2007. Available at: http://hindu.com./2007/10/12/stories /2007101260940600.html. Accessed on 12 October 2019.
11. Gulati S, Misra A. Abdominal obesity and type 2 diabetes in Asian Indians: dietary strategies including edible oils, cooking practices and sugar intake. Eu J Clin Nutr. 2017;71(7):850.
12. Indian Heart Association Webpage, 2015. Available at: <http://indianheartassociation.org/>. Accessed on 12 October 2019.
13. Chow C, Cardona M, Raju PK, Iyengar S, Sukumar A, Raju R et al. Cardiovascular disease and risk factors among 345 adults in rural India—the Andhra Pradesh Rural Health Initiative. Int J Cardiol. 2007;116(2):180-5.
14. Sood K, Gupta K, Ahluwalia K, Dhadwal D, Sharma K, Sood K. An Epidemiological Study of Obesity In Smimla Town. Indian J Med Sci. 1996;50(10):362-4.
15. Reddy NK. A study on Prevalence of risk factors for CAS in a cross-sectional population of AP, India. JIHJ. 2002;54:697-701.
16. Sonmez K, Akcakoyun M, Akcay A, Demir D, DuranNE, Gencbay M, et al. Which method should be used to determine the obesity, in patients with
coronary artery disease? (body mass index, waist circumference, waist-hip ratio). Int J obes Relat Metab Disord. 2003;7(3):341-6.
17. Sidhu S, Kaur A, Prabhjot Anthropol Anz. Prevalence of overweight and obesity among urban and rural adult females of Punjab. Anthropol Anz. 2005;63(3):341-5.
18. Singh RB, Pella D, Mechirova V, Kartikey K, Demeester F, Tomar RS, et al. Prevalence of obesity, physical inactivity and undernutrition, a triple burden of diseases during transition in a developing economy. The Five City Study Group. Acta Cardiologica. 2007;62(2):119-27.
19. Rezende FA, Rosado LE, Ribeiro RD, Vidigal FD, Vasques AC, Bonard IS, et al. Body mass index and waist circumference: association with cardio-vascular risk factors. Arquivos Brasileiros De Cardiologia. 2006;87(6):728-34.
Cite this article as: Rao BB, Junapudi SS.A comparative study of prevalence of overweight and obesity among urban, and rural population of South India. Int J Community Med Public Health