Publication Date: Apr. 25, 2019 DOI: 10.14738/abr.74.6454.
Tseng, C. C. (2019). Fuzzy Cognitive Map of Vulnerability by Interactive Qualitative Analysis. Archives of Business Research, 7(4), 146-156.
Fuzzy Cognitive Map of Vulnerability by Interactive Qualitative
Analysis
Ching-Chuan Tseng
Department of International Finance,
Shanghai University of Finance and Economics, China
ABSTRACT
Along with the internationalization and globalization, the rapid change of the era, and the increase in the diversification of customer demands, business management is facing intensive turbulence. Currently, the financial industry in Taiwan is at the era of radical changes in the external environment and fast revolution in information technology. It forces the operators in the financial industry to equip themselves with certain knowledge and responding capability for the business risk at the external environment in order to be ready to provide a situation-conforming and concrete revolutionary proposal for the financial crisis encountered. The article uses business risk in the financial institutions as the research topic and constructs fuzzy cognitive maps based on the perspective of vulnerability and resilience. The research outcome reveals the factors that affecting vulnerability including risk appetite, compliance, operational management, organizational culture, and internal audit as well as the frequency of communication & negotiation and external linkage.
KEYWORDS: Interactive Qualitative Analysis, Fuzzy Cognitive Map, Vulnerability
INTRODUCTION
Financial crisis is the least disaster that the financial institutions would like to encounter. The most famous financial crisis in the past few years is the Financial Crisis of 2007-2008, which is also called global financial crisis in 2008, subprime mortgage crisis, credit crisis, and economic crisis. The incident was related to a crisis of liquidity caused by investors’ disbelief for the value of collateral securities after the outbreak of subprime mortgage crisis on August 9th, 2007 and it started to lose control in September, 2008. Many large-scale financial institutions were washed up or taken over by government; it caused business recession and global financial crisis in the end.
RESEARCH METHODS
The data collection and analytical methods of interactive qualitative analysis (IQA) originated from total quality management (TQM). Total quality management solves problems and improves industrial processes through the knowledge owned by members in the organization. Its main assumption is the person who is closest to the work understands the problems and solutions the best (Northcutt & McCoy, 2004). Interactive qualitative analysis follows the same concept and focuses on the experiences and opinions from the target groups. Interactive qualitative analysis can be used to find out the cause-effect relation among factors and determine whether the relation exists or not. The analytical procedures are established through referencing Feng’s research (2010), which includes:
Relation frequency calculation
First, find out potential error factors that weaken the system, encode the factor, and design the questionnaire for experts. A relation table is obtained through the response to the questionnaire by experts and the relation frequency of each pair of factors is calculated based on this.
Power analysis
Pareto protocol and power analysis is to be carried out. Pareto theory is also called 80/20 Rule; its concept is that most variables in the system are from minor relation in the system and the key points of the problems will be effectively controlled by monitoring the minor relation. The two purposes of using Pareto protocol are: (1) to determine the optimal relation volume and (2) to assist eliminating fuzzy relation (Feng, 2010). The relation frequency of each pair of factors is sorted out from the highest to the lowest and the power value is calculated. The value is the difference between the percentage of cumulative frequency and the percentage of cumulative relation. Among them, the percentage of cumulative frequency is the cumulative frequency of the relation accounts for the percentage of total frequency. Due to frequency is sorted out from the highest to the lowest, it increases rapidly in the beginning and then the rate of increase slows down gradually. The relation with the same frequency is also with the increase rate of cumulative frequency percentage. The percentage of cumulative relation is the percentage of sorted cumulative relation (that is relation sequencing) accounts for the total potential relation volume, and a stable rate of increase exists between each relation. The crucial point that determines whether the relation is preserved or not is when the increase rate of cumulative frequency is less than the increase rate of cumulative relation; it represents the crossing area of different frequency. Therefore, it will not be affected by the sequence of relation among the same frequency. When the experts have more consistent opinions, the greater percentage of relation will be preserved; on the contrary, more fuzzy relation will be deleted when the experts hold different opinions. Through power analysis, the principle of the least relation representing the maximum variance in Pareto theory is used to determine the crucial point of whether to preserve the relation or not. The relation with sufficient power is preserved while the relation with insufficient power is deleted in order to confirm whether there is any mutual cause-effect relation between factors as well as the direction of power.
System Influence diagram (SID)
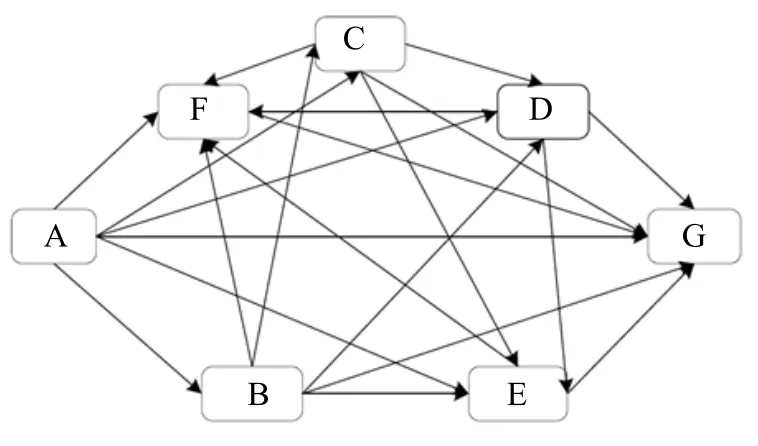
System influence diagram (SID) is produced according to the relation of each factor given by the experts, as shown on Figure 1. If the system influence diagram (SID) produced is too complicated and not good for analysis, it can be simplified to a simple system influence diagram by deleting unnecessary tie lines1, as shown on Figure 2.
1 Figure 1 assumes there are 7 variables of A-G in the system and there might be positive correlation or negative
A
B
C
D
E
F
G
Figure 1 System Influence Diagram
A
B
C
D
E
F
G
Figure 2 Simplified System Influence Diagram
Use Figure 1 and Figure 2 as examples, Figure 1 represents a system consisting seven variables from A~G and the relation between two factors is demonstrated by the arrow. For example, variable A affects variable B, which can be represented with the following diagram:
Interactive qualitative analysis is to try finding out main relation variables among the variables in Figure 1 and to describe the system features in Figure 1 through the main crucial links (as shown on Figure 2). Figure 2 shows the main relation links on Figure 1 after interactive qualitative analysis; that is, using less relation to explain the main feature or behavior in the original system.
The assumption of interactive qualitative analysis is the person who is closest to the work understands the problem the best as well as how to solve it. Therefore, the knowledge owned by the members in the organization can be used to solve the problem through the experiences and opinions from the target group as well as improve the difficulty that the company faces. The purpose of IQA is to confirm whether the relation between each pair of variables is valid through the relation matrix filled out by the experts and further consolidate the relation matrix filled out by the experts to obtain relation frequency matrix. When all of the experts hold more consistent opinions towards how many pairs of variables are with actual meaning among all the relations, most of the relations will be preserved. On the contrary, if all of the experts hold different opinions towards the actual meaning existing in which relation, the outcome will only preserve the relations that are agreed by most of the experts while some debatable relations
will be deleted due to these relations account for lower percentage among the recognition by the experts.
According to the relation frequency matrix, arrange the sequence of relation frequency between each pair of variables from the highest to the lowest and calculate various indicators based on the relation frequency matrix after sequencing, including “relation frequency sequencing”, “cumulative relation frequency”, “percentage of cumulative relation”, “percentage of cumulative frequency”, and “power”; the result of relevant indicator calculation is as shown on Table 1. Power indicators will assist us to determine the quantity of relation that needs to be preserved before we can propose meaningful relation and interpretation to the system. The crucial point of whether to preserve is where the increase rate of cumulative frequency percentage is less than the increase rate of cumulative relation; it is the crossing area for different frequency. As a result, the drop of the power indicator of the relation i means the preservation of relation i will be able to explain the drop of interpretation capability to the meaningful relations. That is, only i-1 relations need to be preserved.
DATA COLLECTION AND ANALYSIS
Table 1 Description of vulnerability for the research object
Variable Description of content
Risk appetite Risk appetite refers to the attitude when a company faces financial risk; the rise of risk appetite means that the financial institution is willing to take higher risk in order to fight for a higher return.
Compliance It refers to the level of compliance and respect towards to relevant financial legal regulations that a financial company holds. If a company can follow the legal regulations well, it is possible that the company can reduce the risk related to law. However, it might also cause the company’s rigidness and inflexibility in terms of decision making.
Operational management
It refers to the professionalism and consistency of employees’ performance during the daily operation in the company. If the performance of operational management is poor, the possibility of operational risk caused by human error is higher.
Organizational
culture Organizational culture is the sum of the highest value standard, basic belief, and code of conduct created and owned by the organization during the long-term survival and development, and it is followed by most of the members in the organization. Good organizational culture contributes to the operational performance and capability of resisting the risk of a company.
Internal audit The sound and perfect internal audit of the financial institution will help the institution achieve better operational management as well as reduce errors and further financial risk caused by human management and operational procedures.
Communication & negotiation frequency
It refers to the frequency of meeting and negotiation for daily operation among members in the financial institution. When encountering problems in operation or emergency condition, the frequency of communication, meeting and negotiation will increase.
External linkage The linkage between financial institutions and external environment includes the linkage between the government and other relevant industries or companies. The higher the external linkage is, the better the possibility of being flexible or controlling the information of tiny changes in the market is. Therefore, it can strengthen the level of resistance when a financial
institution faces the risk.
Vulnerability The vulnerability of the financial institution refers to the pre-existing status that is in the system before the disaster, and it belongs to the structural factor to the impact when a financial system encounters the disaster. System resilience It refers to the time and capability needed for recovering from abnormality
to the normal when the system is impacted by external force. System resilience will be affected by factor X10~X15.
Adaptability to
changes It refers to the emergency responding ability from the members when some link of the system malfunctions. Global economic
prosperity The members comprising the financial ecological chain are almost without borders. Therefore, many financial crises and risks are relevant to global financial ecological chains. The global economic prosperity will directly or indirectly affect the resilience of a financial institution.
Government policy
Government’s handling ability, policy making, and implementation capability after the financial crisis will affect the recovering ability of the financial institution.
conditions institutions after the market environment goes through the financial crisis. If the business conditions become worse due to the impact, it will carry
negative influence to the resilience of the financial institution. Market
confidence
Market confidence refers to the confidence of the whole market towards the whole economic environment after the market encounters financial crisis or the company experiences financial disaster, including prosperity,
government, and industry. Product
performance It refers to the competitiveness and performance on the product and the service in a financial company. If the product is with better performance in the financial company, it will have more chances to recover in a faster speed after the company encounters the impact of the risk.
In the previous section, we explain the study finds out 15 factors that affect the risk and vulnerability in the financial institutions through literature review and expert interview. Next, we are going to further understand the relation among these factors through questionnaires completed by the experts in order to clarify the relation between factors when constructing fuzzy cognitive maps later on. However, each interviewed expert does not necessary hold the same opinions towards the relation among the 15 factors; for example, some experts believe A affects B, but some experts think the level of A affecting B is not high and it should be ignored. Consequently, it is necessary to carry out interactive qualitative analysis on the relation among the 15 factors in a more objective approach in order to confirm the structural relation between each factor that affects the vulnerability of the financial institution.
The assumption of interactive qualitative analysis is the person who is closest to the work understands the problem the best as well as how to solve it. Therefore, the knowledge owned by the members in the organization can be used to solve the problem through the experiences and opinions from the target group as well as improve the industrial process. Interactive qualitative analysis can be used to find out the cause-effect relation among factors and determine whether the relation exists or not. Interactive qualitative analysis is a research design and it investigates the phenomenon in depth through target groups and conversation instruction. IQA is a systematic method related to qualitative research and many researchers examine the cause-effect relation according to its meaning and structure.
The input variables needed for fuzzy cognitive maps include the mutual-affecting weights between variables and the state value of the variable. It relies on the experts who have actual experiences or researches in the field and it focuses more on the quality of the expert but not quantity. The common quantity of experts for fuzzy cognitive maps is around 3 people2 but there are in fact few researches did not list the quantity of experts. In order to confirm the
2 In many literatures that use FCM as the research method, the quantity of expert questionnaire has never been
relation among the 15 factors that affect the risk vulnerability in financial institutions selected by the study, we selected 9 scholars or experts related to financial risk and verified the structural relation among the 15 factors through expert questionnaires and interactive qualitative analysis.
Take the study as an example, the 15 factors will generate 5×15=225 pairs of relation under the condition of pairing of two. Through questionnaire interview with the 9 scholars or experts related to financial institutions, they are asked to check the relation of each pair of variables one by one and confirm whether it is valid. If Xiis irrelevant with Xj, fill in “0” on the blank space
for the relation; if Xi is relevant with Xj, fill in “1” on the blank space for the relation. Adding all
relation matrix from the 9 experts together to obtain relation frequency matrix as shown on Formula (1). The left matrix on Formula (1) represents the evaluation outcome on the relation for each pair among the 15 factors done by Expert 1 while the right matrix on Formula (1) represents the cumulative relation frequency matrix among the 15 factors from the 9 experts. For example, the relation between X1 and X2 is with value 9 and it represents 9 experts believe
variable X1 is related to variable X2 ; if the value is 0, it represents none of the scholars or
experts think the two variables will affect each other (as the example of X1-X10).
The aim of interactive qualitative analysis is to collect data through expert interview or expert questionnaire based on the professional knowledge of the expert’s. With the comparison and contract of the opinions among experts, the linkage and construction relation among variables is found out via calculation as well as the correlation among the main impact is clearly stated. The purpose of IQA is to confirm whether the relation between each pair of variables is valid through the relation matrix filled out by the experts and further consolidate the relation matrix filled out by the experts to obtain relation frequency matrix. According to the calculation of IQA power indicator, when all of the experts hold more consistent opinions towards how many pairs of variables in the 225 pairs of relation are with actual meaning, most of the relations will be preserved during the consolidation of the experts’ opinions. On the contrary, if all of the experts hold different opinions towards the actual meaning existing in which relation, the outcome will only preserve the relations that are agreed by most of the experts while some debatable relations will be deleted due to these relations account for lower percentage among the recognition of the experts.
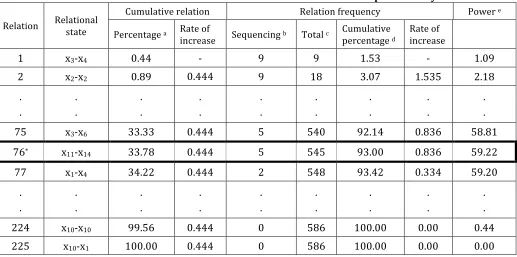
According to the relation frequency matrix on Formula (1), arrange the sequence of relation frequency between each pair of variables from the highest to the lowest and calculate various indicators based on the relation frequency matrix after sequencing, including “relation frequency sequencing”, “cumulative relation frequency”, “percentage of cumulative relation”, “percentage of cumulative frequency”, and “power”; the result of relevant indicator calculation is as shown on Table 3.
Power indicators will assist us determining the quantity of relation that needs to be preserved before we can propose meaningful relation and interpretation to the system. The crucial point of whether to preserve is where the increase rate of cumulative frequency percentage is less than the increase rate of cumulative relation; it is the crossing area for different frequency. As a result, the drop of the power indicator of the relation i means the preservation of relation i will be able to explain the drop of interpretation capability to the meaningful relations. That is, only i-1 relations need to be preserved.
of expressing the maximum variance with the least relation volume. Figure 1 is the diagrams created according to the result after interactive qualitative analysis (IQA), including “percentage of cumulative relation”, “statistical chart of cumulative relation frequency percentage”, and “power”. Figure 3 reveals the value of “power” reaches the peak at the 76th pair before dropping off and it shows that we only need to focus on the relation of the 76 pairs in front.
Table 3 Relational state between the two variables and its power analysis
Relation Relational state
Cumulative relation Relation frequency Power e
Percentage a Rate of
increase Sequencing b Total c
Cumulative percentage d
Rate of increase
1 x3-x4 0.44 - 9 9 1.53 - 1.09
2 x2-x2 0.89 0.444 9 18 3.07 1.535 2.18
. . . . . . . . . . . . . . . . . .
75 x3-x6 33.33 0.444 5 540 92.14 0.836 58.81
76* x11-x14 33.78 0.444 5 545 93.00 0.836 59.22
77 x1-x4 34.22 0.444 2 548 93.42 0.334 59.20
. . . . . . . . . . . . . . . . . .
224 x10-x10 99.56 0.444 0 586 100.00 0.00 0.44
225 x10-x1 100.00 0.444 0 586 100.00 0.00 0.00
a: Cumulative relation percentage is the ratio of the relation i among the whole relation combination of relation frequency matrix after sequencing. The calculation formula of the cumulative relation percentage of the relation i is (i/ total quantity of relation) ×100. Take the first relation (x3-x4) as an
example, the calculation formula for its value is (1/225) ×100=0.44 while the second relation (x2-x2)
is (2/225) ×100=0.89. The increase of the cumulative relation is 0.444 (0.88-0.44) and the increase rate of cumulative relation percentage should be a fixed value. Table 5.2 shows the increase rate of cumulative relation of the study is 0.439 (The value shown in Table 2 is to the 2nd decimal place and there will be slight deviation on the value presentation.)
b: Relation frequency is to sort out the sequence of relation frequency matrix from the highest to the lowest. For example, the first relation (x2-x2) is with value 9 and it represents 9 experts believe the
relation of (x2-x2) is valid.
c: Cumulative relation frequency is to sum the relation frequency matrix after sequencing.
d: The calculation formula of the cumulative relation frequency percentage for the relation i is (the cumulative relation frequency of the relation i ÷ the total cumulative relation frequency)×100. For example, the percentage of the cumulative relation frequency for the 1st relation is (x2-x2) is 1.53
((9/586) ×100) while that of the 2nd relation (x3-x4) is 3.07 ((18/586) ×100) and the increase rate of
its cumulative relation frequency percentage is 1.535 (3.07-1.53). The rate of increase of cumulative relation frequency percentage will not be a fixed value.
e: The calculation formula of power is “percentage of cumulative relation frequency”- “percentage of cumulative relation”. For example, the power value of the 76th relation is 58.83(93.04-94.21) and the
value starts to decrease after the 76th relation combination. In the 79th pair of relation (x4-x6), the
value of power is 58.73; it reveals the power value after the 76th relation starts to drop off.
Figure 1 Statistical chart of cumulative relation frequency percentage
financial institutions can be created based on the data provided on Table 5. It is shown as Figure 2; the arrow indicates the relation between the factor that affects and the factor that is affected.
Next, we are going to explain the relation between the variable and other variables with the example of the variable X7 (external linkage). From Figure 2 and Table 5, we know “external linkage” is affected by “frequency of communication & negotiation”, “organizational culture”, and “compliance”. If the organizational culture in a financial institution is more open, the external linkage of the financial institution will be higher. Therefore, the impact of “organizational culture (X4)” on “external linkage (X7)” is the positive correlation. The same concept can be used to explain the positive impact that “frequency of communication & negotiation” against “external linkage”. As for the impact of “compliance” on “external linkage” is the negative correlation. The main reason is when a company is strictly compliance with legal regulations, it tends to create a closed atmosphere in some aspects and it will cause the negative impact on the “external linkage” of the financial institution more or less.
Communication & negotiation
frequency
Internal audit
Risk appetite
Compliance
Operational management Organizational
culture External linkage
Vulnerability
System resilience
Global economic prosperity
Adaptability to changes
Market confidence
Product performance Business conditions
Government policy
Operational management
Organizational culture External linkage
X7
Vulnerability Compliance
Figure 3 Fuzzy Cognitive Maps for the system resilience of service system in financial institutions
CONCLUSION AND SUGGESTION
References
Chun-yuan Wang, Ming-feng Kuo (2014). Strategic Styles and Organizational Capability in Crisis Response in Local Government. Administration & Society, 49(6), 798-826.
Elpiniki et al., A new hybrid method using evolutionary algorithms to train Fuzzy Cognitive Maps, Applied Soft Computing (2005)
Voula et al., A fuzzy cognitive map approach to differential diagnosis of specific language impairment, Artifical Intelligence in Medicine (2003)
Papageorgiou et al., Active Hebbian learning algorithm to train fuzzy cognitive maps, International Journal of Approximate Reasoning (2004)
Banini et al., Applicationf of Fuzzy Cognitive Maps to Factors Affecting Slurry Rheology, International Journal of Mineral Processing (1998)