http://www.sciencepublishinggroup.com/j/earth doi: 10.11648/j.earth.20180704.11
ISSN: 2328-5974 (Print); ISSN: 2328-5982 (Online)
Foundation Pit Leakage Detection Method Based on
Electrical Resistivity Imaging Technology
Cai Kejian
1, Yin Yabin
2, Liaozhi
3, Ding Yueshuang
4, Wu Yuhao
21
Faculty of Geophysics and Information Technology, China University of Geosciences, Beijing, China 2Faculty of Earth Sciences, Jilin University, Changchun, China
3
Faculty of Architectural Engineering, Tianjin University, Tianjin China 4
Faculty of Environmental and Civil Engineering, Chengdu University of Technology, Chengdu, China
Email address:
To cite this article:
Cai Kejian, Yin Yabin, Liaozhi, Ding Yueshuang, Wu Yuhao. Foundation Pit Leakage Detection Method Based on Electrical Resistivity Imaging Technology. Earth Sciences. Vol. 7, No. 4, 2018, pp. 144-150. doi: 10.11648/j.earth.20180704.11
Received: May 21, 2018; Accepted: June 7, 2018; Published: June 29, 2018
Abstract:
With the continuous development of city construction and development of underground engineering, increasingly large scale, all kinds of super large and deep foundation pit appear constantly, especially in soft soil and high groundwater level area. Due to the leakage problem of the foundation pit engineering, accidents happen. Pit leakage is a common construction defect of construction waterproof curtain, therefore, it is necessary to detect the leakage situation of the foundation pit supporting system in advance, so that the leakage area is treated and prevented in time. In the foundation pit engineering, it is often used to observe the water level changes inside and outside the foundation pit to deduce the approximate area of the foundation pit leakage. Therefore, the use of geophysical methods for leakage detection research has become a breakthrough in solving the problem of leakage of foundation pit. In this paper, variation of groundwater flow around the foundation pit line is discussed when there is leakage of foundation pit system, for instance, leaking water aggregation, intensive regional seepage resistance, resulting in low resistivity of leakage area around the foundation pit of low resistivity. Based on the resistivity imaging technique, the method for detecting the leakage of the foundation pit by detecting the change of resistivity of soil around foundation pit before and after dewatering is presented. It is through two engineering examples show that this method can detect the pit leakage detection results of three-dimensional position, detection results objectively and accurately.Keywords: Foundation Pit Leakage, Electrical Resistivity Imaging, Groundwater, Streamline
1. Introduction
With the development of urban construction and the continuous improvement of construction technology, various types of construction and municipal engineering in China have been developing rapidly in recent years, especially the emergence of urban underground works, high-rise buildings and super high-rise buildings represented by underground railways and large transport hubs. The excavation depth of the deep foundation pit is also getting larger and larger, accompanied by a large number of deep foundation pit projects, especially in soft soil and areas with high underground water level. Because of the leakage problem of foundation pit engineering, accidents often happen.
The retaining wall, support, impervious curtain and other
structural systems used in foundation pit engineering are called supporting structures [1]. Foundation pit enclosure system is widely used in underground structure construction of high-rise buildings. The form of enclosure system is varied, and the purpose is to form a closed structure to facilitate the construction of underground works. The main function is to achieve the purpose of retaining and supporting. Most of the foundation pit accidents (domestic and foreign) are related to the leakage of foundation pit retaining system. Due to the leakage of foundation pit, the foundation pit is unstable and the road surface collapses, resulting in huge loss of life and property.
detected in advance. If there is leakage area, it is particularly necessary to deal with and prevent it before excavation. At present, the foundation pit leakage detection problem in China is usually deduced from the observation of water level inside
and outside the foundation pit. Rare geophysical methods for leakage detection and no reliable detection system have been applied to the leakage detection of foundation pit.
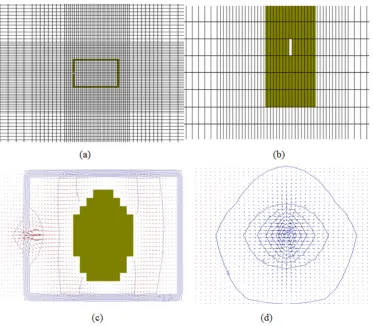
Figure 1. Streamline characteristics of groundwater seepage when retaining system of foundation pit is leaking.
(a) The plan of groundwater initial state; (b) The initial state of groundwater; (c) The plan of groundwater streamline in the dewatering; (d) View of groundwater flow in the dewatering.
The leakage of foundation pit enclosure system will lead to leakage of groundwater around the enclosure system, and the physical properties of the soil will change accordingly. Using suitable geophysical methods to detect changes in physical properties of soil before and after leakage, the purpose of leakage detection can be achieved. [2]
2. Characteristics of Leakage
Underground Flow Line in Foundation
Pit Leakage
Interstitial flow of foundation soil around foundation pit occurs when leakage of foundation pit enclosure system occurs. Simulation of streamline characteristics of groundwater leakage in foundation pit enclosure system by Modflow [3], [4], Retaining leak in foundation pit (Figure 1 (a)).
In the leakage process of foundation pit retaining system, the groundwater flow line around the leakage point is not directional from the initial state (Figure 1 (a), 1 (b)), When the
test becomes dewatering, the streamline falls to the leak point, and the streamline is concentrated (Figure 1 (c), 1 (d)).
3. Solid Model of Leakage in Foundation
Pit Enclosure System
Water and electricity are two different substances. Their flow can be described by the same mathematical model. An electric field is used to simulate the percolation law of formation water, the mechanism of which is the similarity between the differential equation of the flow of water through the porous medium and the differential equation of the charge flow through the conductor material [5].
The flow of water in porous media follows Darcy's law [6]:
V (1)
In the formula: v current velocity, m/s; q flow rate cm3/s; A
leakage section area, cm2; k penetrance, µm2; µ fluid viscosity,
Ohm's law is observed by the current of the conductor:
δ (2)
In the formula: conductivity, the reciprocal of resistivity, /cm; U—voltage, v; electric current density,
A/cm2; I electric current, A; S conductor cross-section, cm2. Steady seepage continuity equation for homogeneous formation water through porous media:
div 0 (3)
Voltage distribution equation in a uniform conductor:
div 0 (4) Comparing formula (1), (2), (3), (4), it can be seen: The
electric field and seepage field can be described by the same differential equation. So the steady seepage problem of incompressible fluid can be simulated by steady electric field. The distribution of pressure in seepage field can be described by potential distribution, current or velocity is described by electric current, and resistance is described by resistance. The dense area of flow line in seepage location has small seepage resistance and low resistivity.
The distribution of electric potential in electric field is the same as that in seepage field; the distribution of the current line is the same as the distribution of the percolation line.
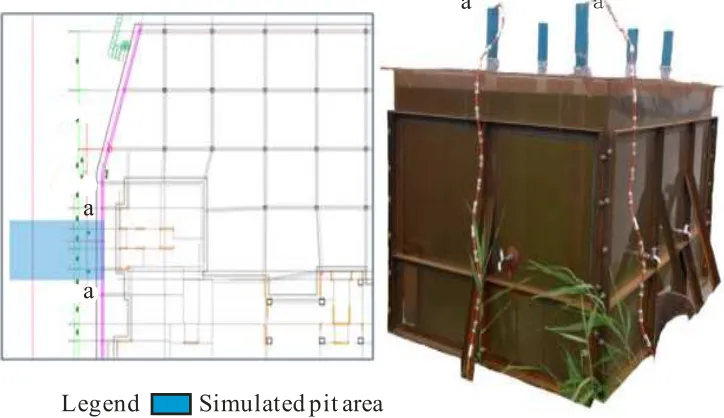
In order to carry out experiments in the laboratory, a PVC structure model was developed. (Long 2.0m; wide 2.0m; high 1.5m, wall thickness 2cm), Simulation of soil and water space around the foundation pit enclosure system (Figure 2).
Figure 2. PVC model diagram.
(a) Closed; (b) Water leakage.
Figure 3. PVC model resistivity map.
PVC model a-a profile, PVC model a-a section uses resistivity imaging method to conduct leakage detection test. Figure 3 is a resistivity map of the a-a section when it is closed and leaking. Comparing Figure 3 (a) and Figure 3 (b), the a-a test profile corresponds to an obvious low resistivity area at the outlet of the PVC tap.
The model test shows that the seepage flow is dense and the resistivity is low. It is proved that the leakage location and the resistivity of the affected area have changed during the leakage of foundation pit enclosure system.
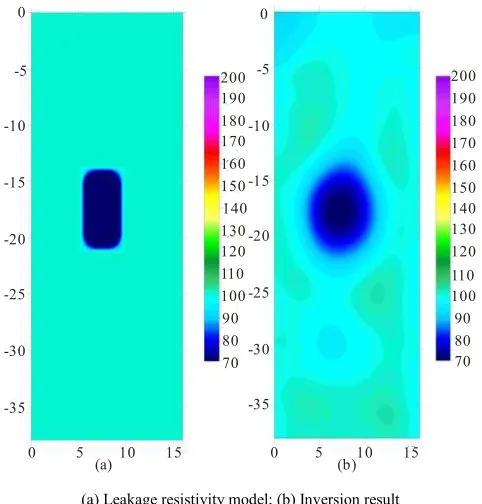
According to the leakage characteristics of foundation pit enclosure system, the resistivity calculation model is shown in Figure 4. The inversion of the calculation model by resistivity imaging method is very clear. Resistivity imaging is used to detect the soil around the foundation pit retaining system before and after the test.
a
a
Legend Simulated pit area
a
a
Fig . 3 PV C mo d el res is t iv ity m ap
( a ) ( b )
-1. 2 -1 -0. 8 -0. 6 -0. 4 -0. 2 0
-1.2 -1 -0.8 -0.6 -0.2 0
-0.4
0 0.2 0.4 0.6 0 0.2 0.4 0.6
58 62 98
94
90
86
82
78
74
70
66
(a) Leakage resistivity model; (b) Inversion result
Figure 4. Leakage resistivity model and inversion result.
By comparing and analyzing the apparent resistivity map, the leakage location of foundation pit retaining system can be detected.
Figure 5. Measuring hole layout and working principle of resistivity imaging method.
4. The Principle of Resistivity Imaging
Technology
For the leakage detection of foundation pit retaining system, electrical holes are spaced at a distance from the outside of the foundation pit enclosure system (Figure 5). A number of electrodes are placed in the electrical method
hole to observe the current and voltage data between the two holes. Resistivity imaging of soil between two holes is obtained by inversion. The resistivity changes of the surrounding soil around the foundation pit before and after the test are compared and analyzed, so as to achieve the purpose of foundation pit leakage detection. [7], [8], [9], [10]
The array of electrodes is divided into even and odd array groups in data acquisition. [11] Combination of odd and even pairs of power supply electrodes, arbitrary combination of measuring electrodes. The AB electric field data is recorded and measure the voltage and current value of the residual electrode N and M should be measured. Each arrangement has 64 electrodes, odd arrays, 32 electrodes and even groups of 32 electrodes. To match each other (the whole arrangement) as a power supply electrode, that is to say, a row arrangement has 32 x 32 = 1024 times power failure process. Each power supply can collect 61 potential difference data at the same time, so the total data volume should be 32 x 32 x 61 = 62464. A large number of data are retrieved to obtain resistivity profiles and reflect the resistivity distribution between two holes. Small changes in soil resistivity around foundation pit retaining system can be detected. [12]
5. Application Examples
5.1. Deep Foundation Pit Engineering of Haihe East Road
5.1.1. Project Profile
The foundation pit adopts the underground continuous wall water stop structure, with 800 mm thick diaphragm wall, 4m long plain concrete section, the wall top elevation -2.3 m, the wall bottom elevation -33.2 m, C40 concrete design grade. The groundwater condition of this project is complex, and the soil layer changes greatly, and there are two micro confined water affecting the foundation pit.
5.1.2. Analysis of Detection Results
Figure 6. Electrical measurement of hole plane position in the Haihe Road Project.
Fig. 4 Leakage resistivity model and inversion result
(a) (b) -35 -30 -25 -20 -15 -10 -5 0
0 5 10 15 0 5 10 15
-35 -30 -25 -20 -15 -10 -5 0 70 80 90 100 110 120 130 140 150 160 170 180 190 200 70 80 90 100 110 120 130 140 150 160 170 180 190 200
h o l e 1 h
o l e 2
(a) Before dewatering; (b) Dewatering
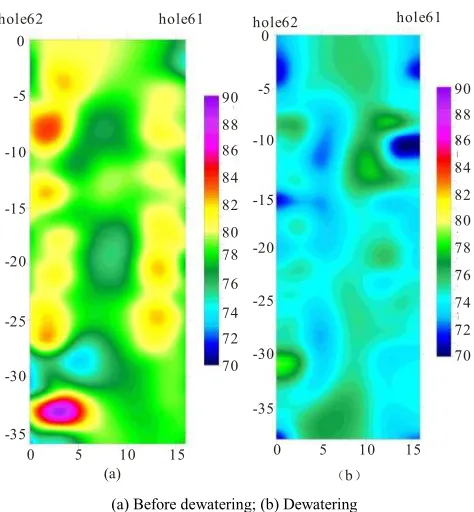
Figure 7. Resistivity map of profile62-61.
As shown in Figure 6, 62 and 61 electrical holes in the foundation pit are used for resistivity imaging detection. The horizontal section is horizontal, the ordinate is depth, the horizontal spacing is 16 m, and the hole depth is 35 m. A set of blue - Green - Green - yellow - red - pink color marks is used to indicate the difference in apparent resistivity from low resistance to high resistance. The resistivity of the region with leakage is low and shows blue. The detection results of two times before and after the trial dewatering of foundation pit are shown in Figure 7.
Figure 7 (a) when the project has not started dewatering; the resistivity of the 62-61 section has not reflected the obvious
leakage position. After the foundation pit starts dewatering, Figure 7 (b), the resistivity of the 62-61 section transverse 14m depth 11m area is obviously low, showing the leakage characteristics. When the foundation pit is excavated, there is a visible leakage current in the location, and timely diversion and plugging measures are taken during construction.
5.2. Foundation Pit Engineering of Dongxing Road Subway Station
5.2.1. Project Profile
The retaining structure of the main foundation pit of the station is composed of reinforced concrete continuous wall and steel support. The thickness of the diaphragm wall is 800 mm, and the joint of a concave and convex joint is adopted at the joint of the diaphragm wall. The length of the diaphragm wall is 35.1m (bottom of the crown beam to the bottom of the diaphragm wall), the pit depth of the station is about 17.39m, and the covering soil is about 3.15m. There are two water bearing groups that have great influence on this project, namely, diving (15m shallow depth) and confined water (20m 35m depth).
5.2.2. Analysis of Detection Results
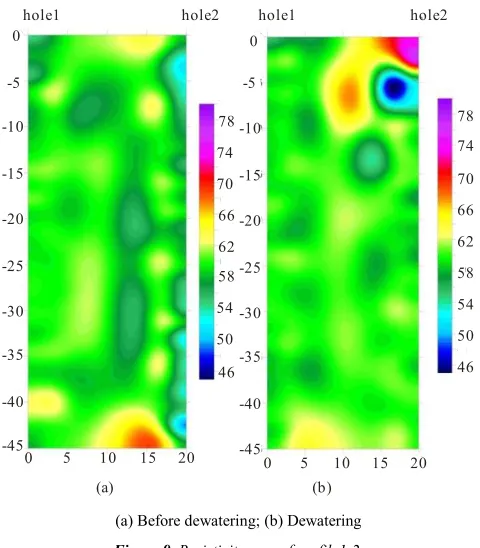
As shown in Figure 8, resistivity imaging is used to detect electrical holes 1 and 2 at the edge of the foundation pit. The horizontal section is horizontal, the ordinate is depth, the horizontal spacing is 20m, and the hole depth is 45m. Using a set of blue-cyan - Green - yellow - red - pink color labels to show the difference of apparent resistivity from low resistivity to high resistivity. Where water leakage occurs, the resistivity is low, showing a blue color. The detection results of two times before and after the trial dewatering of foundation pit are shown in Figure 9.
Figure 8. Electrical measurement of hole plane position in the Dongxing road Project.
hole62 hole61 hole62 hole61
(a) (b)
0 5 10 15
-35 -30 -25 -20 -15 -10 -5 0
-35 -30 -25 -20 -15 -10 -5 0
70 72 74 76 78 80 82 84 86 88 90
0 5 10 15
70 72 74 76 78 80 82 84 86 88 90
2 1
Position and number of electric hole 24
23
(a) Before dewatering; (b) Dewatering
Figure 9. Resistivity map of profile1-2.
Figure 9 (a) when the project has not started dewatering; the resistivity of the 1-2 section has not reflected the obvious leakage position. After the foundation pit begins dewatering, as shown in Figure 9 (b), the 1-2 section is 16 meters across, the resistivity in the depth 6m area is obviously low, and display leakage characteristics. When the foundation pit is excavated, there is a visible leakage current in the location, and timely diversion and plugging are carried out during construction.
6. Conclusions
The method of detecting the seepage of foundation pit is the characteristic of the change of the flow line of groundwater around the foundation pit and the change of the soil resistivity around the foundation pit. Based on the principle of hydropower analogy and engineering application, an effective method for detecting the leakage of foundation pit by electrical resistivity imaging is introduced.
The analysis principles of foundation pit leakage detection are:
1) According to the variation rule of low resistivity before and after dewatering, it is judged whether there is leakage and leakage position of foundation pit enclosure structure.
2) The inversion results of resistivity imaging before and after the foundation pit dewatering are compared and analyzed. After a continuous occurrence of low resistivity anomalies and constant or low resistivity values in the same location, it is speculated that the anomaly is caused by leakage of foundation pit enclosure structure.
Compared with the traditional water level observation method, the method has the following characteristics:
(1) The method is simple on site and has no influence on the construction and surrounding environment. It can not only detect the leakage before the excavation of the foundation pit, but also monitor the excavation and the later operation of the foundation pit;
(2) The results of this method can provide three-dimensional positioning for leakage of foundation pit enclosure system, and can effectively guide the leakage prevention and reinforcement of foundation pit;
(3) This method has a large amount of data acquisition, and the inversion calculation is not an intervention. The inversion results truly reflect the objective changes of the soil resistivity around the foundation pit, and the detection results reflect the real time state of the foundation pit;
(4) The method can also be used for safety monitoring of underground soil in important roads, subway operation areas and important pipelines. [13]
The article mainly introduces the method and application of resistivity imaging technology for foundation pit leakage detection. The further application of the method and the analysis and interpretation of the detection results, and the characteristic resistivity image of leakage, should be perfected and summarized in a large number of engineering applications.
References
[1] GAO D Z. Deep Foundation Pit Engineering [M]. China MachineIndustry Press. 2002. 5 (In Chinese).
[2] LI X J, HUANG Y J, et al. Standard for Urban Engineering Geophysical Exploration [M]. China Architecture & Building Press. 2017. (In Chinese).
[3] XUE Y Q, XIE C H. Numerical Simulation of Groundwater. Science Press. 2007. 9. (In Chinese).
[4] Li G X, Higher Soil Mechanics (Second Edition) [M]. Tsinghua University Press. 2016. (In Chinese).
[5] CHENG L S. Higher Seepage Mechanics [M]. Petroleum Industry Press, 2011. (In Chinese).
[6] LI G X. Advanced Soil Mechanics [M]. Tsinghua University Press. 2004. 7 (In Chinese).
[7] Pan H P, Ma F L, Cai B L et al. Geophysical Logging and Well Logging Geophysical [M]. Science Press. 2009. 4 (6-8). [8] Li J M, Luo Y Z, editor. New Progress in Electrical Prospecting
[M] Beijing: Geological Publishing House, 1996. 98-101. [9] Zhang S Y, Pan Y L. Applied Geophysics [M]. China
University of Geosciences Press. 2005. 1 (15-17).
[10] MAO H J. To study the Heiniudong Deep Orebody Resistivity Profile Method to Determine the Well Logging [J].Sichuan: Computing Techniques for Geophysical and Geochemical Exploration, 2011, 33 (3), 304-308. (In Chinese).
[11] Guo X J. New Method and Application of 3-D Resistivity Tomography [J]. Journal of Jilin University (Earth Science Edition), 2005, 35 (1), 118-122. (In Chinese).
(a) (b)
hole1 hole2 hole1 hole2
0 5 10 15 20
-45 -40 -35 -30 -25 -20 -15 -10 -5 0
0 5 10 15 20
[12] Zhou B., Greenhalgh, S. A., and Hansruedi, M., 2.5-D Frequency-domain Seismic Wave Modelling in Heterogeneous, Anisotropic Media Using a Gaussian Quadrature Grid Technique [J]. Computer and Geosciences 2012, 39, 18-33. (In Australia).