*Address for correspondence
E-mail: [email protected]
Research
Research Paper
Paper
Development and Validation of a Reversed-phase HPLC
Method for the Determination of Hydroxybenzene in a
Cream Formulation
G. A. SHABIR*
Oxford Brookes University, School of Life Sciences, Headington Campus, Oxford, OX3 0BP, United Kingdom
Shabir: RP-HPLC Method for Determination of Hydroxybenzene
A rapid, sensitive and specifi c reversed-phase high performance liquid chromatographic method with diode-array detection has been developed and validated for the determination of hydroxybenzene (0.494%, w/w) in a commercially available cream pharmaceutical formulation. Isocratic chromatography was performed on a C18 column with methanol-water 60:40 (v/v) containing 0.1% phosphoric acid (v/v) as mobile phase at a fl ow rate of 1.0 ml/min. UV detection was at 254 nm. Linearity of the method was excellent (r2 = 0.9999). The relative standard deviation values for intra- and inter-day precision studies were < 1% and the recovery of hydroxybenzene was >99%. The limit of detection and quantitation for hydroxybenzene was found to be 13.5 g/ml and 2 µg/ml, respectively. The method was also validated for specifi city and robustness. The method was found to be robust and can be reliably used to determine the hydroxybenzene content of marketed formulations.
Key words: Hydroxybenzene, method validation, pharmaceutical cream formulation, reversed-phase HPLC
Hydroxybenzene is widely used in the preparation
of drugs, cosmetics including sunscreens[1], hair
dyes, and skin lightening preparations[2]. It is the
starting material in the medicinal formulation of aspirin, herbicide, creams and synthetic resins. Hydroxybenzene belong to a family of compounds especially harmful for the environment, owing to their
toxicity and carcinogenic effect[3]. This compound can
be the source of serious health hazards if released into the environment through accidental spillage or
poor disposal[4-6]. Recently, the determination of such
phenolic compounds has been paid much attention, and verities of analytical methods have been reported. The hyphenation of gas chromatography (GC) and mass spectrometry (MS) has proven powerful for
phenolic compounds assay[7,8], but the cost is generally
high. For only GC based analysis, the poor polarity and insufficient sensitivity of hydroxybenzene are
troublesome[9-12] so the chemical derivatization, such
as silylation[13] and estrifi cation[14] is necessary, which
is time-consuming and costly. The objective of this study was therefore to develop a simple, sensitive, robust and precise reversed-phase high performance
liquid chromatography (RP-HPLC) method for the analysis of hydroxybenzene in pharmaceutical cream formulation without derivatization process.
Today, RP-HPLC is the most popular analytical technique for separating complex mixtures in the chemical, pharmaceutical and biotechnological industry. RP-HPLC is the opposite of normal-phase chromatography, with a nonpolar stationary phase and a polar, largely aqueous mobile phase. The most common stationary phases used are octadecyldimethyl
(C18) phases with silica as the solid support. Silica
mixture in RP-HPLC. Water is considered to be the weak component of the mobile phase and does not interact with the hydrophobic stationary phase chains.
The most popular organic modifi ers used in RP-HPLC
are methanol and acetonitrile. The organic modifi er is
the strong solvent in the mobile phase. The higher the
concentration of organic modifi er, the less retention
an analyte will have. There is no doubt that, also today LC-UV diode-array detection (DAD) plays an important role (detection and peak-purity) in many research and development studies, and for a wide variety of routine analyses. The RP-HPLC method reported in this study was validated in accordance with the International Conference on Harmonization (ICH) guideline[15] and best practice[16,17]. Specifi city,
linearity, precision (repeatability and intermediate precision), accuracy, robustness, limit of detection and limit of quantitation were evaluated.
MATERIALS AND METHODS
Methanol (HPLC-grade), hydroxybenzene (pure >
99.5%), phosphoric acid (H3PO4) were obtained
from Sigma-Aldrich (Gillingham, UK). Distilled water was de-ionised by using a Milli-Q system (Millipore, Bedford, MA). The Knauer HPLC system (Berlin, Germany) equipped with a model 1000 LC pump, model 3950 autosampler, model 2600 photodiode-array (PDA) detector and a vacuum degasser was used. The data were acquired via Knauer ClarityChrom Workstation data acquisition software. The mobile phase consisted of a mixture of methanol-water (60:40, v/v) containing 0.1% phosphoric acid (v/v). The flow rate was set to
1.0 ml/min. The injection volume was 20 l and
the detection wavelength was set at 254 nm. RP-HPLC analysis was performed isocratically at room
temperature (24±1) using a Spherisorb C18 (250 ˜
4.6 mm, 5 m) column (Waters, Elstree, UK).
Standard and sample preparation:
An accurately weighed amount (100 mg) of hydroxybenzene, standard was placed in a 100 ml
volumetric fl ask and dissolved in a methanol (stock).
A 4 ml aliquot of stock solution was transferred to a
second 100 ml volumetric fl ask and diluted to volume
with mobile phase, yielding a fi nal concentration of
40 μg/ml. An accurately weighed amount (1.0 g) of
sample cream into a 100 ml volumetric fl ask and 20
ml methanol was added. The mixture was heated on
a water bath to boiling point. Firmly stopper the fl ask
and shake vigorously to disperse the melted sample. The solution was then cooled to room temperature. Fifty milliliter of mobile phase was added to the
fl ask and again heated the mixture to boiling point.
Firmly stopper the fl ask, shake the mixture vigorously
to disperse the sample. Then sample was cooled to room temperature and diluted to 100 ml with mobile
phase, yielding a fi nal concentration of 10 mg/ml. The
sample was fi ltered through a qualitative fi lter paper
No. 1 (Whatman, Lawrence, USA) and injected into
the HPLC system.
RESULTS AND DISCUSSION
HPLC separation of hydroxybenzene was carried out
on a Spherisorb C18 column by an isocratic elution
with methanol-water (60:40, v/v) containing 0.1%
phosphoric acid (v/v). The fl ow rate was constant at
1.0 ml/min and the column temperature was at room
temperature (24±1). The UV wavelength was set at
254 nm. No interference from diluents, impurities, or excipients present in the pharmaceutical formulation was observed at this detection wavelength. Before each run LC column was equilibrated with the mobile phase for about 15 min. A sharp, symmetrical peak was obtained for hydroxybenzene when analyzed
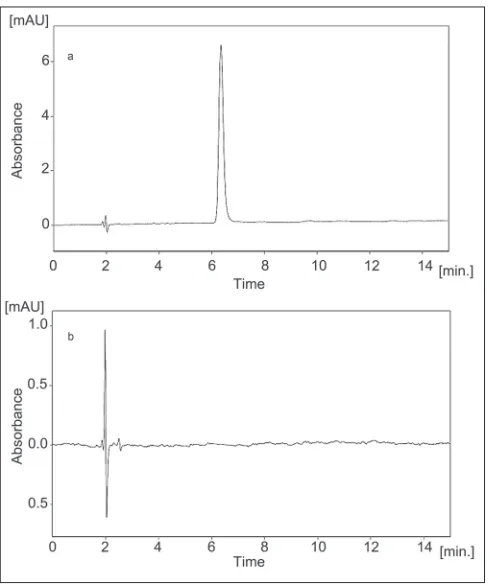
under these conditions (fi g. 1a). This retention time
enable rapid determination of the drug, which is important for routine quality control analysis. Use of an un-buffered mobile phase is another advantage of the proposed method, because buffers reduce column life. Also sample preparation is simple and no dramatization process required.
System suitability test was established from six
replicate injections of a solution containing 40 μg
hydroxybenzene/ml. The percent relative standard deviation (RSD) of the peak area was calculated. The peak retention factor (k) for drug was calculated from k = (tR – t0)/t0, where tR and t0 are the retention times of the peak of interest and the solvent front, respectively. A useful and practical measurement
of peak shape, the peak asymmetry factor, As, was
calculated at 10% of peak height. Column plate number was determined using the formula, N = 5.54(tR/wh)2, where w
h is the bandwidth at 50%
of peak height. The proposed method met these requirements within the United States Pharmacopoeia
(USP) accepted limits (Table 1)[18]. The stability of
method development phase. Six solutions containing
40 μg/ml of hydroxybenzene were tested. Analysis
was performed after preparation and at 3 and 5 days thereafter. The solutions were stable during the
investigated 5 days and the RSD was 1.0% for
retention time (min), peak area and height. Standard solutions stored in a capped volumetric flask on a laboratory bench under normal lighting conditions for
5 days, were shown to be stable with no signifi cant
change in hydroxybenzene concentration over this period.
Appropriate amounts of hydroxybenzene stock
solutions (250 μg/ml) were diluted with mobile phase
to give concentration of 2, 20, 30, 40, 50, 60 and
80 μg/ml. Each solution was injected in triplicate
and calibration plot was prepared. Linearity was evaluated by linear least-squares regression analysis. Good linearity was observed over the concentration
range evaluated (2-80 μg/ml). The slope and intercept
of the calibration plot (±standard deviation, n= 3) were 158.45+1661.8 and the correlation coefficient was 0.9999 (Table 2). The validity of the assay was verified by analysis of variance. This revealed the
regression equation was linear (Fcalculated = 13,427
> Fcritical = 4.96; P = 5%) with no deviation from
linearity (Fcalculated = 0.14 Fcritical = 2.68; P = 5%).
The precision of the method was investigated with respect to repeatability and intermediate precision. The repeatability (intra-day precision) of the method was evaluated by assaying six replicate injections of the hydroxybenzene at 100% of test concentration
(40 μg/ml) on the same day. The %RSD of the
retention time (min) and peak area were calculated
(Table 2). Intermediate precision (inter-day precision) was demonstrated by two analysts using two HPLC systems and evaluating the relative peak area percent data across the two LC systems at three different concentration levels (50%, 100%, and 150%)
that cover the assay method range (2-80 μg/ml).
The %RSD across the systems and analysts were calculated from the individual relative percent peak area mean values at the 50%, 100%, and 150% of the
test concentration. The intra-day (n= 6) and inter-day
(n= 3) %RSD are given in Table 2. All the data are
within the acceptance criteria of 2%.
Accuracy of the method was evaluated by fortifying
a hydroxybenzene sample solution (80 μg/ml)with
Fig. 1: Typical LC chromatograms of sample and placebo
Typical LC chromatograms obtained from, (a) sample; (b) chromatogram of placebo demonstrating the absence of interference with hydroxybenzene (retention time 6.3 min).
TABLE 1: SEPARATION CHARACTERISTICS OF HYDROXYBENZENE ANALYSED UNDER OPTIMISED CONDITIONS
Parameter Recommended limitsa
Results
Retention time (min) - 6.350 Injection repeatabilityb RSD £ 2 % for n = 5 0.16
Retention factor (k) K > 2.0 4.16 Width at 50% height (min) - 0.18 Asymmetry factor (10%, As) As£ 2.0 1.10
Plate number (N) N > 2000 11345
aUnited States Pharmacopeia limits; bSix replicate injections
TABLE 2: METHOD VALIDATION OF HYDROXYBENZENE
Validation step Parameters Results Acceptance criteria
Linearity (n = 7) Correlation coeffi cient (r2)
r2= 0.9999 > 0.998
Repeatability
(n = 6) %RSD: tPeak areaR (min); 0.080.11 £ 2 Intermediate
precision (n = 3)
%RSD: Instruments;
Analysts 0.160.12
£ 2
LOD s/n ratio s/n = 3.06
(13.5 g/ml) s/n »3:1 LOQ* s/n ratio s/n = 10.42 (2
three known concentrations of reference standard (30,
40, and 50 μg/ml). Percent recoveries were calculated
form differences between the peak areas obtained for fortified and unfortified solutions. Good recoveries were obtained (Table 3). No significant differences were observed between amounts of hydroxybenzene
added and the amounts found (p 0.05).
Injections of the extracted placebo were performed to demonstrate the absence of interference with the elution of the hydroxybenzene. This result
demonstrates (fi g. 1b) that there was no interference
from the other materials in the cream formulation and, therefore, confi rms the specifi city of the method. The forced degradation studies were also applied to hydroxybenzene reference standard at a concentration
of 40 μg/ml to verify that none of the degradation
products interfered with quantitation of the drug. Hydrolytic degradation was studied by heating the
drug under refl ux at 80 in 0.1 M hydrochloric acid
and 0.1 M sodium hydroxide for 4 h. The samples were then cooled to room temperature and neutralized. Oxidative degradation was studied by treating the drug with 3% hydrogen peroxide at room temperature
(24±1) for 4 h. Solutions containing 40 μg/mlof
each degraded sample were prepared and injected in triplicate. Thermal degradation was studied by heating
samples in oven at 80 for seven days. No signifi cant
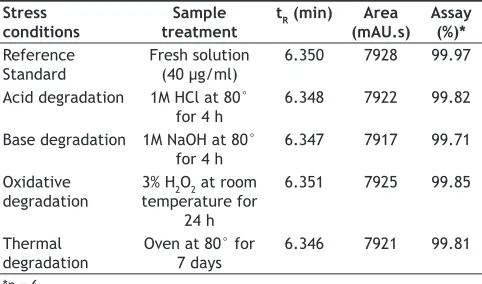
degradation was observed under any stress conditions studied (Table 4). In addition, DAD data were collected for all the degradation conditions studied, with the purpose of peak-purity evaluation. These analyses showed that no impurities or degradation products were coeluting with the hydroxybenzene peak.
The limit of detection (LOD) and limit of quantitation
(LOQ) tests for the procedure were evaluated by serial dilutions of hydroxybenzene stock solutions in order to obtain signal-to-noise ratios (s/n) of
3:1 and 10:1, respectively. The LOD value for
hydroxybenzene was found to be 13.5 g/ml(s/n =
3.06, fig. 2) and LOQ (n =6) was 2 μg/ml(s/n =
10.42) as shown in Table 2.
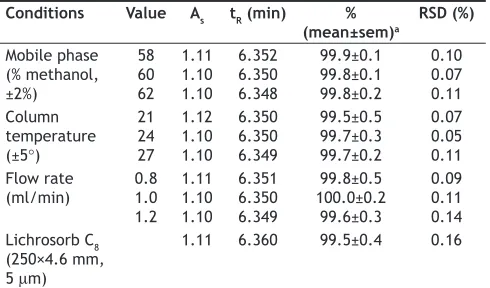
Robustness of the method was evaluated by the analysis of hydroxybenzene under different experimental conditions such as changes in the composition of the mobile phase, column temperature, flow rate and different columns. The percentage of methanol in the mobile phase was varied ±2%, the
column temperature was varied ±3 and, the fl ow rate
was varied ±0.2 ml/min. Their effects on the retention time (tR), asymmetry factor (As) at 10%, recovery and repeatability were studied. Deliberate variation of the
method conditions had no signifi cant effect on assay
data or on chromatographic performance, indicating the robustness of method and its suitability for routine use and transfer to other laboratories. The results from robustness testing are presented in Table 5.
A RP-HPLC method with UV-DAD detection for the assay of hydroxybenzene was developed and validated. The results showed that the method is
TABLE 3: RECOVERY STUDIES OF HYDROXYBENZENE FROM SAMPLES WITH KNOWN CONCENTRATIONS
Sample % of
nominal Amount of analyte (Added Found μg/ml) Recovery (%)* RSD (%)*
1 50 4.0 3.98 99.50 0.07 2 100 8.0 7.98 99.75 0.10 3 150 12.0 12.01 100.08 0.09 *n = 3
TABLE 4: RESULTS OF THE STRESS CONDITIONS EXPERIMENTS
Stress
conditions treatmentSample tR (min) (mAU.s)Area Assay (%)*
Reference
Standard Fresh solution (40 μg/ml) 6.350 7928 99.97 Acid degradation 1M HCl at 80°
for 4 h
6.348 7922 99.82
Base degradation 1M NaOH at 80°
for 4 h 6.347 7917 99.71 Oxidative
degradation 3% Htemperature for 2O2 at room 24 h
6.351 7925 99.85
Thermal
degradation Oven at 80° for 7 days 6.346 7921 99.81 *n = 6
very selective, no significant interfering peak was detected; accurate, with the percentage recoveries
> 99; and reproducible, with the %RSD 1%. The
method was sensitive; a little as 13.5 g/mlcould
be detected with the LOQ of 2 μg/ml. The method
involves use of a simple mobile phase and minimum sample preparation, encouraging its application in quality control for analysis of hydroxybenzene in
bulk samples, raw materials and fi nal cream products
formulations.
ACKNOWELDGEMENTS
The author thanks Dr Simon Giles, School of Life Sciences, Oxford Brookes University, for his support in buying materials for research work.
REFERENCES
1. Svobodova A, Psotova J, Walterova D. Natural phenolics in the prevention of UV-induced skin damage. a review. Biomed Papers 2003;147:137-45.
2. DeSelms RH. UV-active phenol ester compounds. Washington, DC: Enigen Science Publishing; 2008.
3. Boutwell RK, Bosch DK. The tumor-promoting action of phenol and related compounds for mouse skin. Cancer Res 1959;19:413-24.
4. Kringstad KP, Lindstrom K. The characterization of organochlorine compounds. Environ Sci Technol 1984;18:236A-48A.
5. Marcheterre L, Choudhry GG, Webster GR. Environmental photochemistry of herbicides. Rev Environ Contam Toxicol 1988;103:61-125.
6. Neilson AH, Allard AS, Hynning PA, Remberger M. Distribution fate and persistence of organochlorine compounds formed during production of bleached pulp. Toxicol Environ Chem 1991;30:3-41.
7. Nakamura, S,Daishima S. Simu ltaneous determination of alkylphenols and bisphenol in a river water by stir bar sorptive extraction with in situ acetylation and thermal desorption GC-MS. J Chromatogr A 2004;1038:291-4.
8. Kuklenyik Z, Ekong J, Cutchins CD, Needham LL, Calafat AM. Simultaneous measurement of urinary bisphenol and alkylphenols by automated solid-phase extractive derivatization GS/MS. Anal Chem 2003;75:6820-5.
9. Khoschsorur GA, Petek W. Rapid determination of benzene metabolites phenol and p-cresol in the urine of petrol stations workers by GC. Anal Sci 2000;16:589-91.
10. Bieniek G. Simultaneous determination of phenol, cresol, xylenol isomers and napthols in urine by capillary GC. J Chromatogr B 1996;682:167-72.
11. Veningerova A, Prachar V, Uhnak J, Lukácsova M, Trnovec T. Determination of chlorinated phenols and cresols in human urine using solid-phase extraction and GC. J Chromatogr B 1994;657:103-10. 12. Tashkov W, Benchev IN, Rizov IM, Kafedzhieva M, Kolarska A.
Phenol and p-cresol determination in urine by a rapid headspace GC method. Chromatographia 1991;32:466-8.
13. Pyon KH, Kracko DA, Strunk MR, Bechtold WE, Dahl AR, Lewis JL. An isoptope-dilution GC/MS method for trace analysis of xylene metabolites in tissues. J Anal Toxicol 1997;21:363-8.
14. Kezic S, Jakasa I, Wenker M. Determination of mandelic acid enantiomers in urine by GC and electron-capture or fl ame ionisation detection. J Chromatogr B 2000;738:39-46.
15. Validation of analytical procedures: Text and Methodology Q2 (R1), International Conference on Harmonization (ICH) of Technical Requirements for Registration of Pharmaceuticals for Human. Geneva, Switzerland, 2005.
16. Shabir GA, Lough WJ, Shafi que AA, Bradshaw TK. Evaluation and application of best practice in analytical method validation. J Liq Chromatogr Relat Technol 2007;30:311-33.
17. Shabir GA. Validation of HPLC methods for pharmaceutical analysis: Understanding the differences and similarities between validation requirements of the U.S. Food and Drug Administration, the U.S. Pharmacopoeia and the International Conference on Harmonization. J Chromatogr A 2003;987:57-66.
18. US Pharmacopoeia (USP) 32, Chromatography Section 621. Rockville MD: United States Pharmacopeal Convention; 2009. p. 1776. TABLE 5: ROBUSTNESS OF THE METHOD
Conditions Value As tR (min) % (mean±sem)a
RSD (%)
Mobile phase (% methanol, ±2%)
58 60 62
1.11 1.10 1.10
6.352 6.350 6.348
99.9±0.1 99.8±0.1 99.8±0.2
0.10 0.07 0.11 Column
temperature (±5)
21 24 27
1.12 1.10 1.10
6.350 6.350 6.349
99.5±0.5 99.7±0.3 99.7±0.2
0.07 0.05 0.11 Flow rate
(ml/min) 0.81.0 1.2
1.11 1.10 1.10
6.351 6.350 6.349
99.8±0.5 100.0±0.2
99.6±0.3
0.09 0.11 0.14 Lichrosorb C8
(250×4.6 mm, 5 m)
1.11 6.360 99.5±0.4 0.16
aSem is the standard error of the mean, The recommended chromatographic
conditions were Spherisorb C18 (250×4.6 mm, 5 mm) column with methanol-water 60:40 (v/v) mobile phase at a fl ow rate of 1 ml/min, UV detection at 254 nm and column temperature 24°.