Studies of Methods of Pre-launch Testing
of Satellite Radar Altimeters
by
D ecla n V in c e n t S h e e h a n
A thesis submitted to the University of London for the Degree of Doctor of Philosophy in Electronic Engineering
Department of Electronic and Electrical Engineering
UNIVERSITY COLLEGE LONDON
ProQuest Number: 10017257
All rights reserved
INFORMATION TO ALL USERS
The quality of this reproduction is dependent upon the quality of the copy submitted.
In the unlikely event that the author did not send a complete manuscript and there are missing pages, these will be noted. Also, if material had to be removed,
a note will indicate the deletion.
uest.
ProQuest 10017257
Published by ProQuest LLC(2016). Copyright of the Dissertation is held by the Author.
All rights reserved.
This work is protected against unauthorized copying under Title 17, United States Code. Microform Edition © ProQuest LLC.
ProQuest LLC
789 East Eisenhower Parkway P.O. Box 1346
Jlôstract
The radar altimeter operating in a pulse-limited mode has been successful in charting the ocean surfaces of the Earth. The scientific community, in a drive to map rougher terrain, have adopted the same principle. However in order to overcome the problem of slope- induced error, the range window may be widened or narrowed in accordance with the surface roughness. The ERS-1 altimeter included a second range window for operation over ice, but which had to be controlled by macro-command from the ground. The Advanced Terrain-Tracking Altimeter is a prototype altimeter which has an on-board resolution-switching algorithm, allowing the range window to be changed appropriately. This thesis focuses on methods of pre-launch testing of advanced radar altimeters. The early chapters review some of the calibration and testing methods used for the ERS-1 altimeter, presenting a critical assessment of some of the pre-launch methods. The testing procedure for the Adaptive Terrain-Tracking Altimeter is significantly more complex because of the extra resolution-switching algorithm, and a return signal simulator is identified as an essential element in testing the adaptive resolution prior to launch.
The core of the thesis therefore describes a novel method of return signal simulation in which sequences of realistic echoes, from all types of surface, are fed in real time to the prototype altimeter, at the appropriate resolution, with the appropriate fading characteristics, and at the appropriate instant in time. Such a simulator is feasible only if the simulated echo is modelled in the deramp domain (i.e range window space) rather than actual delay time. Then the Fourier Transforms of the echoes, rather than the echoes themselves, are calculated at the full pulse repetition frequency and are stored in a memory. The resolution may then be varied by altering the rate at which the echoes are read out of memory. A prototype Return Signal Simulator is built, tested and shown to be capable of testing the Adaptive Terrain-Tracking Altimeter.
A test philosophy is defined to assist the testing of the prototype altimeter, which will be undertaken by British Aerospace. A prelim inary analysis, using a software implementation of the return signal simulator and realistic echoes, demonstrated that the Model Free Tracker has a superior tracking performance than the generally preferred Offset Centre Of Gravity tracking algorithm. However both algorithms suffer from problems, and these problems are identified.
To my dear wife Yvonne,
S^cknozuCedgements
Many people have taken a keen interest in this research from the outset. First and foremost, I would like to express my gratitude to my supervisor, Dr. Hugh Griffiths, for his advice, guidance and technical suggestions throughout. He has always been prodigal of his assistance; in particular I am indebted to Hugh for the time he spent proof-reading my thesis, and I have respected his red pen. I thank Hugh also for his friendship.
Dr. Paul Brennan became involved towards the end of the project whilst Hugh was on sabbatic^ leave. Paul, whose technical competence is unrivalled, made a very significant contribution in the short time in which he was involved. I will always be grateful to Paul.
I would like to thank Professor K. Milne and Professor R. Benjamin for some stimulating discussions from which some valuable and important points emerged. Others I would like to mention include Dr. D.J. Wingham, who was responsible for the early development of the research, and Dr. Behruz Purseyyed, with whom I had many useful and enjoyable discussions during the early years of my research.
I am grateful to the British Embassy in Dublin for a two-year scholarship in the early part of my doctorate. I would also like to acknowledge the Royal Aerospace Establishment in Famborough for supporting the early part of this and related work, and the European Space Agency for supporting the latter two years.
The technical construction and mechanical assembly of the prototype return signal simulator would not have been completed had it not been for the goodwill and efficiency of Wolfram Titze and Andrew Wilkinson who helped me greatly in my hour of need. For this I sincerely thank them.
From the other collaborating groups involved in the Breadboard Altimeter Test and Study, I would like to acknowledge John Bradford of the Rutherford Appleton Laboratory, Dick Durrant and Steve Parkes from British Aerospace, Filton and G. Franchin from Fabbrica Italiana Apparecchiature Radioelettriche S.p.A (FIAR).
Finally, I would like to thank my colleagues in the Antennas and Radar Group for their encouragement and friendship over the years. In this regard I will particularly remember Wolfram Titze, Tony Vernon and Brian Armstrong. For their part in creating a warm and friendly environment, I would like to thank Dr. Paul Brennan, Roni Eiges, James Gamett, Saeed Khosrowbeygi and Andrew Wilkinson.
Originaâty is notfiing But judicious imitation. ŒBe most originaC
zoriters Borrowed from one anotfier. TJie instruction
we fin d in Books is Cik^fire. We feted it from our migd^ours,
kindle it at dome, communicate it to others, and it Becomes the property o f all.
Cotitents
Page
Title page A bstract. Dedication
Acknowledgements Quotation
Contents.
List of Acronyms List of Symbols List of Figures
1 3 4 5 6 7
12
13 17
C h apter 1 - Introduction
1.1 Historical Perspective .
1.2 Errors in the Altimeter Measurements 1.3 Aim of the Research .
1.4 Thesis Layout . . . .
23 27 28 29
C h apter 2 - Pre-Launch Testing o f A ltim eters
2.1 Description of the Advanced A ltim e te r... 31
2.2 Altimeter Testing 37
2.2.1 Ocean Return S i m u l a t o r s ... 39 2.2.2 Measures of Altimeter Performance over Non-Ocean Surfaces . 40 2.2.3 Resume of Previous Terrain Tracking Studies . . . 4 4 2.2.4 Real Time T e s t i n g ...45 2.3 Pre-Launch Calibration A ctivities...46 2.3.1 The ERS-1 Internal Calibration M e th o d ... 47 2.3.2 Pre-Launch Internal Calibration using a Precision RSS . . 5 1 2.3.3 Pre-Launch External C a lib ra tio n ...55
2.4 Post-Launch Calibration 55
2.4.1 External Calibration of the Engineering Parameters . . . 5 5 2.4.2 Geophysical C a h b r a t i o n ... 57
Contents
C h apter 3 - Sim ulation o f A ltim eter E choes
3.1 Scattering M o d e l s ... 59
3.1.1 The Return Signal Scattered from a Poisson Process . . 62
3.1.2 The Scattered Return from a S u r f a c e ... 63
3.1.3 Relation between the Facet Model and the Poisson Process . 67 3.1.4 Timing of the Simulated E c h o ... . 6 9 3.1.5 Timing Errors as a result of the Simulation . . . . 7 1 3.2 Adaptive R e s o lu tio n ... . 7 2 3.2.1 Adaptive Resolution using a Number of Different Data Sets . 72 3.2.2 Adaptive Resolution by Spectrally Compressing . . . 7 2 3.2.3 Properties of the RSS Simulated E c h o ... 76
3.2.4 Effect of using an FT rather than an FFT . . . . 8 1 3.2.5 Possible Resolution C h a n g e s ... 82
3.3 Software Return Signal S i m u l a t o r ...84
3.3.1 Software Model of the R S S ...84
3.3.2 Simulation of a Resolution C h a n g e ... 86
3.3 .3 S ignal to Noise C o n s i d e r a t i o n s ... 91
3.4 Forms of Return Signal S i m u l a t i o n ...93
3.4.1 Methods using an Inverse F F T ... 93
3.4.1.1 RSS for the ERS-1 A l t i m e t e r ... 93
3.4.1.2 RSS with Separate Data Sets for each Resolution . . . 9 6 3.4.2 Convolver... 98
3.4.3 Series of Overlapping C h i r p s ... 100
3.5 S u m m a ry ...102
C h apter 4 - P ro to typ e Return Signal Sim ulator D esign and A n alysis
4.1 Outline of the Design Requirements 4.2 Outline of the Design . . . .
4.2.1 Basic Solution - DRAM Memory 4.2.2 Timing Considerations
4.2.3 Chirp Considerations 4.2.4 Echo Duration .
Contents
4.3 Prototype Circuit Design . . . . 4.3.1 The Digital Chirp Generator.
4.3.2 The Memory and Control unit
4.3.3 The Frequency Synthesiser . . . . 4.3.4 The Chirp Upconversion Unit
4.3.5 The Anti-Aliasing Filters and Switching Networks 4.3.6 The RF Front E n d ... 4.3.7 Interface to the Chirp Generator .
4.3.8 The RSS Control Comput er . . . . 4.4 Compensation Factors...
4.4.1 Filter D istortion... 4.4.2 Maximum Number of Resolutions
4.4.3 Effects at Coarser Resolutions
4.5 Definition of Echo Sequences . . . . . 4.5.1 Types of S c e n a r i o s ... 4.5.2 Authenticity of Echo Waveforms .
4.5.3 Dynamic Range of Echoes in a Scenario
4.6 Summary . . . .
115 115 116 118 119 122 123 124 125 127 127 129 131 132 132 137 139 142
C h apter 5 - R esults O btain ed fro m Testing the A ltim eter
5.1 RSS T i m i n g ... 143
5.1.1 FRF T i m i n g ... 145
5.1.2 Timing P r e c i s i o n ...145
5.1.3 Timing Jitter resulting from Phase Noise on the DAC Clock . 146 5.1.4 Timing D i s p e r s i o n ...149
5.2 RSS Echo Shape F i d e l i t y ... 151
5.2.1 Gain F l a t n e s s ... 151
5.2.2 Dynamic Range of a Single E c h o ... 152
5.2.2.1 Measurement of Carrier and Sideband Suppression. . .1 5 2 5.2.2.2 Effect of Spurii on the Echo S h a p e ... 157
5.2.3 Out of Band S p u r i i ...158
5.3 The Chirp G e n e ra to r...160
5.4 Testing the A ltim e te r...163
Contents
C h apter 6 - A n alysis o f C hirp E rrors
6.1 Analysis of Chirp Errors using a Fourier Series
6.1.1 Phase E r r o r s ... 6.1.2 Amplitude E r r o r s ... 6.2 Analysis of Chirp Phase Errors using a Power series
6.2.1 The Power Series Approach . . . . 6.2.2 lim it of Applicability of the Power Series Approach 6.2.3 Examples of Phase E r r o r s ... 6.2.4 Summary of the Power Series Approach to Phase Errors 6.3 Analysis of Amplitude Errors using a Power Series
6.3.1 Simulation of Amphtude Distortion
6.3.2 Combined Effect of Amplitude and Phase Errors 6.4 S u m m a ry ...
170 170 173 174 174 179 180 182 183 183 187 188
C h apter 7 - D iscussion o f R esults
7.1 S u m m a ry ... 7.2 Further Investigations and Applications .
7.2.1 Further Investigations .
7.2.1.1 Testing the Prototype Altimeter 7.2.1.2 Recommended Hardware Changes
7.2.1 Application of the RSS to Other Altimeters 7.2.2.1 Spacecraft Docking Radar .
7.2.2.2 A Constellation of Altimeters 7.3 Conclusions 189 192 192 192 193 194 194 194 195 REFERENCES 199 APPENDICES
A .l Mathematical Description of the A l t i m e t e r ... 205 A .1.1 Timing of the Echo and Formation of the Range Window . 205 A. 1.2 Processing of the Simulated Echo in the Altimeter . . . 206 A .1.3 The Power Spectrum of an Echo at a Coarser Resolution . . 208 A. 1.4 Model of the Software S im u lato r... 208 A. 1.5 Model for Imperfect Single Sideband Modulation . . 209
Contents
A.2
A.3
A.4
A.5 A.6
A.7 A.8 A.9 A.IO A .ll
Effect of Windowing on the Sampled Data S e t ...213
Operation of the BAe Chirp Generator in the R S S ...215
A.3.1 No Compensation for the Filter Group Delay Variation . .2 1 6 A.3.2 Compensation for the Filter Group Delay Variation . . . 217
Circuit and Block Diagrams of the Prototype R S S ...219
A.4.1 DRAMs and DRAM C o n t r o l l e r ...219
A.4.2 The RF Front E n d ... 224
A.4.3 The Phase Locked Loop S y n t h e s i s e r ... 225
A.4.4 Other Supporting C irc u itry ...227
A Description of the Control S o ftw a re ... 230
The OCOG and MET Tracking A lg o r ith m s ... 235
A.6.1 O C O G ... 235
A.6.2 M FT ...237
The Proposed Acquisition Phase of the A T T A ...239
Analysis of Gain Flatness in A ltim e te r . 243 Limitations in the Method of Chirp Generation . . . 245
Equivalence between the Two Phase Distortion Definitions . . . 247 The Echo Generation Procedure
List cfSlcronyms
AABB Advanced Altimeter BreadBoaid
AAFE Advanced Applications Flight Experiment AGC Automatic Gain Control
APL Applied Physics Laboratory
ATTA Advanced Terrain-Tracking Altimeter BAe British Aerospace
DAG Digital to Analogue Converter DCG Digital Chirp Generator
EOPAP Earth and Ocean Physics Applications Program EOS Earth Observing System
ERS-1 European Remote Sensing Altimeter
FIAR Fabbrica Italiana Apparecchiature Radioelettriche S.p.A. FIFO First In-First Out
FFT Fast Fourier Transform
GLRS Geodynamic Laser Ranging System GPS {Global Positioning System
IF Intermediate Frequency LO Local Oscillator
LPF Low Pass Filter
MSSL MuUard Space Science Laboratory MFT Model Free Tracker
NASA National Aeronautical and Space Administration OCOG Offset Centre Of Gravity Tracker
PLL Phase Locked Loop
PRF Pulse Repetition Frequency
PROM Programmable Read Only Memory QA Quality Assurance
RAL Rutherford Appleton Laboratory RAM Random Access Memory
RSS Return Signal Simulator RF Radio Frequency SAW Surface Acoustic Wave SLR Satellite Laser Ranging
SMLE Sub-optimal Maximum Likelihood Estimator SWH Significant Waveheight
TWT Travelling Wave Tube UCL University College London VCO Voltage Controlled Oscillator
L i s t o f S y m B o C s B % A G L La Ldcr Ldct Lr U N Np ^ in fligh t ^let N N. sat ^COG P .. Pt PRF PRFm, Qm Qn ^radial T
Chirp bandwidth (Hz)
Altimeter range to the surface (m) Antenna gain
Value of the in-phase version of signal at the m * samphng point Loss in the attenuator used for internal power calibration (dB) Loss in the directional coupler in the receiver path (dB)
Loss in the directional coupler in the transmit chain (dB) Loss in the receiver path (dB)
Loss in the transmit chain (dB)
Number of samples in simulated echo
Number of filters (bins) in the range window Number of pulses in flight
Percentage of time the return is maintained in the range window Percentage of time the first non-zero return is not registered Percentage of time the return is tracked and unsaturated
Percentage of time the signal to noise ratio is below a threshold Position of the centre of gravity in the OCOG algorithm
Measured calibration signal power
Received power in the altimeter range window (W) Calibration signal in the receiver (W)
Received power at the antenna (W) Peak transmit power (W)
Pulse repetition frequency (Hz)
Maximum pulse repetition frequency (Hz)
Value of the quadrature version of signal at m * samphng point Percentage of time the return is tracked at the n* resolution Satelhte radial position (m)
Uncompressed pulse length (s) Calibration 'equivalent' range (s) Echo duration due to beam-limiting (s)
L ist o f ÿrincvpaC symBoCs
^radial Radial position of the Venice Tower (m) Tg Sampling interval (s)
W Width of signal in OCOG algorithm
a| Amplitude weightings b Chirp modulation rate (Hz/s) b j^ Height bias of the radar altimeter c Speed of light (= 3.00 x 10^) dcorr Decorrelation distance (m)
f Frequency (Hz)
f Mean frequency (Hz)
fdiff Frequency difference between the RSS and transmit chirp (Hz) fmuit Speed of the multipliers (Hz)
g Receiver gain in altimeter after deramp
h Height of satellite above the reference ellipsoid (m)
r Radius of pulse-limited footprint (m), and radial vector to surface t Time coordinate (s)
th Deramp trigger instant (s)
t^ Time difference between received and deramp chirps (s)
t^jiff Time between actual and calibrated signal in 'in-orbit' calibration to Time of the first return
tpt Time delay to a point target (s) tj. Trigger instant of the RSS chirp (s)
tide Tide gauge measurement in ERS-1 claibration scheme (m) V Speed of the satellite (m/s)
X Along track coordinate (m) y Across track coordinate (m) z Radial coordinate (m) s Delay time variable (s) | a a-P filter parameter P a-P filter parameter
5j. Range resolution (m)
(j>i Weights used in power series approach to phase distortion (rad) q Resolution factor
L ist c f principal symBoCs
X Wavelength of the RF carrier (m)
9 Beamwidth of the antenna of the radar altimeter (°) a° Backscatter coeficient of the surface
Gg Sigma-s (significant waveheight / 4)
X Compressed pulse length, and resolution (s) Xj Delay time to a facet on the surface
CO Angular frequency space or 'deramp domain' (rad)
cOq Angular centre frequency of the chirp (rad)
cOn Angular frequency of the tone in the n* resolution bin (rad) (0 ^ 1 Angular frequency of Fourier series defining phase distortion
A a Time delay in the attenuator (s)
AD ERS-1 fixed time delay for transmit chain (s) ^fei ^fe2 Front end time delays (s)
A(j)d( ) Phase distortion of deramp chirp (rad) A(})t( ) Phase distortion of transmit chirp (rad)
Alo Timing delay in the deramp local oscillator (s)
A jx i Time delay between transmit trigger and RSS chirp (s) A^x Timing delay in the transmit chain (s)
A^ 2 RSS time delay (s)
AG Change in gain (dB)
A h Height bias (m) or height difference AR Range window extent (m)
AT Misalignment of deramp and returned chirp
A(t) Quadratic phase function of chirp Aj(t) Amplitude distortion on the chirp
b(co) Amplitude spectrum of signal in RSS at a coarser resolution B(t,s) Echo information
d(t) Impulse response of the surface 5(t) Dirac function
(|)(t) Phase function (rad)
L ist o f principal symBoL
0(0)) Spectrum of phase distortion
f(co) Amplitude spectrum of the simulated echo
fa(co) Amplitude spectrum of the echo when observed in the altimeter F(t) Echo signal in time domain
F^(t) Echo signal in the time domain after deramp by the altimeter g(t) Simulated signal
H(t) Gating signal whose width is equal to the pulse length I(t) In-phase component of the simulated baseband signal Ia(t) In-phase component of the signal in the altimeter n(co) Noise function
Pi (co) Power spectrum in range window at a finer resolution P2(co) Power spectrum in range window at a coarser resolution
Ppg(%) Average flat surface impulse response (W)
Pj.(t) Average square law detected power from a rough surface (W) Q(t) Quadrature component of the simulated baseband signal Qa(t) Quadrature component of the altimeter baseband signal qg(t) Probability distribution of the heights of the scatterring facets R(o)} Normalised Rayleigh fluctuations
SLp((o) Low pass anti-alias filter in altimeter Sj.(t), Sj.(co) Point target response of radar
S1 (co) Point target response modified by phase distortion
U(t) Heaviside unit step function
0 Convolution
11 Modulus
< > Expectation function
f Fourier Transform
Re Real part of expression Im Imaginary part of expresion
L i s t o f j i g u r e s
Figure no. Title Page
Fig. 1.1-1 The development of altimeter instrumentation. 25 Fig. 1.1-2 Pulse limited operation over a flat surface 26 Fig. 1.1-3 Pulse limited operation over a rough surface 26 Fig. 1.2-1 The geometry of the satellite measurement 28
Fig. 2.1-1 The full-deramp principle of operation of a radar altimeter 33 Fig. 2.1-2 The pulse and beam-limited geometries of the altimeter 33 Fig. 2.1-3 A block diagram of the Adaptive Terrain-Tracking Altimeter 34 Fig. 2.1-4 The ideal and typical characteristic of the height error algorithm 35 Fig. 2.1-5 Examples of common radar altimeter echoes 35 Fig. 2.1-6 The centre of gravity tracking algorithm. 36 Fig. 2.1-7 An example of the tracking point being lost, and the resulting 36
switch in resolution to maintain track of the echo
Fig. 2.2-1 An overview of the calibration and testing envisaged for the 38 Adaptive Terrain-Tracking Altimeter
Fig. 2.2-2 The pre-launch performance of the SEASAT altimeter using an RSS 41 Fig. 2.2-3 The pre-launch performance of the ERS-1 altimeter using an RSS 41
to simulate an ocean surface
Fig. 2.2-4 A series of echo waveforms from a single source packet (i.e. 1 s) 43 over a simulated ice surface
Fig. 2.3-1 A block diagram of the internal engineering calibration method 46 used in the ERS-1 altimeter
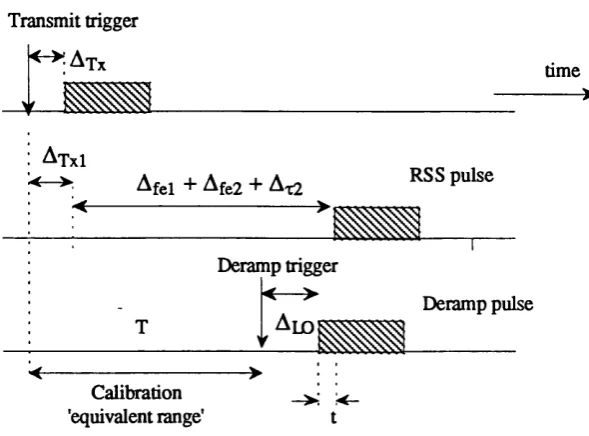
Fig. 2.3-2 A timing diagram of the ERS-1 in-orbit calibration method 48 Fig. 2.3-3 Examples of the uncertainty in the timing of a single point target 48 Fig. 2.3-4 Improvement in precision using a curve fitting technique 50 Fig. 2.3-5 A form of internal pre-launch calibration using a precision RSS 52 Fig. 2.3-6 The timing diagram of the calibration method using a precision RSS 53 Fig. 2.3-7 The operating conditions differ considerably when an altimeter 54
designed for a satellite is flown on an aircraft
Fig. 2.4-1 The Venice Tower external height calibration method 56
Fig. 3.1-1 Fig. 3.1-2 Fig. 3.1-3 Fig. 3.1-4 Fig. 3.1-5 Fig. 3.1-6 Fig. 3.1-7 Fig. 3.1-8 Fig. 3.2-1 Fig. 3.2-2 Fig. 3.2-3 Fig. 3.2-4 Fig. 3.2-5 Fig. 3.2-6 Fig. 3.2-7 Fig. 3.3-1 Fig. 3.3-2 Fig. 3.3-3 Fig, 3.3-4 Fig. 3.3-5 Fig. 3.3-6 Fig. 3.3-7 Fig. 3.3-8 Fig. 3.4-1 Fig. 3.4-2 Fig. 3.4-3
L ist o f figures
The grid map of elevation and backscatter coefficient which forms 60 the basis of the radar echo generator
The duration of the return echo for an antenna beamwidth 0 63 The series of overlapping chirps and the the corresponding power in 65 the range window after deramp for two different ramp rates
An approach to echo simulation where the delay time variation has 66 been mapped into an equivalent firequency
The mathematical representation of the RSS 67
The scattering process represented as a series of Poisson impulses 69
The timing of the simulated echo 70
The signal in the altimeter before and after the FFT 71 The proposed method for generating the echoes at a coarser resolution 73 The mean power spectrum of a simulated echo signal 78 The inverse Fourier Transform of the mean echo 78 The inverse Fourier Transform of the mean spectrum resulting from 78 a Rayleigh-distributed amplitude in each of the resolution cells
The in phase component of the RSS baseband signal when a uniform 79 random phase is applied to the mean spectrum
Distribution of power as a function of a running average window equal 80 to 1/4 of the chirp length
The power of the simulated echo as a function of the range resolution 83
The software model of the RSS 85
The generation of the in-phase component at a coarse resolution. 87 The spectrum of a single echo at a coarser resolution 88 The mean echo spectrum at the coarser resolution after 500 pulse 88 averaging
The echoes at the 2^^ and 3^^ resolutions respectively 89 The detected echo power when the statistics of the simulated 90 spectrum are non-stationary
The noise level relative to the peak signal in the echo spectrum 91 for a number of different resolutions
The mean noise level relative to the peak signal at the 2"^ resolution 92 The generation of the in phase and quadrature channels for the RSS 95 used in the testing of the ERS-1 altimeter
The dependency of the number of resolution cells on the multiplier 95 speed and pulse repetition frequency in the RSS for the ERS-1 altimeter The two RSS designs that give suitable adaptive resolution operation 97
L ist o f figures
Fig. 3.4-4 The operation of a typical convolver 99
Fig. 3.4-5 A method of generating the baseband echo signal using parallel 100 processing
Fig. 3.4-6 A method of return signal simulation based on delaying a chirp in a 101 tapped delay line, and attenuating the signal at each tap
Table 4.1-1 Altimeter and RSS requirements 103
Table 4.1-2 Operational parameters of the altimeter 103 Fig. 4.2-1(a) Group delay compensation using two variable time delays 107 Fig. 4.2-1(b) Group delay compensation using six fixed time delays 107 Fig. 4.2-2 Regenerating the characteristics of the transmit chirp 109 Fig. 4.2-3 The simulated echo in both the time and frequency domains 110 Fig. 4.2-4 The sensitivity of the echo timing to a misalignment between the 111
baseband echo and the RSS chirp
Fig. 4.3-1 A block diagram of the Return Signal simulator 114 Fig. 4.3-2 A block diagram of the digital chirp generator 115 Fig. 4.3-3 A block diagram of memory and control unit 117 Fig. 4.3-4 A block diagram of the frequency synthesiser 118 Fig. 4.3-5 A block diagram of the FIAR upconversion unit 119 Fig. 4.3-6 The response of a phase detector when both inputs are sinusoids 121 Fig. 4.3-7 The chirp distortion resulting from the upconversion unit 121 Fig. 4.3-8 The stopband requirements of the anti-alias filters 123
Fig. 4.3-9 A block diagram of the RF front end 124
Fig. 4.3-10 A block diagram of the interface to the altimeter breadboard 125 and to the digital chirp generator
Fig. 4.3-11 A photograph of the RSS 126
Fig. 4.4-1 The pre-distortion function required to compensate for the insertion 128 loss of the filter and the frequency response of the D ACs
Fig. 4.4-2 The height error characteristic computed for a rectangular echo 128 waveform with and without pre-distortion
Fig. 4.4-3 The echo spectrum at the fifth resolution consists of a single range bin 130 if the echo at the finest resolution comprises 256 range bins
Fig. 4.5-1 The elevation and peak power profiles of the rolling hills and lakes 133 scenario
Table 4.5-1 Dynamic range and maximum signal power of echoes for each scenario 140 Fig. 4.5-2 The along track profiles of elevation and peak power as the altimeter 134
L ist o f figures Table 4.5-2 Fig. 4.5-3 Fig. 4.5-4 Fig. 4.5-5 Fig. 4.5-6 Fig. 4.5-7 Fig. 4.5-8 Fig. 4.5-9 Fig. 4.5-10
passes from an ice sheet to an ice shelf
The dynamic range of echoes and of the RSS signal, and the required 141 range of attenuation in the RSS for each scenario
The along track profiles of elevation and power for the sea ice scenario 135 The along track profiles of elevation and power for a cliff to ocean 135 scenario
The along track profiles of elevation and peak power of the arid 136 scenario
The along track elevation profile of the mountain scenario 136 A number of echoes taken from the ice sheet-ice shelf scenario 138 The leading edge of the echoes of figure 4.5-7 in a range window 137 consisting of 64 range bins
Some examples of echoes from the SEASAT altimeter as it tracked a 139 sloping continental ice sheet surface
The dynamic range of the echo and the dynamic range of the RSS 141 signal as a function of resolution
Fig. 5.1-1 Table 5.1-1 Fig. 5.1-2 Fig. 5.1-3(a) Fig. 5.1-3(b) Fig. 5.1-4 Fig. 5.2-1 Table 5.2-1
Fig. 5.2-2
Fig. 5.2-3(a) Fig. 5.2-3(b) Fig. 5.2-3(c)
The measurement setup of the timing measurements of the RSS 144 The phase jitter of the frequency synthesiser for uncompressed chirp 146 pulse lengths of T = 20, 100, 300 |is.
The operation of the RSS in real time for a PRF of 0.7 kHz 144 The amplitude and phase spectra used in the simulation of timing jitter 148 Variance of the power in the range window with rms phase jitter on 148 the sampling frequency of the D AC for five separate examples
The insertion loss and group delay characteristic corresponding to the 149 four resolutions for the 19.2 ms pulse length.
The power variation over the passband of the baseband channels for 150 the 102.4 and 19.2 p.s pulses after the echoes have been pre-distorted to compensate for the insertion loss of the filters and the frequency response of the DACs.
The shift in the leading edge of the distortion in the baseband channels 152 of the RSS
The shift in the position of the half power point of the leading edge of 150 the echo as a result of the distortion
The output of the SSB modulator 154
The vector summation of the signals at the RSS output 154
An example of the detected output power 154
L ist o f figures
Fig. 5.2-4(a) Measured detected power at the output of the RSS when a tone with 154 2 cycles of variation is modulated onto the chirp of length 102.4 |is
Fig. 5.2-4(b) Measured detected power at the output of the RSS when a tone with 155 8 cycles of variation is modulated onto the chirp of length 102.4 |xs
Fig. 5.2-4(c) Measured detected power at the output of the RSS when a tone with 155 64 cycles of variation is modulated onto the chirp of length 102.4 |is Fig. 5.2-5 The carrier and sideband suppression across the baseband bandwidth 156 Fig. 5.2-6 The amplitude and phase imbalance between the in-phase and 157
quadrature channels of the RSS for the first four resolutions at the 102.4 p.s pulse length
Fig. 5.2-7 The output of the RSS corresponding to a point target response 159 Fig. 5.2-8 The subharmonic of the desired output of the RSS 159 Fig. 5.3-1 The static measurement of the amplitude flatness of the chirp 161 Fig. 5.3-2(a) The detected amplitude response for the 300 |is pulse length 162 Fig. 5.3-2(b) The detected amplitude response for the 102.4 |is pulse length 162 Fig. 5.3-2(c) The detected amplitude response for the 19.2 |is pulse length 163 Fig. 5.5-1 (a) The height error characteristic for selected echo waveforms 165
from the sea ice scenario
Fig. 5.5-1(b) The height error characteristic for selected echo waveforms 165 from the rolling hills scenario
Fig. 5.2-2 The height error characteristic of the MFT algorithm for a sloping 167 noise floor.
A typical profile of the amplitude and phase distortion of an FM chirp 170 The phase distortion manifested as an equivalent modulation 172 of the point target response by sets of paired echoes
The effective shift in the power from the plateau region of the echo 172 to the earlier range bins.
Results of a simulation showing the shifts in the response of each 178 <l)i(co) as a function of (|)^.
The percentage change in slope of the leading edge as a function of 179 the phase distortion coefficients
An example of sinusoidal phase distortion, with a superimposed 181 curve-fitted 5* order polynomial
An example of an anti-symmetric phase error, and a curve-fitted 182 5* order polynomial
The impulse response of the altimeter when the amplitude profile of 184 chirp is defined by Ad(t) = 1 + a2t^
21 Fig. 6.1-1
Fig. 6.1-2
Fig. 6.1-3
Fig. 6.2-1
Fig. 6.2-2
Fig. 6.2-3
Fig. 6.2-4
L ist offyures
Fig. 6.3-2 The shift of the echo in the range window as a function of the first 185 two amplitude distortion coefficients
Fig. 6.3-3 The results of a computer simulation showing the change in slope 186 of the response as the coefficients aj and a2 are varied in turn
Fig. 6.3-4 The effect of a Hanning weighting function on the height bias vs. 187 phase distortion coefficient
Fig. A.3-1 The programming of the chirp generator 216
Fig. A.3-2 Modification of the chirp generator programming to include a 218 compensation for the group delay variation
Fig. A .4-1 A circuit diagram of the mother board of the memory and control unit 220 Fig. A.4-2 A circuit diagram of the daughter board of the memory and control unit 221 Fig. A.4-3 The block diagram of the logic and timing circuitry for the DRAMs 222 Fig. A.4-4 The stmcture of the DRAMs for both I and Q channels 222 Fig. A.4-5 The timing diagram for the transfer of data to and from the DRAMs 223
Fig. A.4-6 A block diagram of the RF front end 224
Fig. A.4-7 A diagram of the level shifter and gain control for the baseband 225 channels
Fig. A.4-8 The block diagram of the PLL synthesiser 227 Fig. A.4-9 The circuit diagram of the PLL synthesiser 226 Fig. A .4-10 The circuit diagram of the interface to the digital chirp generator 228 Fig. A .4-11 The circuit diagram of the GPIB interface to the RSS rack system 229 Fig. A .5-1 The processing scheme for the control software as a function of the 231
pulse repetition interval
Fig. A.5-2 A flow chart of the real time simulation routine 232 Fig. A.5-3 A flow chart of the sub-program synthesise_echo 233
Fig. A.5-4 A flow chart of the main program 234
Fig. A .6-1 The height error characteristic of the OCOG algorithm for different 237 signal to noise ratios
Fig. A .7-1 The proposed gain acquisition phase for the ATTA 242 Fig. A .9-1 The phase locked loop used in the upconversion unit, and a 244
conventional PLL
Fig. A. 10-1 The height bias as a function of the parameter bj. 248 Table A. 10-1 Slopes of the characteristic of the first 8 distortion coefficients 248
Cftapter 1
Introduction
Satellite-bome radar altimeters have been developed over the past few decades to make high-precision measurements of ocean surface elevation, as well as of waves, wind and swell. The precision achievable in height measurement is of the order of a few centimetres - a remarkable achievement from an altitude of several hundred kilometres.
Altimeters have also given limited coverage of non-ocean surfaces, permitting for example topographic maps of the Greenland and Antarctic ice sheets to be derived (Zwally et al., 1983). Such maps are of interest because they should permit estimation of changes in ice sheet mass balance, which are believed to be a sensitive indicator of the onset of climate change (Manabe and Stouffer, 1980). Other examples of the use of non-ocean altimeter data include studies of wetlands, lake levels and deserts (Rapley et al., 1987). However, since present altimeter designs have been designed principally fur operation over oceans, their performance over non-ocean surfaces has generally not been optimum. Presently, there are many studies investigating more suitable instrumentation and measurement methods for topographic mapping (Rapley et al., 1990).
For all spaceborne instruments, thorough pre-launch testing and characterisation is essential. Such testing should ensure that the instrument meets its performance specification in engineering terms, as well as demonstrating proper extraction of geophysical parameters from the instrument data. The subject o f this thesis is the pre launch testing and simulation of advanced radar altimeter systems, and specifically of an altimeter with a capability of mapping topographic terrain.
1.1 HISTORICAL PERSPECTIVE
Satellite altimetry was proposed in 1966 as a means of refining the marine geoid. The Geodetic Satellite Office of NASA funded the resulting research programme into applicable measuring systems, which included a radar altimeter. The oceanographic community independently emphasised the importance of altimetry in measuring dynamics of the ocean surface. In 1969, a seminal meeting was convened at Williamstown,
An introduction to cdtimetry
Massachusetts, to study the application of space techniques to the terrestrial environment, and to determine the scientific value of such techniques. The study (Kuala, 1969) concluded that satellite altimetry could provide the measurement accuracies required by both the geodetic and oceanographic communities. The 1972 Earth and Ocean Physics Applications Program (EOPAP) subsequently called for the development of a 10-cm- accurate radar altimeter as one of the principal sensors to be carried by a remote sensing satellite.
The first NASA radar altimeter experiment was the S-193, deployed aboard the manned SKYLAB satellite in 1973. Its objective was to determine the feasibility of measuring the marine geoid, ocean wave height and wind speed (McGoogan et al., 1974). The altimeter demonstrated a height measurement precision o f 1 m. More importantly, however, the altimeter provided a wealth of experimental data for the design of future satellite radar altimeters. The radar altimeter carried by the GEOS-C spacecraft, launched in April 1975, gave global coverage of the oceans, and achieved a height precision of about 60 cm, giving enhanced detail of the geoid over most of the ocean areas (Stanley, 1979).The next in the series, the SEASAT-A altimeter, was designed for a height precision of better than 10 cm (MacArthur, 1976). In order to bridge the gap between the performance of GEOS- C altimeter and the goals of the SE AS AT-A altimeter, an airborne altimeter, the Advanced Applications Flights Experiment (AAFE), was commissioned to collect ground truth measurements in support of the SEASAT-A calibration and validation activities. The SEASAT satellite was launched in June 1978; the altimeter achieved the 10 cm height precision goal, and the data allowed considerable refinement of the marine geoid (Brown et al., 1983; Rapp, 1983). The success was short-lived, however, as a power supply fault terminated the operation of the satellite in October of the same year, but not before the mission had yielded a large amount of high quality data. In 1986 the GEOS AT-A satellite was launched, carrying an improved version o f the SEASAT-A altimeter. The improvements included a longer-life, lower-power travelling wave tube amplifier for the transmitter, a longer uncompressed pulse length, and a lower receiver noise figure. The GEOSAT altimeter measurements helped to establish a global grid of high precision measurements (3.5 cm), that were used to further refine the geoid.
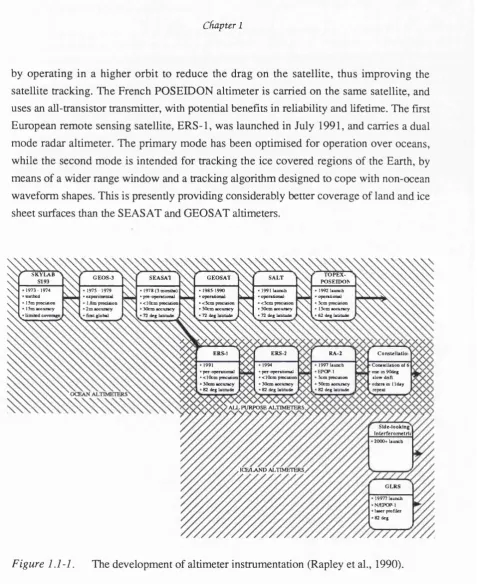
The present generation of satellite altimeters are very similar to those carried by SEASAT and GEOSAT, but include a number of further developments. A chart showing the development of altimetry is presented in figure 1.1-1. The TOPEX altimeter, launched in 1994, is designed to achieve a greater height precision using a higher pulse repetition frequency, a dual frequency implementation to provide a better ionospheric correction, and
C fiapU r 1
by operating in a higher orbit to reduce the drag on the satellite, thus improving the satellite tracking. The French POSEIDON altimeter is carried on the same satellite, and uses an all-transistor transmitter, with potential benefits in reliability and lifetime. The first European remote sensing satellite, ERS-1, was launched in July 1991, and carries a dual mode radar altimeter. The primary mode has been optimised for operation over oceans, while the second mode is intended for tracking the ice covered regions of the Earth, by means of a wider range window and a tracking algorithm designed to cope with non-ocean waveform shapes. This is presently providing considerably better coverage of land and ice sheet surfaces than the SEASAT and GEOSAT altimeters.
SKYLAB
TOPEX-G EOS-3 SEA SAl GEOSAT SALT
POSEIDON 1973- 1974
loifaed 15m precùion ISm accuncy
1975 - 1979 expenmenul l.Sm precuion
Gmt global
1978 (3 monlfaa) pre-openiiontl <10cmpmcimon 30cm accuracy 72 deg Ubtiide
1985-1990 opennoiial <5cm piecuion 5 0cm icciincy 72 deg latitude
19911autKh openttonel <5cmpfecKion 50cm accuracy 72 deg latitude
1992 launch opeianonal 3cm pieciaion 15cm accuracy 62 deg Latitude
ERS-l ERS-2 RA-2 ConsUllatloi
1991 per operational < 10cm pieciaion 30cm accuracy 82 deg labntde
1994 per opcrauonal < 10cm pieciaion 30cm accuracy 82 deg laUQide
1997 launch EPOP 1 3cm pieciaion 50cm accuracy 82 deg latitude
Conaiellation of 6 one in90deg alow diift othera in 1 Iday
ALL PURPOSE ALTIMETERS
Side-looking Interferom elrlt 2000+ launch
IΠ/LA N D ALTIMETERS
GLRS
19977 launch N/EPOP 1 laaer profiler 82 deg
Figure 1.1-1. The development of altimeter instrumentation (Rapley et al., 1990).
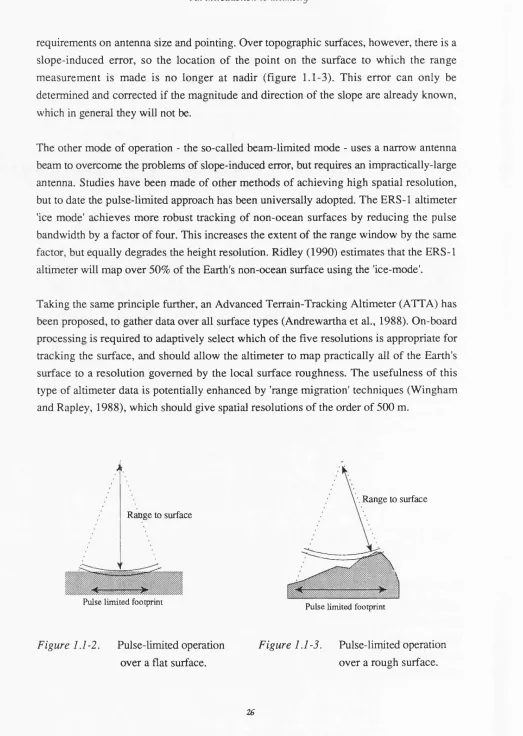
Several studies have concluded that the conventional 'Seasat-like' altimeter is not optimum for topographic mapping (Rapley et al., 1985; Griffiths et al., 1985). This type of altimeter operates in the pulse limited mode (figure 1.1-2), with a relatively broad antenna beam and a short transmit pulse, and results in a pulse limited footprint rather smaller than the overall antenna footprint. The pulse-limited footprint is localised at nadir over a horizontal surface, thus the use of a broad antenna beam relaxes otherwise severe
An introduction to cdtimetry
requirements on antenna size and pointing. Over topographic surfaces, however, there is a slope-induced error, so the location of the point on the surface to which the range measurement is made is no longer at nadir (figure 1.1-3). This error can only be determined and corrected if the magnitude and direction of the slope are already known, which in general they will not be.
The other mode of operation - the so-called beam-limited mode - uses a narrow antenna beam to overcome the problems of slope-induced error, but requires an impractically-large antenna. Studies have been made of other methods of achieving high spatial resolution, but to date the pulse-limited approach has been universally adopted. The ERS-1 altimeter 'ice mode' achieves more robust tracking of non-ocean surfaces by reducing the pulse bandwidth by a factor of four. This increases the extent of the range window by the same factor, but equally degrades the height resolution. Ridley (1990) estimates that the ERS-1 altimeter will map over 50% of the Earth's non-ocean surface using the 'ice-mode'.
Taking the same principle further, an Advanced Terrain-Tracking Altimeter (ATTA) has been proposed, to gather data over all surface types (Andrewartha et al., 1988). On-board processing is required to adaptively select which of the five resolutions is appropriate for tracking the surface, and should allow the altimeter to map practically all of the Earth's surface to a resolution governed by the local surface roughness. The usefulness of this type of altimeter data is potentially enhanced by 'range migration' techniques (Wingham and Rapley, 1988), which should give spatial resolutions of the order of 500 m.
Range to surface
Pulse limned footprint
Range to surface
Pulse limited footprint
Figure 1.1-2. Pulse-limited operation Figure 1.1-3. Pulse-limited operation
over a flat surface. over a rough surface.
c h a p te r 1
A recent consultative meeting, organised by the European Space Agency, attempted to define the scientific requirements for future radar altimeters (Rapley et al, 1990), and examined some novel radar altimeter concepts as a means of fulfilling these requirements. The meeting considered instruments with improved range and spatial resolution, and techniques for increased spatial and temporal sampling frequency. One idea that aroused strong interest is that of a 'constellation' of small, dedicated, cheap altimeters (Chase and Mundt, 1989), and research is currently being undertaken by a number of institutions into the feasibility of this idea.
Laser altimetry, initially limited by the short lifetime and non-robusmess of the laser, is slowly becoming a feasible alternative to microwave altimetry. NASA are developing the Geodynamic Laser Ranging System (GLRS) as one o f the instruments residing on the Earth Observing System (Eos), a platform in a polar orbit at a height of 705 km. The GLRS is a combination of laser ranger and altimeter, and will be used for the precise measurement of the distance between strategically placed ground-based retro-reflectors, as well as the measurement of altimetric height dynamics (Dallas et al., 1991). If successfully developed and deployed, the GLRS will provide profile data of the Earth to a spatial resolution of 100 m and a height resolution of 1 m.
1.2 ERRORS IN ALTIMETER HEIGHT MEASUREMENT
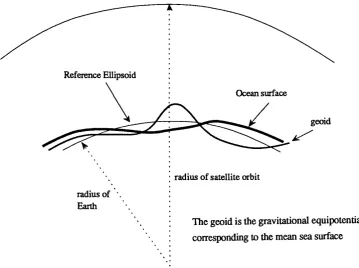
Over the ocean, the altimeter measures the two-way propagation delay between the satellite orbit and the sea surface topography (see figure 1.2-1). The time variability of the sea surface topography can be averaged from repeat orbits. The mean sea surface then approximates to the geoid, except in regions o f strong ocean currents and other quasi permanent phenomena. The satellite orbit is not a useful datum with which to reference the geoid and sea surface topography; orbit errors occur due to perturbations in the Earth's gravity field and due to atmospheric drag on the satellite, and deviations can be as large as 10 km from the desired elliptical orbit. It is thus more appropriate to define the reference ellipsoid of the Earth, defined by the equatorial and polar radii of the Earth, as the reference for all measurements.
There are three major error components in the measured height. Firstly, there are errors in defining the satellite orbit with respect to the reference ellipsoid; secondly there are delays in the propagation of the pulse through the ionosphere and troposphere; and thirdly, there are errors associated with the instrument. The satellite orbit error can be reduced to less
!A.n introduction to aCtimetry
than 100 cm using a suitable geopotential model of the Earth, aided by precise laser tracking of the satellite as it passes close to ground stations (Robinson, 1985). Propagation delays in the ionosphere and troposphere are also critical in determining the absolute accuracy of the height measurement, and they arise as a result of the difference in the value of the refractive index between these media and a vacuum. A number of models exist (Lorrell et al., 1982; Goldhirsh and Rowland, 1982) to account for these effects; however the residual error is nonetheless o f the order of 3 cm for both the troposphere and the ionosphere.
Instrument errors determine the precision of the height measurement, and currently the achievable precision is about 10 cm. It is now possible to reduce the impact of the instrument error on the total error budget to the point where oceanographic effects such as geostrophic surface slopes as small as 1 in 10^ (Challenor and Srokosz, 1990) can be observed.
Reference Ellipsoid
Ocean surface
geoid
radius of satellite orbit radius of
Earth
The geoid is the gravitational equipotential
corresponding to the mean sea surface
Figure 12-1. The geometry of the satellite measurement. The satellite orbit is tracked
by ground stations that are referenced to the reference ellipsoid of the Earth. The altimeter makes a measurement from the satellite position in the orbit to the mean sea level. The geoid is also shown.
CflttptCT 1
1.3 AIM OF THE RESEARCH
The overall objective of this research is to develop various methods of testing and analysis of the altimeter instrument. To date, most of the interest in radar altimetry has focussed on the returns from ocean surfaces, and researchers have been refining the models for the ocean return to include small geophysical perturbations. Two areas that have not received much interest are researched in this thesis, and these are:
a method of testing the Adaptive Terrain-Tracking Altimeter prior to launch, and an analysis of the effect of instrument errors on the ocean return
Many methods of testing, including a return signal simulator, exist for ordinary uni-modal altimeters. The ATTA, however, requires a method of testing that will exercise the on board resolution switching algorithm, and the tracking algorithms for terrain, which are different from the algorithms used for ocean surfaces. A return signal simulator that has an adaptive capability, and thus can change the resolution of the simulated echo easily, is the best means of testing the ATTA prior to launch. The development of an RSS that can provide the correct resolution echo is thus a major component of the work described in this thesis. The RSS then becomes the tool with which most of the pre-launch testing can be accomplished.
The second area covered in this thesis is an analysis of the effect of one of the instrument errors on the ocean return. Transmit and deramp chirp errors affect the measurement of height and significant waveheight made by the altimeter. The effect has been analysed by Brooks and Dooley (1975), Somma et al. (1981) and Francis (1982). However each approach requires numerous approximations, and all give different results. Thus it is difficult to be confident about the effect of chirp errors on the geophysical measurement. This thesis outlines the areas where these methods are lacking, and presents an alternative approach that is directly apphcable to radar altimetry.
1.4 THESIS LAYOUT
An investigation of various methods of testing the Adaptive Tqtrain-Tracking Altimeter is carried out in chapter 2. A description of the altimeter is presented, and a comprehensive testing scheme is proposed. The distinction and connection between pre-launch and post launch testing and cahbration is made. The merits of Return Signal Simulation are outlined and the feasibility of using a Return Signal Simulator for calibration is discussed.
An introduction to cdtimetry
Chapter 3 discusses the simulation of altimeter echoes in considerable detail, and presents a very effective model for the return signal in a simple form. A novel method of changing the resolution of the simulated echo is then presented, and the results of a computer simulation are used to verify this method and many other ideas. The chapter finally considers some of the conventional methods of Return Signal Simulation, and underlines their unsuitability for adaptive testing.
Chapter 4 describes a prototype return signal simulator that was built specifically to test an adaptive terrain-tracking altimeter. An outline of the design requirements is presented, and a top-down design approach is presented. The hardware design is described briefly with more emphasis placed on the practical limitations of the simulator, and how these can be overcome. The realism of the simulated echoes is also discussed, and the implication of the sequence length on the simulation is discussed.
In chapter 5, the performance o f the prototype RSS is analysed with respect to its capability of testing the advanced altimeter. A detailed analysis of the timing precision of the simulated echo is carried out. The analysis concludes that the RSS is capable of providing the timing stability for echo simulation. The dynamic range of a single echo and the range bin flamess are also measured, and the implication of the measurements on the simulation are analysed. Measurements of the RSS chirp are made, and the results are interpreted in the context of (a) how they affect the altimeter measurement and (b) the feasibility of this novel method of chirp generation. Finally, the chapter considers how the RSS can be used to test the advanced altimeter. Unfortunately, the prototype altimeter was not ready to be tested, and as a result a test philosophy is outlined. However a comparison of the performance of two different tracking algorithms using a number of the simulated echoes is performed at the end of the chapter.
In chapter 6 the effect of chirp phase and amplitude distortion is considered. The current
approach, although not incorrect, is critically examined and found to be only useful for setting a specification on sidelobe level of an instrument point target response. However, in the context of corrections to the altimetric height measurement, it does not prove to be a useful method. An alternative method of analysis that is directly applicable to radar altimetry, and which does provide a correction factor, is presented.
In chapter 7, a summary of the work is presented, and the main achievements are outlined. An investigation of the altimeter performance using the RSS will be carried out by British Aerospace in the short term, and a suitable test philosophy is described. Although the research is specific to satellite pulse-limited altimeter, some other potential applications are suggested. Finally, the chapter lists the conclusions that have resulted from the research.
CfuipterZ
Pre-Launch Testing of Altimeters
2.1 D ESC R IPTIO N O F T H E ADVANCED A L T IM E T E R
The basic principle of operation of present-generation geophysical radar altimeters is that
o ifu ll deramp y illustrated in figure 2.1-1. A linear frequency-modulated pulse, or chirp,
is transmitted towards the surface, and is returned to the altimeter after reflection from the facets that comprise the surface. On reception, the surface echo is mixed with a replica of the transmit chirp in a process known as deramping, mapping the range of each target into a corresponding frequency. The range information is therefore derived by performing a spectral analysis, using an FFT or digital filter. The resolution in the frequency domain is lA', and the corresponding delay time resolution is:
where b is the rate of change of frequency modulation of the chirp:
b = ^ = & (2.1-2 )
The FFT output forms a range window of extent:
The processing gain BT in eqn. 2.1-1 also constitutes the improvement in resolution of full deramp over a radar with an unmodulated pulse of the same duration.
Since the range resolution is inversely proportional to the chirp bandwidth, it is possible to change the range resolution simply by changing the chirp bandwidth, and all the sampling, filtering and baseband processing remain unchanged. This is the principle by which the ATTA is capable of reducing its range resolution over rougher surfaces. Over rough surfaces with greater range variability, the altimeter is able to maintain the radar echo within its range window more easily, giving more robust tracking of the echo.
'Pre-Cauncd testing o f altimeters
Another advantage of reducing the resolution under such circumstances is the increase in the area of the pulse-limited footprint, which increases the signal-to-noise ratio of the echo. The upper limit to this improvement occurs when the return changes from being pulse-limited to beam-limited (see figure 2 ,1-2).
The altimeter tracks a surface by estimating the position of the leading edge of the echo, and controlling the instant at which the deramp chirp is triggered so as to maintain the leading edge of the echo in the centre of the range window. A block diagram of the ATTA is shown in figure 2.1-3. A fine height adjustment may be provided by means of a ’phase rotation’ in the FFT coefficients. The height error is computed from an estimation or tracking algorithm. To avoid potential mistracking, the height error should be linearly proportional to the displacement of the echo from the centre of the range window, over the full extent of the range window, and should be independent of the shape of the echo (figure 2.1-4). The height error is filtered in a tracking loop before being used to update the instant at which the deramp chirp is triggered. The loop bandwidth is a compromise between tracking agility and reduction of height noise.
Proper estimation of the position of the echo leading edge depends on the model adopted for the echo shape. Picardi (Somma et al., 1982) developed the Sub-optimal Maximum Likelihood Estimation algorithm for the ERS-1 altimeter, to fit a simplified version of the Brown model of the ocean surface echo (Brown, 1977) to the waveform in the range window. This subsequently allows the three geophysical parameters - height, significant waveheight and backscatter coefficient - to be derived j&om the measured time delay, slope of leading edge and AGC value (signal strength) respectively.
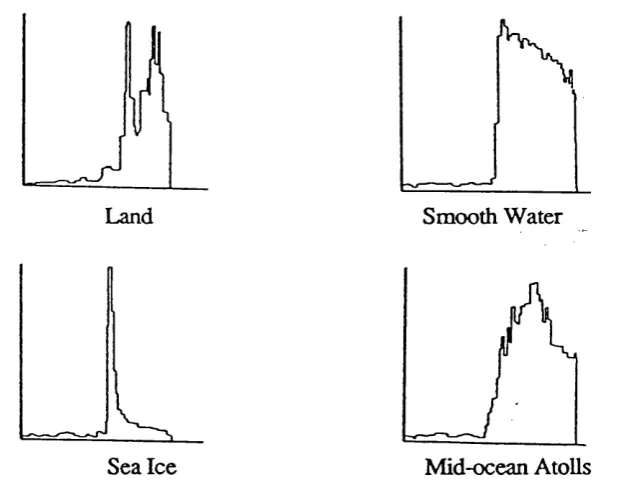
Over non-ocean surface types it is difficult to fit a model to the return because of the diversity and rapid variation in the shape of surface echoes, as shown in figure 2.1-5. A common approach is to fit a model which is independent of the surface echo shape. An algorithm developed for the ERS-1 altimeter is the Offset Centre O f Gravity (OCOG) algorithm (Wingham, 1986). This estimates the position of the leading edge of the echo by first computing the position of centre of gravity of the echo, and then offsetting the track point by half the echo width (figure 2.1-6 and appendix A.6). Another algorithm based on
the same principle is the Model Free Tracker (Levrini, 1990) which is claimed to have a superior performance.
ChaptcTZ
j. frequency
transmit
pulse Each range bin is
equivalent to a range — echo
LO or deramp chirp
deramped echo
time FT and
squaring
range window (N prange bins)
Figure 2.1-1. The full-deramp principle of operation of a radar altimeter. The spectral
components of the baseband signal contain the timing of the echo.
h + c r
Antenna beamwidth Antenna
beamwidth
Beam -lim ited footprint
S/N
Beam-limited mode of operation
/ Pulse-limited mode of operation
compresssed pulse length t
Figure 2.1-2. The pulse and beam-limited geometry of the satellite altimeter. The return
becomes progressively more beam-limited, as the lamp rate is reduced.
‘Pre-Cauncft testing of altimeters
The ATTA has an additional on-board algorithm to determine which chirp rate is appropriate for tracking the surface (Griffiths et al., 1987). It will reduce the chirp rate when the echo has drifted a certain distance from the centre of the range window (illustrated by the 'window switch' block in figure 2.1-3). Conversely, a similar criterion is applied to close the range window when appropriate, so that the echo is always tracked at the finest resolution consistent with maintaining track. An example of this principle is shown in figure 2.1-7.
IF Amp.
Chirp generator
Range window
coarse height adjustment
fine height
adjustment AGC tracking loot trigger
instant AGC
switch
Height height
tracking loot
switch
mode switch
m m m
window switch
Figure 2.1 -3. A block diagram of the Adaptive Terrain-Tracking Altimeter. The choice of
tracking algorithm ( SMLE or OCOG) is determined by the pulse shape. The window switch algorithm controls the bandwidth of the chirp (i.e. resolution of altimeter). The tracking loop smooths the height estimate. The most significant bits of the height word are used to position the deramp chirp and the least significant bits provide a fine adjustment at the FFT.
leading edge o f echo
ix)wer
height error
-64
Chapter 2
Ideal height error characteristic
TypicjI height error ■
power
displace nent
•haracteristic
-64 displacement (bins) 64
Figure 2.1-4. The ideal (linear with unity slope) and typical characteristic of the height
error algorithm. The leading edge o f the left hand echo is displaced from the centre of the range window. A height error is computed and is used to reposition the echo back to the centre of the range window.
Land Smooth Water
Sea Ice Mid-ocean Atolls
Figure 2.1-5. An example of four common types o f radar altimeter echo (after Vass and
Handoll, 1991).The echoes represent returns from land, smooth water, sea ice and mid-ocean atolls. The power o f the echoes is plotted as a function of delay time.
Tre-CauncH testing o f aftimeters
displacement of leading edge from centre of range window
W
assumed echo shape
COG
Position of the leading edge
GOG
p
w
^ooG“ y
Figure 2.1-6, Approximating the position of the leading edge of the echo using a centre
of gravity tracking algorithm. The position of the centre of gravity (COG) is first computed, and then offset by half the echo width.
Adaptive-mode
-rr^ieé tracking point drifting to the right Track has been lost
tracking point drifting to the left
Adaptive-mode
/
Figure 2.1-7. An example of the tracking point being lost, and the resulting switch to a
coarser resolution in order to maintain track of the echo.
chapter 2
2.2 ALTIMETER TESTING
A suggested testing scheme for an altimeter is shown in figure 2.2-1. It is an 'end-to-end' scheme, and indicates the phases of testing and calibration necessary to produce useful geophysical data products.
The instrument design of ocean-dedicated altimeters is well established. The design of terrain-tracking altimeters is still at an early stage. In this regard, it is hoped that the ERS-1 altimeter will provide useful tracking information from its operation over the ice covered regions. Return signal simulation over simulated terrain is therefore necessary to confirm the feasibility of an instrument design and its tracking software. Levrini et al. (1990) have analysed the performance of a number of tracking algorithms using a software implementation of a return signal simulator and a terrain-tracking altimeter with adaptive resolution. This phase of testing is indicated by the oval box in the top right-hand comer of figure 2.2-1. A hardware implementation of a return signal simulator, on the other hand, will reveal a lot more information on the tme performance of the prototype altimeter.
A number of instrument design changes were incorporated into the prototype ATTA, manufactured by British Aerospace (BAe). The SAW chirp expander has been replaced by a digital chirp generator, in order to obtain higher bandwidths, and more stability in the instant at which the chirp is triggered. The second major change is in the number of range bins that define the range window, which has been doubled to 128. A faster waveform processor has also been included to speed up the accumulation of echoes in the range window.
The latter phases of the testing scheme in figure 2.2-1 constitute the calibration of the instrument and subsequent corrections to the data product. Calibration is defined by Francis (1982) as 'the means by which the instrument measurements can be mapped into
physical quantities, related to known standards'. Overall calibration is considered in
terms of engineering calibration and geophysical calibration. The former is a calibration of the altimeter raw data, and calibrates the measured time delay, and signal strength. The latter is a calibration of the data product. Calibration is performed after the launch, and the resulting corrections are applied to the altimeter raw data during ground processing of the radar echoes. A check that the data lies between acceptable limits and the resulting flagging of anomalous data is carried out on the ground, ensuring that the data product is validated.
Engineering calibration can be viewed in three different forms. Firstly, the engineering components of the altimeter are calibrated pre-launch. Secondly, an internal calibration of
Tre-Cauncfi testing qfaCtimeters
Scientific communities Geodisists, oceanognpheis,..
Skylab
Geos-C, Seaiat & Geosat
Return Signal Simulation & Analysis of Seasat land data ERS-1 operation overland
User requirements over the ocean
Previous mission information Preliminary user requirements Instrument design Prototype Functional testing Verification and final testing Tradcer models: SMLE, OCOG& mode switching
Model tuning Return Sigrud
Simulation Independent measurements before launch Instruments co-located with satellite Internal
Calibration Look up tables
Direct estemal Calibration Laundi Ground Truth lvalues External calibration Commissionini altimeter raw data Normal operation Atmospheric corrections calibration drsa Internal in-orbit calibration Telemetry Geophysical calibration
^ D a ta Product ^
Figure 22-1. An overview of the calibration and testing envisaged for the Adaptive
Terrain-Tracking Altimeter. This scheme illustrates the connection between the various pre-launch and post-launch calibration activities.
C fuLpterZ
the engineering parameters is performed regularly during the operation of the altimeter (Francis et al., 1982). This results in corrections that are required to compensate for time- varying, and thermal-varying effects. Finally, an external calibration is performed during the commissioning of the altimeter to compare the altimeter-derived measurements with independently derived measurements. It includes all the engineering parameters, and is thus an absolute calibration (Francis and Duesmann, 1988). Many of the ERS-1 techniques discussed in §2.3 and §2.4 are directly applicable to the ATTA. As a result, only a brief critical assessment of these methods will be given at the end of this chapter.
Return Signal Simulation is also performed on the flight model in order to optimise the models used for estimating and tracking the echo waveforms, and to determine a realistic measure of the expected performance of the altimeter. The results of the return signal simulation then become a useful yardstick for analysing the in-flight performance of the altimeter, as it was for the SEASAT altimeter (Townsend, 1980). Over non-ocean surfaces, the user requirements are not as well defined as for ocean surfaces, and as a result the resolution switching algorithm, the tracking algorithms and the tracking time constants required for terrain tracking need to verified and optimised. Thus the return signal simulator is an essential element of pre-launch testing for the adaptive terrain- tracking altimeter.
2.2.1 Ocean Return Signal Simulators
A Return Signal Simulator is a device that returns an RF pulse, modulated by the realistic characteristics of the surface echo, in response to the transmit chirp trigger of the altimeter. This signal is delayed by the round trip propagation delay between the altimeter and the simulated surface, and should correctly represent information such as the echo shape, surface roughness, backscatter coefficient and statistical fading observed on a pulse-by pulse basis. A complete description of how these are modelled is presented in chapter 3.
Ocean return simulators have been used to characterise the SEASAT and ERS-1 altimeters. In each case, the RSS was able to measure the height precision, significant waveheight and backscatter coefficient precision of the altimeter. Figure 2.2-2 shows the measured and ideal height noise vs waveheight characteristic for a simulated ocean return using the RSS for the SEASAT altimeter. The difference in the curves indicated an additional noise contribution in the altimeter, either due to noise in the altimeter or noise passed to it from the RSS. Mac Arthur (1978) stated that the absence of an independent