Prevalence and Correlates of High-Quality Basic Pediatric
Preventive Care
Barry Zuckerman, MD*; Gregory D. Stevens, PhD‡; Moira Inkelas, PhD§; and Neal Halfon, MD㛳
ABSTRACT. Background. The list of recommended pediatric preventive services has grown considerably in the past decade, and clinician variability, clinician distri-bution, and other correlates of provision of these basic preventive services (BPS) are not known.
Objective. To describe the proportion of high-quality basic pediatric preventive services, exclusive of immuni-zations, reported by parents and to identify sociodemo-graphic and health system predictors and health service correlates of provision of these services.
Study Design. The study used cross-sectional data on 2041 children, 4 to 35 months of age, in the 2000 National Survey of Early Childhood Health.
Outcome Measures. The BPS measure assesses the re-ceipt of (1) developmental assessment, (2) injury preven-tion counseling, (3) screening for parental smoking, (4) guidance on reading to the child, and (5) guidance on 14 other topics (assessed as a composite score). The BPS scale categorizes the receipt of services as excellent, good, fair, or poor.
Results. Most children received excellent (34.9%) or good (31.5%) care, but many received fair (24.9%) or poor (8.7%) care. Sociodemographic and health care factors such as race/ethnicity, insurance, and practice setting were not associated with BPS levels. Higher BPS scores were associated with parental reports of longer well-child visits, more counseling regarding family and com-munity risk factors, lower rates of delayed or missed care, and greater satisfaction.
Conclusions. Two thirds of children receive good or excellent basic preventive care, as determined with this composite, and no disparities according to race/ethnicity, income, or health insurance status of families (which are often found to be associated with health care access) were found. This equitable distribution of high-quality care suggests a high level of clinician professionalism. Dura-tion of visits may be a key factor to improve quality of care. Because of its association with other services, pro-cesses, and outcomes of care, the BPS scale may serve as a useful construct for monitoring quality and stimulating efforts to improve national pediatric preventive care. Pe-diatrics2004;114:1522–1529;quality of care, pediatric pri-mary care, prevention, disparities.
ABBREVIATIONS. NSECH, National Survey of Early Childhood Health; BPS, basic preventive services; PHDS, Promoting Healthy Development Survey; AAP, American Academy of Pediatrics.
P
ediatric primary care is designed to prevent disease, disabilities, and injuries and to pro-mote children’s health and well-being.1Rec-ommendations for the periodicity and content of pe-diatric well-child visits have been developed by the American Academy of Pediatrics (AAP) and Bright Futures and have increased considerably in scope in the past decade.2,3National estimates of the quality
of pediatric preventive care come largely from the Health Plan Employer Data and Information System, which includes basic indicators such as the receipt of immunizations and the number and timing of well-child visits.4–10These measures do not assess the full
range of recommended preventive services, how-ever.
Other studies assessed a broader array of pediatric preventive services and revealed deficits in some recommended preventive and health promotion ser-vices.11–15A particular challenge to pediatric
provid-ers in delivering all recommended preventive care is the large number of services to provide and topics to address. A recent study indicated that it is not feasi-ble, because of the amount of time required, to de-liver all preventive services recommended by the US Preventive Services Task Force.16 The implications
for practice are particularly compelling when it is considered that US Preventive Services Task Force recommendations for children are actually less com-prehensive than those of the AAP or Bright Futures. Although Bright Futures recommends the involve-ment of other community-based providers in the delivery of preventive care, the expectations for pe-diatric providers are still considerable. Given these time pressures, there is concern about the extent to which children receive basic preventive services (BPS) beyond immunizations and adherence to a minimal well-child visit schedule.
More comprehensive data on preventive care for young children have become available. The Promot-ing Healthy Development Survey (PHDS) and PHDS-Plus were developed by the Child and Ado-lescent Health Measurement Initiative, on the basis of reviews of evidence for each health service item, for assessment of developmental services provided to young children.17Survey items were selected for
inclusion on the basis of the prevalence of the health concern underlying the care and the available
evi-From the *Department of Pediatrics, Boston University School of Medicine/ Boston Medical Center, Boston, Massachusetts; and ‡Department of Pedi-atrics, School of Medicine, §Department of Health Services, School of Public Health, and㛳Department of Community Health Sciences, School of Public Health, University of California, Los Angeles, California.
Accepted for publication May 25, 2004. doi:10.1542/peds.2004-0635
No conflict of interest declared.
dence on the effectiveness of care for that concern provided in pediatric settings. Until recently, the PHDS had been fielded only among selected health plans and several state Medicaid programs. The 2000
National Survey of Early Childhood Health
(NSECH) builds on the PHDS studies by incorporat-ing many of the PHDS measures into a national sample, to provide nationally representative esti-mates of preventive care.
To date, few studies have evaluated the variability of parental self-reports of preventive services re-ceived by young children and their parents. This study used the NSECH to describe the prevalence and correlates of adequacy of BPS provided by clini-cians, exclusive of immunizations, for young chil-dren. A special focus was on assessing whether the quality of parent-reported provision of preventive care varied according to maternal race, household income, practice setting, or health insurance status or type.
METHODS Study Design and Sampling
This study used publicly available data from the 2000 NSECH, which was conducted by the National Center for Health Statistics. The NSECH was a cross-sectional, nationally representative sur-vey of children 4 to 35 months of age, in which parents reported on their children’s health and health care.18The NSECH
over-sampled black and Hispanic children, to improve the reliability of estimates for those groups. Structured telephone interviews were conducted, in English or Spanish, with the primary caregiver of 1 randomly selected child in each home. Respondents were mothers (87%), fathers (11%), and grandparents (2%). The Council of American Survey Research Organizations estimated the survey response rate to be 65.6%. More detailed information on the design of the NSECH is available elsewhere.19
Measures
Measures of services were adapted for NSECH from the PHDS and were originally developed from topics in AAP and Bright Futures guidelines with demonstrated effectiveness. Items in-cluded receipt of (1) a developmental assessment,20 (2) injury
prevention counseling,21–24 (3) screening for parental
smok-ing,25–30(4) guidance on reading to children,31–34and (5) guidance
on 14 other topics (expressed as a summary score).
Parents were asked whether the child’s doctors or other health care providers ever told them they were carrying out what doctors call a developmental assessment of the child. They were also asked whether the child’s doctors or other health care providers ever had him or her pick up small objects, stack blocks, throw a ball, or recognize different colors. An answer of yes to either of these questions was counted as indicating that a developmental assessment had been performed.
For injury prevention, reading, and smoking items, parents were asked whether, in the past 12 months (or since the child’s birth, for children⬍12 months of age), the child’s doctors or health care providers had talked about the injury items, the importance of reading to the child, and whether the parent or someone in the house smokes, respectively. Responses were yes or no.
For guidance on the 14 other topics, parents were asked whether, in the past 12 months (or since the child’s birth, for children⬍12 months of age), the child’s doctors or health care providers had talked about each topic. If the parents responded no, then they were asked whether a discussion of that topic would have been helpful. Respondents who did not receive the service and said that it would have been helpful were counted as having a missed opportunity.
This study examined the prevalence of BPS and the sociode-mographic and health care factors (independent variables) associ-ated with BPS (dependent variable). The study also assessed the relationship of BPS (independent variable) to other well-child care
processes and care experiences (dependent variables). Descrip-tions of the measures are as follows.
BPS Measure
A BPS scale was derived from previously used, validated, reliable measures11,17 and included selected parental reports of
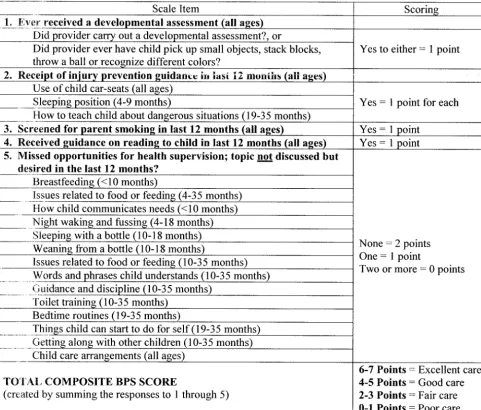
services received in the past year (or since birth, for children⬍1 year of age). Figure 1 summarizes the items that constitute the BPS measure and the scoring procedures for the scale. Scoring for items 1 through 4 was dichotomous (0 points⫽no, 1 point⫽yes). The composite measure of 14 guidance topics (item 5) was de-signed differently, for assessment of the receipt of health super-vision in relation to parental needs and preferences. This compos-ite was a count of missed opportunities, which we defined as guidance topics that were not addressed but, according to parental report, would have been helpful. Because missed opportunities were common (⬃45% of parents reportedⱖ1), a 3-point scoring system was created for this composite, with no missed opportu-nities being considered the best result (2 points ⫽ no missed opportunities, 1 point ⫽ 1 missed opportunity, 0 points ⫽ⱖ2 missed opportunities). The greater weighting of the missed op-portunities component, relative to the other 4 components of the BPS, reflects the larger number of services assessed in this com-posite item.
Total scores for the BPS measure ranged from 0 to 7 points. To summarize delivery of BPS, the scores were collapsed into 4 categories of BPS coverage, ie, excellent (6 or 7 points), good (4 or 5 points), fair (2 or 3 points), or poor (0 or 1 point). The ends of the BPS scale (excellent care and poor care) were defined a priori to distinguish children who received nearly all services (6 or 7 points) from those who received nearly none (0 or 1 point). This categorization was also based on an a priori decision that a score ofⱕ3 on the BPS scale represented inadequate or “spare” care. This BPS scale has elements of interval-level measurement but, because of our weighting scheme (eg, incorporating a composite measure of 14 topics), the scale is most appropriately used ordi-nally.
Sociodemographic and Health Care Factors
This study examined the association of family sociographic features and health care factors with BPS. Family demo-graphic variables included child age (4 –9 months, 10 –18 months, or 19 –35 months), maternal race/ethnicity and language (non-Hispanic white, black, (non-Hispanic with interview in English, or Hispanic with interview in Spanish), and maternal age (ⱕ19 years, 20 –29 years, 30 –39 years, or ⱖ40 years). Family socioeconomic status factors included maternal education (less than high school education, high school graduate, or college education or more) and annual family income (⬍$17 500, $17 501–$35 000, $35 001– $60 000, or ⱖ$60 000). Health care factors included child health insurance coverage (private, public such as Medicaid or state children’s health insurance program, other coverage, or unin-sured) and provider setting (private office, health center or public clinic, or hospital-based clinic).
Process of Well-Child Care Measures and Ratings of Health Care Experiences
This study also examined the association of BPS scale results with other health care factors and experiences of care. In particu-lar, the study assessed parental reports of (1) duration of the last well-child medical visit (in minutes), (2) receipt of family-centered care, (3) counseling regarding family and community risks to child health and development, (4) satisfaction, (5) ability to ask all questions, (6) appropriateness of time spent during the visit, and (7) receipt of needed care.
To assess counseling regarding family and community risk factors, parents reported whether, in the past 12 months, the provider had asked them about the following 6 items: use of alcohol/drugs in the household, community violence, parental health, emotional support, support of a spouse/partner in parent-ing efforts, and difficulty payparent-ing for basic needs. The 6 dichoto-mous responses were combined and transformed to a 100-point scale to reflect the proportion of the 6 items that were asked of parents.
rating was converted to a 100-point scale for similarity of presen-tation to other measures in the study. Parents also reported whether they were able to ask all of their questions, whether the provider spent enough time with them, and whether there was any time when their child needed care for a problem and did not receive it or the child received care for a problem but received the care later than the parents would have liked. Family-centered care was assessed with 4 questions. Parents were asked how often in the past 12 months the provider (1) took time to understand the specific needs of the child, (2) respected the parent as the expert on the child, (3) asked how the parent was feeling as a parent or guardian, and (4) understood the parent and family and how they preferred to raise the child. A 100-point scale was created from the 4 items on the basis of a point system for the 4 response options (always⫽100, usually⫽67, sometimes⫽33, never⫽0); higher scores reflect more family-centered care. This measure was used previously in the PHDS.17
Analyses
This study presents the prevalence, predictors, and correlates of BPS. The survey design involved stratified sampling; therefore, adjustments were made to SEs with survey procedures in Stata version 7.0 (Stata Corp, College Station, TX). For all preventive services, the small number of responses of “don’t know” (gener-ally 2–5 responses per service) were coded as “did not receive the service,” because we assumed that not knowing whether a service
was received likely indicated that the service was not received or was not effectively conveyed. Sensitivity analysis showed no im-pact on the results of treating “don’t know” responses as missing data. Individuals with missing information on BPS were excluded from the analyses, which reduced the analytic sample size to 2041. Some of the analyses used smaller sample sizes because of missing information on the predictors and correlates.
The Pearson2test was used to test the significance of
differ-ences in BPS categories according to sociodemographic and health care factors. The relationship of BPS scores to the processes and experiences with care measures was tested with either the Pearson
2test or pairwisettest. These comparisons were also conducted
with percentages and means that were adjusted for several poten-tial confounding factors (such as race/ethnicity, insurance cover-age, maternal education, and language).
RESULTS
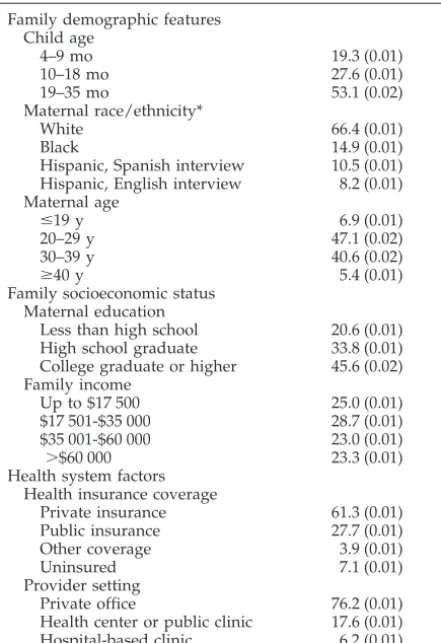
Table 1 presents the sociodemographic and health care characteristics of children 4 to 35 months of age. Most mothers (66.4%) were white, 14.9% were black, and 18.7% were Hispanic. One quarter of children were in households with incomes of⬍$17 500. Sixty-one percent of children had private insurance cover-age, similar to 64.6% noted in a national sample of
0- to 4-year-old children in 2000,3527.7% had public
insurance, and 7.1% were uninsured. Seventy-six percent of children were examined in private offices, 17.6% in health centers or public clinics, and 6.2% in hospital-based clinics.
Table 2 presents the BPS received by children and the percentages of children who received preventive care services at levels categorized as excellent, good, fair, and poor. A large percentage of parents of
young children reported being asked about smoking (75.7%), but only approximately one half of children were reported as ever having received a develop-mental assessment (56.2%). Fewer than one half of parents (45.0%) reported any missed opportunities (guidance that was not delivered but that parents reported would have been helpful). According to the BPS scale categorization, receipt of preventive ser-vices was excellent (34.9%) or good (31.5%) for most of the children, but significant proportions received fair (24.9%) or poor (8.7%) care.
Table 3 shows the relationship between sociode-mographic and health care factors and BPS. No dif-ferences in levels of BPS (excellent, good, fair, or poor) according to maternal race/ethnicity, family income, provider setting, or health insurance status were found. A separate analysis was conducted to assess whether poverty status was associated with BPS score. Similar to findings for mean family in-come, no significant differences were noted (data not shown).
Table 4 shows the relationship between BPS and process measures of well-child care quality. Better BPS levels were associated with longer well-child visits, with children who received excellent care hav-ing visits averaghav-ing 20.1 minutes, compared with 12.4 minutes for children who received poor care (P ⬍ .0001). Parents of children who received excellent care rated family-centered care 35% higher (mean: 78.3% vs 42.0%;P⬍.0001) and reported more coun-seling regarding family and community risk factors (43.9% vs 10.1%,P⬍.0001), compared with children who received poor care. Differences were also found for the individual items assessing family-centered care. For example, parents of children with excellent BPS (compared with poor BPS) more frequently re-ported that the provider took time to understand their child’s needs (93.4% vs 58.6%,P⬍ .0001).
BPS levels were also significantly associated with each of the parental ratings of health care experi-ences. Parents of children with excellent BPS were more satisfied with overall care (91.8% vs 77.7%,P⬍ .0001) and more frequently reported that they were able to ask all of their questions (98.3% vs 81.1%,P⬍ .0001), compared with children with poor BPS. Of those with excellent BPS, 95.7% reported that the provider spent the right amount of time with them, compared with 61.4% of those with poor BPS (P ⬍ .0001). Finally, those who received poor care (com-pared with excellent care) were almost twice as likely to report experiencing delays in receiving needed care (14.1% vs 8.3%,P⬍.01) and were 4 times more likely to report missing needed care (10.0% vs 2.4%, P⬍.001), compared with those who received excel-lent care.
To ensure that we did not overlook important differences because of the relatively small number of children who received poor care, we combined chil-dren with poor or fair care into a single category and those with excellent or good care into another cate-gory and then we reanalyzed the data. This com-bined variable did not alter any of the relationships presented in Table 3. We also assessed the impact of
TABLE 1. Population Characteristics (N⫽2068) Population Characteristics Proportion, % (SE)
Family demographic features Child age
4–9 mo 19.3 (0.01)
10–18 mo 27.6 (0.01)
19–35 mo 53.1 (0.02)
Maternal race/ethnicity*
White 66.4 (0.01)
Black 14.9 (0.01)
Hispanic, Spanish interview 10.5 (0.01) Hispanic, English interview 8.2 (0.01) Maternal age
ⱕ19 y 6.9 (0.01)
20–29 y 47.1 (0.02)
30–39 y 40.6 (0.02)
ⱖ40 y 5.4 (0.01)
Family socioeconomic status Maternal education
Less than high school 20.6 (0.01) High school graduate 33.8 (0.01) College graduate or higher 45.6 (0.02) Family income
Up to $17 500 25.0 (0.01)
$17 501-$35 000 28.7 (0.01)
$35 001-$60 000 23.0 (0.01)
⬎$60 000 23.3 (0.01)
Health system factors Health insurance coverage
Private insurance 61.3 (0.01)
Public insurance 27.7 (0.01)
Other coverage 3.9 (0.01)
Uninsured 7.1 (0.01)
Provider setting
Private office 76.2 (0.01)
Health center or public clinic 17.6 (0.01) Hospital-based clinic 6.2 (0.01)
* Excludes “other” race/ethnicity.
TABLE 2. Prevalence and Component Items for BPS (N ⫽
2041)
BPS Proportion, % (SE)
BPS scale
Excellent (6–7 points) 34.9 (0.01)
Good (4–5 points) 31.5 (0.01)
Fair (2–3 points) 24.9 (0.01)
Poor (0–1 points) 8.7 (0.01)
Items in composite
Received developmental assessment 56.2 (0.02) Received injury prevention guidance
Car seats (all ages) 57.2 (0.02) Sleeping position (⬍10 mo) 89.2 (0.02) Dangerous situations (19–35 mo) 52.8 (0.02) Was asked about smoking 75.7 (0.01) Discussed reading to the child 61.6 (0.02) Missed opportunities
0 55.0 (0.02)
1 18.8 (0.01)
assigning the missed opportunities component a slightly greater weight in the scale, because of the large number of items included in this domain and to distinguish among levels of care in this domain (be-cause⬃75% of parents hadⱖ1 missed opportunity). Equalizing the weighting between missed opportu-nities and the other items in the scale resulted in an overall distribution shift toward poorer care, but no changes in the relationships reported in this study were noted (data not shown). Finally, for Table 4, we repeated the analyses with means and percentages that were adjusted for confounding factors (race/ ethnicity, insurance coverage, maternal education, and interview language), and none of the relation-ships changed significantly (data not shown).
DISCUSSION
This study is one of the first to describe compre-hensively the prevalence and correlates of quality of preventive services provided by clinicians, exclusive of immunizations, for young children. Although the majority of children received excellent or good levels of BPS from their clinicians, significant proportions received fair or poor care. No disparities in overall preventive care levels according to race/ethnicity, income, or children’s health insurance status (which are patient characteristics often associated with health care access) were found. The equitable distri-bution of good to excellent care among child health care providers for young children is consistent with 2 of 3 fundamental principles of professionalism, ie,
TABLE 3. Association Between BPS Levels and Select Demographic Features, Socioeconomic Status, and Health Care Factors (N⫽
2041)
Population Characteristics Proportion, % (SE)
Excellent BPS Good BPS Fair BPS Poor BPS
Family demographic features Maternal race/ethnicity
White 36.3 (0.02) 31.1 (0.02) 24.3 (0.02) 8.3 (0.01)
Black 38.6 (0.03) 33.1 (0.03) 21.2 (0.03) 7.1 (0.02)
Hispanic, Spanish interview 32.1 (0.03) 32.9 (0.03) 26.6 (0.03) 8.4 (0.02) Hispanic, English interview 29.2 (0.02) 33.4 (0.03) 28.2 (0.04) 9.3 (0.03) Family income
Up to $17 500 32.0 (0.03) 33.9 (0.03) 27.1 (0.03) 7.0 (0.01)
$17 501–$35 000 37.8 (0.03) 30.4 (0.03) 22.9 (0.02) 8.9 (0.02)
$35 001-$60 000 33.4 (0.03) 32.4 (0.03) 25.7 (0.02) 8.5 (0.02)
⬎$60 000 35.0 (0.03) 31.4 (0.03) 25.6 (0.03) 8.0 (0.02)
Health system factors Health insurance coverage
Private insurance 34.7 (0.02) 31.2 (0.01) 25.3 (0.01) 8.8 (0.01)
Public insurance 36.9 (0.03) 32.8 (0.03) 22.7 (0.02) 7.7 (0.02)
Other coverage 35.7 (0.08) 36.6 (0.08) 23.3 (0.06) 4.5 (0.02)
Uninsured 28.5 (0.05) 26.5 (0.05) 31.2 (0.05) 13.7 (0.03)
Provider setting
Private office 35.8 (0.02) 31.1 (0.02) 25.1 (0.02) 8.4 (0.01)
Health center or public clinic 34.0 (0.04) 32.3 (0.04) 24.8 (0.03) 9.0 (0.02)
Hospital-based clinic 35.9 (0.06) 27.6 (0.05) 23.4 (0.05) 13.1 (0.05)
TABLE 4. Association of BPS Levels With Selected Health Care Factors (N⫽2041)
Population Characteristics Excellent BPS Good BPS Fair BPS Poor BPS
Process of well-child care
Mean duration of visit, min 20.1 (0.6) 17.9 (0.6)* 16.1 (0.6)† 12.4 (0.9)†
Mean family-centered care score‡ 78.3 (1.1) 68.5 (1.3)† 57.2 (1.5)† 42.0 (3.2)† Takes time to understand needs§, % 93.4 (0.01) 88.6 (0.02) 78.4 (0.02) 58.6 (0.05) Respects your expertise on child§, % 88.4 (0.02) 85.7 (0.02) 75.8 (0.03) 65.2 (0.05) Asks how you feel as a parent§, % 66.6 (0.02) 40.4 (0.03) 27.9 (0.03) 14.8 (0.04) Understands parent preferences§, % 74.9 (0.02) 62.9 (0.03) 49.2 (0.03) 29.0 (0.05) Mean score for counseling on family and community risk factors 43.9 (1.5) 29.4 (1.4)* 15.3 (1.0)† 10.1 (1.3)† Ratings of health care experiences
Mean overall satisfaction score 91.8 (0.6) 87.5 (0.8)† 82.3 (1.0)† 77.7 (1.8)† Was able to ask all questions§, % 98.3 (0.01) 96.3 (0.01) 91.2 (0.02) 81.1 (0.05) Provider spent right amount of time§, % 95.7 (0.01) 92.0 (0.01) 78.4 (0.03) 61.4 (0.06) Missed needed medical care储, % 2.4 (0.01) 4.4 (0.01) 8.3 (0.01) 10.0 (0.03) Delayed needed medical care¶, % 8.3 (0.02) 9.3 (0.01) 16.3 (0.02) 14.1 (0.03)
Values are mean or percentage (SE).
*P⬍.01 for the pairwisettest for each category (good, fair, or poor), compared with excellent BPS. †P⬍.001 for the pairwisettest for each category (good, fair or poor), compared with excellent BPS.
‡ Family-centered care component items (not the mean scale) are presented as the proportions reporting “always” or “usually.” §P⬍.0001 for the overall2test.
储P⬍.001 for the overall2test.
primacy of patient welfare regardless of market forces or administrative exigencies and social justice, which emphasizes the elimination of discrimina-tion.36 Alternatively, it may be possible that health
care factors not measured or analyzed in this study, rather than patient and family factors, are associated with equitable distribution of high-quality preven-tive services.
The results of the study must be understood in the context of certain limitations. First, the purpose of the BPS scale was to evaluate a clinically relevant composite measure of core preventive services; therefore, the measure included a limited number of components, which cannot fully represent the broad range of recommended developmental and counsel-ing services that constitute ideal pediatric care. Sim-ilarly, the injury prevention measure has 2 compo-nents for the 4- to 9-month and 19- to 35-month age groups but only 1 component for the 10- to 18-month age group. Whether a combination of other measures of related importance would yield similar results is not known. Studies that used the same dataset with different measures of preventive care showed selec-tive disparities associated with socioeconomic status and structural factors. For example, non-Hispanic white children received more counseling than did nonwhite children,11 parents of nonwhite children
reported higher rates of missed opportunities,37and
discussion of some family and community risk fac-tors was greater among nonwhite parents.38With the
combination of multiple components of preventive care in a single composite measure, this variation largely disappears with the BPS scale.
The usefulness and validity of the BPS scale as a single composite measure is supported by the con-sistency and magnitude of the relationship of the BPS scale results with other aspects of care, particularly process measures such as visit length. This suggests that the services studied are good indicators of the quality of preventive care, given that all BPS items are recommended for parents irrespective of child and family factors. Also, when children do not re-ceive BPS, the services are not simply replaced by other preventive services.
Second, the NSECH measured preventive care only in the first 3 years of life. Whether the preva-lence and correlates of receiving BPS are similar for older children is not known. Third, all BPS measures were based on parental reports, without validity checks of observable behavior, and might not reflect accurately the preventive services actually delivered or whether problems were prevented effectively. It is possible that parental responses to some questions were biased by the parents liking their child’s clini-cian, in which case they might have been more likely to report receiving certain services. It can be argued that, if parents do not recall a discussion, then the guidance provided was not conveyed effectively. We do not know whether services were actually pro-vided by the clinician or whether they were propro-vided by nonphysician support staff members or through written materials. Also, missed opportunities may reflect both clinician practices and parental
prefer-ences and reporting, and this factor is not a measure of clinician behavior alone. Fourth, although the items on the BPS scale are considered best practice and are based on AAP guidelines, the evidence for the effectiveness of these items remains sparse, and we cannot be sure that providing these services pre-vented or changed outcomes. It is also important to note that BPS items and components were not as-signed equal weights.
This study provides an impetus to improve and enhance the quality of preventive pediatric care. Al-though 66% of young children received good or ex-cellent preventive care, as indicated by the BPS mea-sure, 34% of young children received poor or fair care. On the basis of parental reports, we know that these children were also more likely to miss or delay needed medical care. It is not known whether poor or fair care has actual effects on health, specifically related to smoke exposure, injury prevention, iden-tification of developmental disabilities and referral for early intervention services, or other problems that could have been successfully addressed by the pedi-atrician eliciting parents’ concerns or needs. Al-though discussion of a topic does not necessarily indicate effective delivery of guidance or actual pre-vention or alteration of outcomes, the epidemiologic features of the problems and risks discussed suggest nontrivial potential effects on young children’s health and well-being. Fair or poor care appears to be a general problem, affecting nearly one third of a cross-section of all young children in the United States. Identification of process of care factors asso-ciated with less than adequate preventive care has important implications. This analysis suggests that visit length is a potential area to address to improve the quality of preventive pediatric care for all chil-dren. Parents whose children receive BPS also report that the provider takes time more frequently to un-derstand the child’s unique needs. We do not know the predictors of visit length or whether visit length was under the control of the clinicians or imbedded in the logistics or system of care in which the clini-cians were practicing. Inadequacy of primary care reimbursement and the scope of current pediatric preventive care recommendations have been identi-fied as barriers to providers covering all recom-mended counseling topics. Recent approval by the Center of Medicare and Medicaid Services of a rela-tive value for Current Procedural Terminology code 96110 (developmental screening, limited) of $13.81 should help improve delivery of this preventive ser-vice in primary care. There are also some efficiency measures that pediatric providers can implement to improve coverage of other preventive developmen-tal services. Questionnaires, written materials, and videotapes could help providers achieve more in the limited time they have to counsel parents of young children.37–40
dedicated time and specific expertise into pediatric practices, to provide preventive and developmental services and to address parental concerns and needs more effectively. This effort significantly improves the quality of preventive pediatric care for families. Parents who received care in Healthy Steps offices were 20 times more likely than other parents to re-ceiveⱖ4 developmental services during a visit. More importantly, Healthy Steps promotes more positive parenting, including less severe discipline, more timely receipt of immunizations, and increased pa-rental sensitivity to their children (eg, less likely to have children sleep on their stomachs).41,42 Because
these programs require additional resources, other strategies17may be needed to enhance efficiency and
target parental needs while ensuring that BPS items are consistently addressed.
CONCLUSIONS
Although many parents of young children report good or excellent care regardless of parental race, family income, or the child’s insurance status, one third of young children in the United States are receiving relatively low-quality preventive care. This study shows that it is possible to apply a composite measure of preventive practices that is related strongly to other measures of quality, rather than individual items. This has potential implications for future efforts to improve quality of care, especially through the use of electronic medical records as a means to prompt clinicians regarding needed guid-ance. In response, training activities, quality im-provement activities, reimbursement, and incentives can be implemented and evaluated to increase the number of children receiving high-quality preven-tive care, which optimizes their chances for good health.
ACKNOWLEDGMENTS
This work was supported by grants from the Commonwealth Fund, the Maternal and Child Health Bureau of the Health Re-sources and Services Administration, and the Gerber Foundation. B.Z. was supported as a California Endowment Visiting Professor of Pediatrics at the University of California, Los Angeles.
We thank Edward Schor, MD, for his helpful comments on an earlier draft.
REFERENCES
1. Starfield B.Primary Care: Balancing Health Needs, Services, and Technology. New York, NY: Oxford University Press; 1998
2. American Academy of Pediatrics, Committee on Psychosocial Aspects of Child and Family Health.Guidelines for Health Supervision III.Elk Grove Village, IL: American Academy of Pediatrics; 1997 (updated 2002)
3. Green M, Palfrey J, eds.Bright Future: Guidelines for Health Supervision of Infants, Children, and Adolescents. 2nd ed. Arlington, VA: National Center for Education in Maternal and Child Health; 2000
4. Ettner SL. The timing of preventive services for women and children: the effect of having a usual source of care.Am J Public Health.1996;86: 1748 –1754
5. Byrd R, Hoekelman R, Auinger P. Adherence to AAP guidelines for well-child care under managed care.Pediatrics.1999;104:536 –540 6. Short PF, Lefkowitz DC. Encouraging preventive services for
low-income children: the effect of expanding Medicaid.Med Care.1992;30: 766 –780
7. Newacheck PW. Preventive care use by school-aged children: differ-ences by socioeconomic status.Pediatrics.1988;82:462– 468
8. Lieu TA, Black SB, Ray P, Chellino M, Shinefield HR, Adler NE. Risk factors for delayed immunization among children in an HMO.Am J Public Health.1994;84:1621–1625
9. Szilagyi P. Medicaid managed care and childhood immunization deliv-ery.J Public Health Manage Pract.1998;4:67–72
10. Szilagyi P, Rodewald L, Humiston S, et al. Immunization practices of pediatricians and family physicians in the United States.Pediatrics.
1994;94:517–523
11. Bethell C, Reuland CP, Halfon N, Schor E. Measuring the quality of preventive and developmental services for young children: national estimates and patterns of clinicians’ performance.Pediatrics. 2004; 113(suppl):1973–1983
12. Bethell C, Peck C, Abrams M, Halfon N, Sareen H, Collins K.Partnering With Parents to Promote the Healthy Development of Young Children En-rolled in Medicaid. New York, NY: Commonwealth Fund; 2002 13. Starfield B, Cassady C, Nanda J, Forrest CB, Berk R. Consumer
experi-ences and provider perceptions of the quality of primary care: implica-tions for managed care.J Fam Pract.1998;46:216 –226
14. Seid M, Varni J, Bermudez L, et al. Parents’ perceptions of primary care: measuring parents’ experiences of pediatric primary care quality. Pedi-atrics.2001;108:264 –270
15. Schuster M, Regalado M, Duan N, Klein D. Anticipatory guidance: What information do parents receive? What information do they want? In: Halfon N, McLearn KT, Schuster MA, eds.Child Rearing in America. New York, NY: Cambridge University Press; 2002:320 –344
16. Yarnall KS, Pollak KI, Ostbye T, Krause KM, Michener JL. Primary care: is there enough time for prevention?Am J Public Health.2003;93:635– 641 17. Bethell C, Peck C, Schor E. Assessing health system provision of well-child care: the Promoting Healthy Development Survey.Pediatrics.2001; 107:1084 –1094
18. Halfon N, Olson L, Inkelas M, et al. Summary statistics from the National Survey of Early Childhood Health, 2000.Vital Health Stat. 2002;15(3)
19. Blumberg S, Olson L, Osborn L, Srinath K, Harrison H. Design and operation of the National Survey of Early Childhood Health, 2000.Vital Health Stat 1.2002;(40):1–97
20. Regalado M, Halfon N. Primary care services promoting optimal child development from birth to age 3 years: review of the literature.Arch Pediatr Adolesc Med.2001;155:1311–1322
21. Miller TR, Levy DT. Cost-outcome analysis in injury prevention and control: eighty-four recent estimates for the United States.Med Care.
2000;38:562–582
22. Miller TR, Romano EO, Spicer RS. The cost of childhood unintentional injuries and the value of prevention.Future Child.2000;10:137–163 23. Miller TR, Galbraith M. Injury prevention counseling by pediatricians:
a benefit-cost comparison.Pediatrics.1995;96:1– 4
24. DiGuiseppi C, Roberts IG. Individual-level injury prevention strategies in the clinical setting.Future Child.2000;10:53– 82
25. American Academy of Pediatrics, Committee on Substance Abuse. To-bacco’s toll: implications for the pediatrician. Pediatrics. 2001;107: 794 –798
26. DiFranza JR, Lew RA. Morbidity and mortality in children associated with the use of tobacco products by other people.Pediatrics.1996;97: 560 –568
27. DiFranza JR, Lew RA. Effect of maternal cigarette smoking on preg-nancy complications and sudden infant death syndrome.J Fam Pract.
1995;40:385–394
28. Emmons KM, Hammond SK, Fava JL, Velicer WF, Evans JL, Monroe AD. A randomized trial to reduce passive smoke exposure in low-income households with young children.Pediatrics.2001;108:18 –24 29. Emmons KM, Wong M, Hammond SK, et al. Intervention and policy
issues related to children’s exposure to environmental tobacco smoke.
Prev Med.2001;32:321–331
30. Beeber SJ. Parental smoking and childhood asthma.J Pediatr Health Care.
1996;10:58 – 62
31. High PC, LaGasse L, Becker S, Ahlgren I, Gardner A. Literacy promo-tion in primary care pediatrics: can we make a difference?Pediatrics.
2000;105:927–934
32. Golova N, Alario AJ, Vivier PM, Rodriguez M, High PC. Literacy promotion for Hispanic families in a primary care setting: a random-ized, controlled trial.Pediatrics.1999;103:993–997
33. Mendelsohn AL. Promoting language and literacy through reading aloud: the role of the pediatrician.Curr Probl Pediatr Adolesc Health Care.
2002;32:188 –202
35. Agency for Healthcare Research and Quality. Medical Expenditure Panel Survey.Available at: www.meps.ahrq.gov. Last accessed April 20, 2004
36. ABIM Foundation, ACP-ASIM Foundation, European Federation of Internal Medicine. Medical professionalism in the new millennium: a physician charter.Ann Intern Med.2002;136:243–246
37. Kogan MD, Schuster MA, Yu SM, et al. Routine assessment of family and community health risks: parent views and what they receive.
Pediatrics.2004;113(suppl):1934 –1943
38. Halfon N, Mistry R, Inkelas M, Stevens GD, Olson LM. Missed oppor-tunities for Anticipatory Guidance in Pediatric Health Services for Young Children.Pediatr Res.2003;53:225A
39. Glascoe FP. Evidence-based approach to developmental and behav-ioural surveillance using parents’ concerns.Child Care Health Dev.2000; 26:137–149
40. Glascoe FP, Oberklaid F, Dworkin PH, Trimm F. Brief approaches to educating patients and parents in primary care.Pediatrics.1998;101(6). Available at: www.pediatrics.org/cgi/content/full/101/6/e10 41. Minkovitz C, Hughart N, Strobino D, et al. A practice-based
interven-tion to enhance quality of care in the first 3 years of life: the Healthy Steps for Young Children Program.JAMA.2003;290:3081–3091 42. Zuckerman B, Parker S, Kaplan-Sanoff M, Augustyn M, Barth M.
Healthy Steps: a case study of innovation in pediatric practice. Pediat-rics.2004;114:820 – 826
HIGH PRICES I
“Ten years ago, the multinational pharmaceutical company AstraZeneca launched what was known inside the company as the Shark Fin Project. The team for the project was composed of lawyers, marketers, and scientists, and its focus was a prescription drug known as Prilosec, a heartburn medication that, in one 5-year stretch of its extraordinary history, earned AstraZeneca $26 billion. The patent on the drug was due to expire in April 2001. The name Shark Fin was a reference to what Prilosec sales, and AstraZeneca’s profits, would look like if nothing was done to fend off the ensuing low-priced generic competition. . . . AstraZeneca decided on a subtle piece of chemical reengineering. Prilosec, like many drugs, is composed of 2 ‘isomers’—a left-hand and a right-hand version of the molecule. In some cases, removing 1 of the isomers can reduce side effects or make a drug work a little bit better, and in all cases the Patent Office recognizes something with 1 isomer as a separate invention from something with 2. So AstraZeneca cut Prilosec in half. AstraZeneca then had to prove that the single-isomer version of the drug was better than regular Prilosec. It chose as its target something called erosive esophagitis. . . . In 1 study, half the patients took Prilosec, and half took Son of Prilosec. After 1 month, the 2 drugs were dead even. But after 2 months, to the delight of the Shark Fin team, the single-isomer version edged ahead with a 90% healing rate versus Prilosec’s 87%. The new drug was called Nexium. A patent was filed, the FDA gave its blessing, and, in March 2001, Nexium hit the pharmacy shelves priced at $120 for a month’s worth of pills. To keep cheaper generics at bay, and persuade patients and doctors to think of Nexium as state of the art, AstraZeneca spent $500 million in marketing and advertising in the year following the launch. It is now 1 of the half-dozen top-selling drugs in America. . . . Nexium has become a symbol of everything that is wrong with the pharmaceutical industry.”
Gladwell M.New Yorker. October 25, 2004
DOI: 10.1542/peds.2004-0635
2004;114;1522
Pediatrics
Barry Zuckerman, Gregory D. Stevens, Moira Inkelas and Neal Halfon
Prevalence and Correlates of High-Quality Basic Pediatric Preventive Care
Services
Updated Information &
http://pediatrics.aappublications.org/content/114/6/1522
including high resolution figures, can be found at:
References
http://pediatrics.aappublications.org/content/114/6/1522#BIBL
This article cites 33 articles, 12 of which you can access for free at:
Subspecialty Collections
sub
http://www.aappublications.org/cgi/collection/quality_improvement_ Quality Improvement
_management_sub
http://www.aappublications.org/cgi/collection/administration:practice Administration/Practice Management
following collection(s):
This article, along with others on similar topics, appears in the
Permissions & Licensing
http://www.aappublications.org/site/misc/Permissions.xhtml
in its entirety can be found online at:
Information about reproducing this article in parts (figures, tables) or
Reprints
http://www.aappublications.org/site/misc/reprints.xhtml
DOI: 10.1542/peds.2004-0635
2004;114;1522
Pediatrics
Barry Zuckerman, Gregory D. Stevens, Moira Inkelas and Neal Halfon
Prevalence and Correlates of High-Quality Basic Pediatric Preventive Care
http://pediatrics.aappublications.org/content/114/6/1522
located on the World Wide Web at:
The online version of this article, along with updated information and services, is
by the American Academy of Pediatrics. All rights reserved. Print ISSN: 1073-0397.