Recommender Systems using Graph
Theory
Vishal Venkatraman*
School of Computing Science and Engineering VIT University, Vellore, Tamil Nadu 632014, INDIA
Swapnil Vijay
School of Computing Science and Engineering VIT University, Vellore, Tamil Nadu 632014, INDIA
Aayush Jain
School of Computing Science and Engineering VIT University, Vellore, Tamil Nadu 632014, INDIA
Kiran Vedantham
School of Information Technology and Engineering VIT University, Vellore, Tamil Nadu 632014, INDIA
Abstract :
Recommender systems have become one of the important tools in E-Commerce. They combine the ratings of services or products by one user with the ratings from other users to answer similar interest queries with predictions and suggestions. The users thus receive anonymous recommendations from people similar interests. Even though this process seems unobjectionable, it aggregates user preferences, which can be tapped to recognise information about a particular user. Users who rate products or services across different types or domains in the systems are the major victims for this exploitation. We could determine the advantages and risks by performing a detailed analysis with a particular recommendation algorithm, but it would be difficult to draw general conclusions from this approach. In this paper, we aim for an algorithm independent analysis by applying a graph-theoretic model. By employing this model, we show that a user benefits most from recommendations based on similarity between the various products rated by the users. This paper tries to draw a graph through the various items rated by the users and finds the items that are most common among the user and his friends which is then recommended to him.
Keywords: Recommender System, Common vertices, Degree of vertex, Graph Theory approach. 1. Introduction
Table 1.Example Genre ratings.
Table 1. Classification of users according to different music genre
Music Genre
Ram Ramesh Sarah Digvijay Ryan
Alternative N Y N N Y
Hip-Hop N N N Y N
Rock Y Y Y Y N
Metal Y Y N N N
Jazz Y N N N Y
Death Metal
N N Y Y N
Classical N N Y N Y
Country N N N Y N
Pop N N N N Y
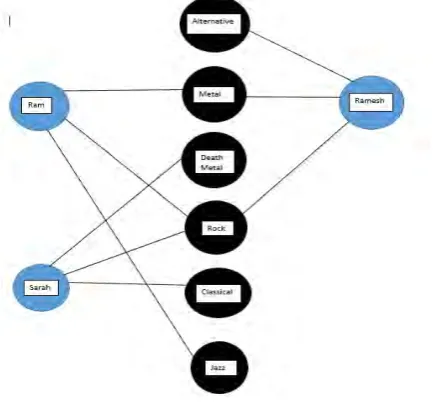
In our technique we create a graph with the vertices as the items on which ratings have been made and the users as the nodes. Based upon the ratings made by the users on the various items we create the edges. The result is a bipartite graph which is also called a hammock graph due to its shape. Using this graph, we can decide on the recommendations to be made to the users. A sample graph based on the above used example is shown in Fig. 1
Fig. 1: Sample graph for Table 1
Recommendation algorithms are designed to balance several considerations, including statistical significance [2], potential for additional revenues and boosting sales, and ability to hold the user’s attention. Recommender systems are almost completely based on the principle of serendipity — the ability to recommend something unexpected, unknown but desirable — because in addition to reflecting consumers’ buying patterns, the goal is to enable cross-selling or to cater to populations with novel tastes. Let us show how Serendipitous Algorithms work. Let us take a sample that includes cross-domains, for example take the two domains-Books and Music Genres. Let us assume that Ram likes Rock Music and also loves to read Biographies. In this case, Ram would probably like to read the book “The rise of The Rolling Stones”. This would cater to both the domains and has a high chance of impressing Ram. Serendipitous recommendation work on the following basis: If a person or several people rated at least two Biographies that Ram rated and also rated atleast one of the Rock Music titles that Ram did, if that person or group also rated the above book then the book will also be recommended to Ram. Of course, many other people might have rated the Rock Music book but since we work through common products, we can allow the user to get an unexpected but tempting recommendation.
2. Graph Theory Approach
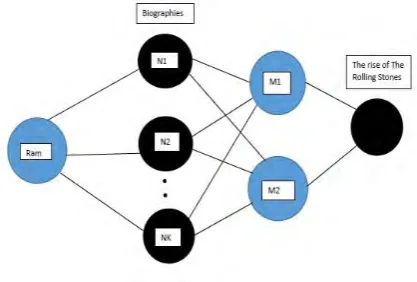
We have already demonstrated how the Recommender System algorithms work by explaining their basic principles and sample applications. Now let us apply the Graph Theory approach to these algorithms to simplify our work. The problem with the above algorithms is that they can be rather tedious to implement when we consider a large number of people. This problem is non-trivial since recommender systems are generally used while targeting a large number of people. The social networking and multi-marketing sites generally have over 1 billion people that use the site so the recommender algorithms have to utilized for all of them. We notice that, as mentioned already above, this task becomes very tedious to implement by conventional means. The code complexity increases exponentially with the amount of people considered in the algorithm. Thus, to simplify our work and the code complexity, we use the graph theory approach. This approach greatly simplifies our work with the large amount of target audience. This can be shown by considering the above example that we used for Serendipitous Recommendations. If we consider multiple domains, the coding done through conventional means would include a very large amount of if statements. If we can consider this in the form of graphs, our work is much simpler as shown in Fig. 2
Fig. 2: Multiple domains for large amount of target audience
As we can see, the Graph theory method is better as it is less complex. By simply following the edges that connect with the most common nodes, we can reach the recommendation of the Book that we need. Thus, we see that the graph theory method is better when compared to the traditional method for Recommender Systems. 3. Existing Algorithms
We have already seen that the Graph Theory approach to Recommender Systems is better than the conventional approach. In the graph representation of ratings, the common ratings form what we call a hammock. A hammock of width k connects two people if they share at least k ratings. A sequence of hammocks can be employed to connect two people. Different algorithms use hammocks in different ways to make recommendations. Hammocks are very important in Graph Theory Applications since they are used in almost all the available Recommender System Algorithms. Nearest-neighbor algorithms, such as those used by GroupLens, LikeMinds, and Firefly, employ an implicit hammock path of length 1 [3]. Additional constraints are typically imposed regarding agreement in rating values. The Horting algorithm uses hammock paths of length greater than 1.2. Recommendation is usually studied by comparing predicted ratings from hammock paths versus user feedback. However, we consider recommendations according to hammock width and path length instead. This allows us to add constraints on the Hammocks which can help to fine-tune the recommendations. In this paper, we do not stress on the transformation of individual ratings on the hammocks into predictions. In reality, there are likely to be multiple paths between a certain artifact X and a person Y with various constraints on k and l. Intuitively, a wider hammock seems likely to generate better recommendations because we have more common ratings to work with.
By insisting on a wide hammock, however, we might have to traverse longer paths to reach a particular artifact from a given person [4]. Still, recommendations involving shorter path lengths are preferred over longer paths because they are easier to explain. From a graph-theoretic viewpoint, the parameters k and l determine the reachability of artifacts from each person and thus, also help to map the prediction quality.
So now let us now discuss the existing algorithms that are used for Recommender Systems. The most commonly used algorithms are the LikeMinds Algorithm and the Horting Algorithm.
3.1 LikeMinds Algorithm:-
turn, and obtained a pre- diction for that rating based on the remaining data. To predict the rating of movie X for person Y, LikeMinds computes a metric called the agreement scalar (between Y and every other person who has rated X). The algorithm uses the ratings from the person with the highest agreement scalar to compute the recommendation. We recorded k as the number of common ratings between person Y and the person with the highest agreement scalar. The results indicate that, for this algorithm, wider hammocks contribute to lower discrepancies and better ratings. Notice that Like- Minds uses hammocks not just to model commonality, but also to represent agreement between the rating values spanning a hammock.
3.2 Horting algorithm:-
The Horting algorithm uses explicit hammock paths of varying length to provide recommendations. To study the effect of path length l, we fixed the hammock width k at 113 and analyzed paths of varying lengths from people to movies. The algorithm uses a transformation technique similar to one used by LikeMinds to make predictions from others’ ratings. For the MovieLens data set, we found that all paths involved 1, 2, or 3 hops between people and a final hop to the recommended movie, resulting in path lengths of 2, 3, and 4 for all recommendations. Greater path lengths caused a faster-than linear decay in prediction quality for a given k.
4. Proposed Model
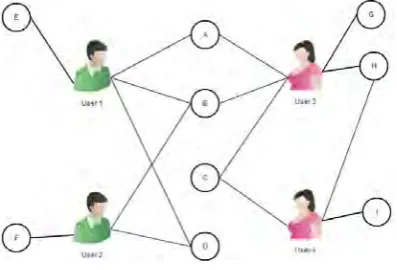
We have already seen the algorithms that are currently used worldwide in the implementation of Recommender Systems. Now, to improve upon the existing practices, we propose a model of our own which may be used to implement Recommender Systems with more simplicity and lesser complexity of code. This model of ours is based on the number of common interests or products that exist between a user and his friends. This algorithm seeks to recommend those products to the user which are also rated by his friend, who has the highest amount of common interests or ratings with the user. Let us consider an example which is similar to an example already presented in the introduction of this paper-Let us take 4 users who have rated products based on a certain domain-here let us take it as TV shows. Let the shows be represented alphabetically as A, B, C, etc. Let us represent it using a diagram as shown in Fig. 3
Fig. 3: Graph with 4 users and TV shows represented as nodes
Let us consider Users and the shows they have rated:-
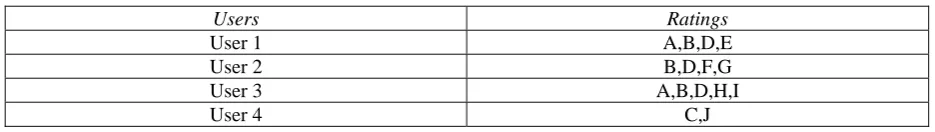
Table 2. Users and the TV shows they have rated
Users Ratings
User 1 A,B,D,E
User 2 B,D,F,G
User 3 A,B,D,H,I
User 4 C,J
Now let us consider the recommendations for User 1. We find the user with which the User 1 has the highest number of common ratings for shows. This can be seen below:-
User 2 has two shows in common with User 1- B and D. User 3 has three shows in common with User 1- A, B and D. User 4 has no shows in common with User 1.
The shows are recommended in the decreasing order of the weights of the shows. This helps us to recommend shows that majority users have rated and thus the target user has more probability of liking. This is shown in Fig. 5. After the recommendation to User 1, we can follow the same procedure for all the other users. Now the problem that arises here is that not always will we have a clear winner in terms of common ratings. A lot of times we will have two or more Users which have the same number of common ratings. This is demonstrated in Fig. 4.
Fig. 4: Graph showing users with same number of common ratings
In the above we can see that both User 2 and User 3 have the same number of shows in common with User 1. This can be shown as:-
User 1-A, B, D, E. User 2-B, D, F. User 3-A, B, G, H.
Now User 2 has the two shows B and D in common with User 1 while User 3 has the shows A and B in common with User 1. Now, to solve this scenario, we propose two different solutions which can be selected depending upon the requirement of the person implementing the Algorithm.
The first solution is to compare the two or more users who have the same number of shows in common with the user to whom recommendation is to be given. Now, between these users, we select the user who has rated the least number of shows. This solution is based upon probability and should be chosen by organisations whose main aim is user satisfaction. This solution is based upon the principle that the user who has rated lesser number of shows will most probably have more in common with the targeted user than the person who has rated larger number of shows. This is derived by applying the principles of mathematical probability. Lesser number of shows means lesser denominator and therefore more probability since probability is based on the formula: Number of common shows/Total shows rated. Thus, this solution gives more user satisfaction but reduces number of recommendations which defeats the purpose of cross-marketing. This solution prefers quality over quantity.
The second solution is to compare the users and take the user who has rated the most number of shows. This solution is used to give the most number of recommendations and is based upon the practice of providing as many recommendations to the user as possible to offer more variety. This practice is also based on the theory that the more the recommendations provided to the user, the more the chance that he may come across something he may like. This solution prefers quantity over quality. This solution should be used by organisations that promote cross-marketing and offer more variety to their users.
A third scenario also occurs. In this scenario, two or more users have exactly the same number of shows in common with the target user and each of the users have also rated the exact same number of shows. In this case, the solution is that any of the users may be selected at random and his/hers’ shows can be recommended to the target user.
An algorithm is also devised based upon the above three scenario’s. The algorithm is as follows:- 1. Check whether User 1 has rated X.
If true, check the other users for the same ratings.
2. If match found, increase the common ratings counter value by 1 and continue checking for all the ratings. 3. If no two max common ratings counter values are equal:
Then for the user, say user M, who has the maximum common ratings counter Then recommend all the ratings given by user M to User 1 that User 1 hasn't rated. Else // (If the two max common ratings counter values are equal)
Then assign weight to the corresponding ratings that User 1 hasn't given and recommend those to User 1 in the decreasing order of their weights.
The above recommendation can be done in two ways:-
Option 1: Find the user who has given the least number of ratings.
Then recommend those to User 1 according to decreasing order their weights. // If fine-tuned recommendations are needed.
Option 2: Find the user who has given the maximum number of ratings.
Then recommend those movies according to decreasing order of their weights. // If more quantity of recommendations is needed.
If two or more users have same common ratings counter and same number of ratings given Then select any user at random and recommend his ratings to the target user.
5. Issues
The problem with Recommender Systems is that even though they give a chance for the user to discover something that he doesn’t know but may like, they also invade upon the privacy of the user and may irritate him. It may also compel him to buy something that he actually doesn’t need but is tricked into believing that it is needed by him. Hackers may also use these Systems to their advantage to further dupe the users by recommending illegal and/or potentially harmful services. Solutions to these problems are beyond the scope of this paper but they need to be mentioned as they affect the users that are targeted by these algorithms.
References:
[1] Privacy Risks in Recommender Systems by Naren Ramakrishnan, Benjamin J. Keller and Batul J. Mirza from Virginia Tech, Ananth Y. Grama from Purdue University and George Karypis from University of Minnesota.
[2] J.A. Konstan et al., “GroupLens: Applying Collaborative Filtering to Usenet News,” Comm. ACM, vol. 40, no.3, Mar. 1997, pp. 77-87.
[3] C.C. Aggarwal et al., “Horting Hatches an Egg: A New Graph–Theoretic Approach to Collaborative Filtering,” Proc. Fifth Int’l Conf. Knowledge Discovery and Data Mining (ACM SIGKDD 99), ACM Press, 1999, pp. 201-212.