Modal Parameter Extraction Of a Heavy
Structure Using Multi Input Multi Output
(MIMO) Test.
ARUN SHARMA
Assistant Professor, Department of ME, University of Petroleum & Energy Studies,
Dehradun, India [email protected]
JAGDISH DHOLARIA
NVH Project Engineer,
Faurecia Emissions Control Technologies LLC USA, Columbus, Indiana, USA
M. RAMESH
Assistant Professor, Department of ME, University of Petroleum & Energy Studies,
Dehradun, India [email protected]
Abstract:
To estimate the modal parameters of Excavator Cab by conducting Multiple Input Multiple Output (MIMO) Modal Analysis test. MIMO testing is done to obtain Frequency response functions(FRF’s) either with two or more fixed inputs of forces and multiple outputs(called Input referencing) or with fixed multiple outputs and multiple inputs(called Output referencing). In the present testing, fixed inputs (via four shakers) and multiple outputs using five triaxial accelerometers were used to plot the FRF’s. After this the FRF’s were processed i.e. curve fitting was done using PolyMAX frequency domain method for estimating the modal parameters. After obtaining modal parameters synthesized FRFs were plotted by curve fitting. The synthesized FRF is not 100% correlated with the original FRF because it doesn’t consider the lower and upper residual terms. The MIMO modal test conducted on the Excavator cab shows the capabilities of Multi Input modal test that if the structure is quiet heavy and rigid the multi input test becomes necessary because exciting at only one DOF will not be able to transmit the energy to the whole structure which will not help us to characterize the whole structure. Further the MIMO test will reduce the nonlinearities in the test and reciprocity can be checked easily.
Keywords: Modal Analysis; Multi Reference Modal Analysis; Frequency Response Functions.
1. Introduction
In order to understand resonant behavior of a vibrating structure, modes offer a simple means of characterizing the structure. Modes can be obtained analytically (say by Finite element analysis) or by Experimental Modal analysis. In both methods we obtain modal parameters viz. Frequency, Damping and Mode shapes in order to construct a modal model of the dynamic system. The significance of experimental method cannot be emphasized more than that it is used to explain dynamic system which is not obvious from analytical method or by intuition and it also serves a model for any future structural modifications.
2. Theory of MIMO
FRF H (ω) is defined as the ratio of Fourier transform of Output X (ω) to Fourier transform of Input F(ω). In order to develop a modal model for a structure i.e. and FRF matrix, excitation and response measurements are done at various locations which give us various elements of the FRF matrix. The columns of FRF matrix refer to Inputs and rows refer to outputs. Usually one row or column is sufficient to represent the system model except in some cases said below we need multiple inputs and outputs called multi referencing. So, multi referencing is required when:
a) Structure cannot be excited sufficiently from one point so we need more excitation points. b) All modes cannot be excited from one reference.
c) Closely couple modes means structure has repeated roots.
The estimation of FRF’s in case of multiple uncorrelated inputs is given as: [H1]T= [GXX]-1[GXY]
Where GXX denotes the matrix of auto and cross spectra of and between different input degree of freedoms and
GXY is matrix of cross spectra between different inputs and outputs. Uncorrelated inputs are provided to shakers
but due to coupling effect because of structure it will never be zero. H1 estimator can eliminate the influence of
uncorrelated noise at output by averaging.
3. Experimental Setup & Procedure
3.1 Boundary Conditions
The selection of boundary conditions depends upon the aim of the test. For comparing the results with Finite Element Analysis generally Free-Free conditions need to be simulated because Finite Element Analysis gives undamped modes or to determine the dynamic characteristics of the structure in
the operating conditions. In our case, Free-Free boundary conditions were simulated by mounting the Excavator cab on rubber tires filled with air. This brought the Excavator cab in a floating like condition. But the Free-Free conditions cause the theoretical 0 Hz rigid body resonances to shift to slightly higher frequencies. Hence the suspension should be sufficiently soft to ensure that these resonances stay well below the first deformation resonance.
The location of the supports of the cab was near the four corners in the base because the connection of the object being tested with the environment should be at node points. Although we didn’t have FEA results to get the approximate mode shapes but for the cab geometry it is quite reasonable to assume that its node points will lie on or near the corners.
Front Face, Back face: As seen from driver seat position. . Right and Left face: Drivers Left and Right respectively.
Fig. 1
3.2 Transducers
Actually our frequencies of interest were up to 300 Hz as was identified by carrying out the impact modal test on the same cab as explained later in the report. Therefore the appropriate transducer for low frequency measurement is displacement type. But these transducers are relatively heavy which itself influences the system to be measured and therefore gives less accurate results whereas accelerometer is relatively very light and influences less on the system itself and so more accurate results.
The accelerometers were mounted on the cab surface using bees wax. Actually the mounting of accelerometer should be on threaded studs connected with the structure but it needs those studs to be fixed rigidly to the structure which for a bigger structure becomes difficult to do. An alternative is to use plastic mounts having studs, glued to the structure but this was not used.
The inputs to the system (Excavator cab) were given by four shakers on each face of the cab simultaneously. The input force measurements were done using load cells mounted at the end of the shaker stinger on the input point of the surface.
3.3 Excitation System
The test set up comprised of 4 electro dynamic shakers for exciting the cab on each face. The excitation signal used was Burst Random so the input output mechanical properties of the shaker which are not flat throughout the frequency range are not of much concern. Also a non-deterministic signal (Burst Random) was used. This signal has amplitude, phase and frequency varying at any instant in time and by having such input at all the faces of the cab ensures uncorrelated inputs which is a requirement for MIMO testing that all the inputs should be uncorrelated also it was considered to excite the structure on all the four faces by assuming that this configuration will try to excite the structure uniformly over the frequencies of interest.
3.4 Data Acquisition System
The system input and output data i.e. force and acceleration data from the transducers was acquired using LMS SCADAS III system having 20 measurement channels.
3.5 Testing Procedure
(1) In order to carry out the MIMO test first we need to identify the excitation locations (driving points) on the system from where the force input can be given to the system using shakers. To identify these we need to know the mode shapes of the system and also the frequencies of interest. We were interested in the low frequency modes (because of the assumption that cab will have these modes excited under the operating conditions). Now the cab is a complex real structure which does not have a closed form solution so to get its mode shapes Finite Element Analysis can be done. In our case we didn’t do any FEA analysis but we carried out an Impact Modal test at various locations on all the faces of the cab which helped us to identify the driving point locations for the shaker.
Some important considerations for the Driving point are:
(i) It should be able to excite the structural modes in the frequency range of interest. (ii) There should be even distribution of input energy in order to keep the response linear. (iii) It should not be a node point.
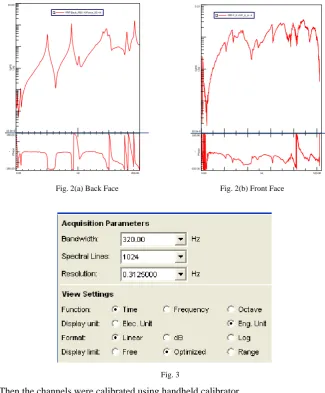
The impact test was done on front and back face of the Excavator cab for identifying the driving points. The accelerometers and channels were calibrated using the hand held calibrator. Then the impact testing was started and driving points as well as some cross measurements were taken by roving the accelerometers on the front and back face of the cab. The cross point accelerometers were used to see the excitation characteristic of the particular driving point. Some of the FRF’s of the identified driving points are shown in Fig.2.
The FRF shown for the back face is taken at the point near the edge which looks like a driving point FRF which has resonances followed by anti-resonances. The FRF for the front face is taken on the front face panel near the top edge which shows that it is quiet damped structure.
The driving points selected from the impact tests carried out were as follows: Front: 44, Right: 46, Back: 50, Left: 85
(2) After selection of driving points electro dynamic shakers were mounted on the selected location on the four faces of the cab.
10.0e-6 10.00
Log
(g/
N
)
FRF Back_P50:-X/Force_50:+X
0.00 Hz 200.00
-180.00 180.00
P
has
e
°
10.0e-6 0.10
Log
(g/N
)
FRF F_6:+X/F_6_in:-X
0.00 Hz 520.00
-180.00 180.00
P
has
e
°
Fig. 2(a) Back Face Fig. 2(b) Front Face
Fig. 3
(ii) Then the channels were calibrated using handheld calibrator. (iii) The data acquisition parameters are shown in Fig.3
(3) Now the data was acquired by roving the tri axial accelerometers on all the selected degree of freedoms and the uni- axial accelerometer was roved on each face at a time. This process resulted in 90 runs of FRF data. This comprised of data from 73 points on back face, 77 points on front face, 184 points on left face and 107 on right face.
4. Post Processing
FRF were processed i.e. curve fitting was done using PolyMAX frequency domain method for estimating the modal parameters.
4.1 PolyMAX frequency domain method
In this method a stabilization diagram is constructed containing frequency, damping and participation
information. Then the mode shapes are found using the stable poles selected by the user. Now to construct the stabilization diagram CMIF is used. CMIF indicates the existence of real normal or complex modes and the relative magnitude of each mode. Also, CMIF yields the corresponding mode shape and modal participation vector. Here we input the model order of the system by visually identifying the number of poles in the CMIF and try to over determine system poles by specifying higher order model(usually twice or thrice the visually identifiable poles) for a particular frequency band.
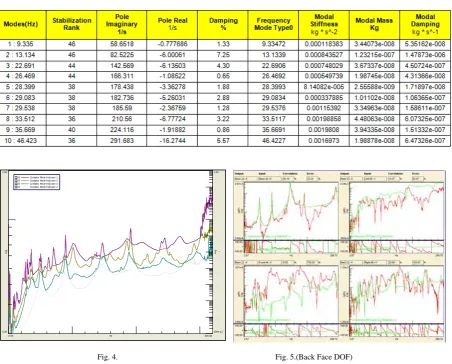
CMIF (Complex mode indicator function) is calculated to identify the poles of the system. CMIF is the plot of Eigen values obtained by pre multiplying the normal matrix1 formed from the FRF matrix by its hermitian and calculated at each spectral line. CMIF is shown in Fig: 4. In the case when smaller dimension of the FRF matrix is larger than or equal to number of dominant modes at a specific frequency the SVD leads to modal vectors (mode shapes and modal participation vectors).
Least square complex frequency domain (LSCF) method by selecting the frequency band in the CMIF’s. The extracted parameters are shown in the shape Table1.
Fig. 4 show’s 4 CMIF’s. Corresponding to Eigen values obtained from the normal matrix. Since there are 4 inputs, So 4 CMIF’s are there. The top most curve is called Primary CMIF and then there are secondary CMIF’s which are plotted using lower Eigen values.
The primary mode indication function exhibits a local minimum or maximum at each of the natural frequencies of the Excavator cab under test. The secondary mode indication function exhibits a local minimum or maximum at repeated or pseudo-repeated roots of order two or more. Further mode indication functions yield local minima or maxima for successively higher orders of repeated or pseudo-repeated roots of the Excavator cab under test. The peak in the CMIF indicates the damped natural frequencies nearest to poles of the system, but not all the peaks indicate this. Peaks can also be because leakage, nonlinearity and cross Eigen value effects. Cross Eigen value effect is dips in the higher Eigen value curve and peak in the lower Eigen value curve because of equal contribution of the 2 modes. The modal parameters extracted are shown in Shape Table i.e. Table. 1. The modal parameters are extracted from the experimentally obtained FRF’s by curve fitting them. Below are shown the synthesized FRF’s from the parameters obtained by curve fitting them. The better the curve fit as is clear from visual inspection or from the calculated correlation coefficient the better is the estimation of the modal parameters. The synthesized FRF is not 100% correlated with the original FRF because it doesn’t consider the lower and upper residual terms.
Table. 1
Fig. 4. Fig. 5.(Back Face DOF)
Fig. 5 shows the overlaid synthesized and original FRF’s for DOF 22 on back face with reference from force inputs on all four sides. The top left FRF is of output and input on the same face and in the same direction. In this case the synthesized FRF has good correlation with the original FRF. This validates that the parameters extracted from this FRF are quiet reliable. If we see the FRF’s of the same point but with reference taken from force input on all other faces i.e. Inputs at Left and Right face then we see that the correlation between the Back Face DOF original and synthesized FRF’s is not good and hence no reliable estimate of modal parameters, also it means that exciting the system on the DOF 44 at the front face, Left face at DOF 85 and Right face at DOF 46 is not going to give a good estimate of Modal parameters. This suggests that the exciting the structure from front
0.00 Hz 320.00
0.20 2.00
Lo
g
100e-12 1.00
Lo
g /
face at the panel is not going to transmit requisite energy to DOF 22 at the back as the structure is quiet stiff for this input- output combination.
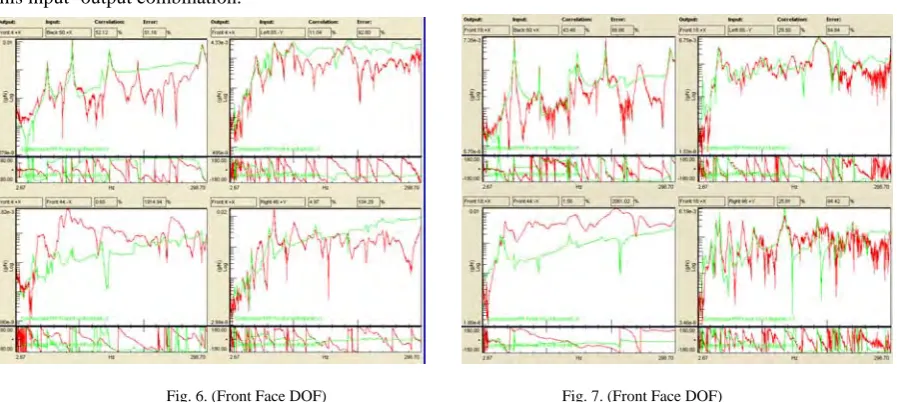
Fig. 6. (Front Face DOF) Fig. 7. (Front Face DOF)
Fig. 6 shows the FRF’s of measurement DOF 4X on the front face and inputs at Back 50X, Left 85Y, Right 46Y and Front 44X. The bottom left FRF (Front4 X/Front44-X) doesn’t show good correlation between the synthesized and the original FRF although excitation is done at the same face because the fiber glass panel is quiet damped and therefore not able to excite the DOF 4X on the front face frame. Exciting the structure on left 85Y DOF is able to excite the DOF 4X on the front panel better than the vice-versa but correlation is still less as compared to back surface DOF 50X. This suggests that back face DOF 50 X is a good excitation point.
Fig.7 shows the FRF’s of measurement DOF 18X on the front face fiber glass panel and inputs at Back 50X, Left 85Y, Right 46Y and Front 44X. The bottom left FRF (Front18X/Front44-X) doesn’t show good correlation between the synthesized and the original FRF although excitation is done at the same face because the fiber glass panel is quiet damped and therefore not able to excite the DOF 18X on the front face. Exciting the structure on left 85Y DOF is able to excite the DOF 18X on the front panel better than the vice-versa but correlation is still less as compared to back surface DOF 50X. This suggests that back face DOF 50 X is a good excitation point. Also excitation on right 46 Y is also able to excite in lower frequencies on the same face but not much on other faces.
Similarly, FRF’s for right face and left face were obtained. The FRF’s of measurement DOF 71-Y on the Right face fiber glass panel and inputs at Back 50X, Left 85Y, Right 46Y and Front 44X. The bottom left FRF (Right71-Y/Front44-X) doesn’t show good correlation between the synthesized and the original FRF because the excitation is done on the front in X direction and the structure is quiet stiff in this Input/output combination. Exciting the structure on Right 46Y DOF is able to excite the DOF 71-Y on the right panel better correlation is still less as compared to previous cases. This suggests that back face DOF 50X is still good excitation point at least for low frequencies.
The FRF’s of measurement DOF 175Y on the Left face door fiber glass panel and inputs at Back 50X, Left 85Y, Right 46Y and Front 44X. The bottom left FRF (Left175Y/Front44-X) doesn’t show good correlation between the synthesized and the original FRF because the excitation is done on the front in X direction and the structure is quiet stiff in this Input/output combination and not able to transmit energy. Exciting the structure on Right 46Y DOF is able to excite the DOF 175Y on the left panel better for low frequencies but correlation is still less as compared to other cases. The back face excitation in X direction is better able to excite the Left face. The excitation on the Left face at the frame point shows good correlation for the measurement DOF at the left face which suggests that left face DOF 50X is a good excitation point for exciting left face only but back excitation point is better for all faces.
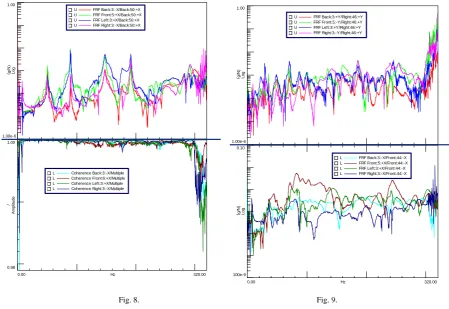
1.00e-6 1.00 Log ( g/ N )
U FRF Back:3:+Y/Right:46:+Y U FRF Front:5:-Y/Right:46:+Y U FRF Left:3:+Y/Right:46:+Y U FRF Right:3:-Y/Right:46:+Y
0.00 Hz 320.00
100e-9 0.10 Log ( g/ N )
L FRF Back:3:-X/Front:44:-X L FRF Front:5:+X/Front:44:-X L FRF Left:3:+X/Front:44:-X L FRF Right:3:-X/Front:44:-X
Fig. 8. Fig. 9.
5. Conclusion.
It is observed that the back face of the Excavator cab has good potential to transmit the energy to all other faces of the cab in general and therefore is a good location for exciting the structure as a whole. The front, right and left face exhibit quiet damped locations because it consists of mainly the fiber glass panels and therefore is not able to transmit the energy to the whole structure. The shaker on the left face was attached to the metallic frame part which forms the boundary of all the faces of the cab. This point seems to have good potential of transmitting the energy to the other parts of the cab but not as good as back face. The top part of back face is quiet damped. It is also seen that some of the modes shown in the individual FRF’s say in Fig. 8 and 9 are seen to be stable poles but some of them do not show up as moving the faces of the cab in a dominant way but they are showing up the dominant motion of few points only.
Some of the modes observed on the Excavator cab are shown below in table 2.
Table 2.
Mode No. Frequency(Hz) Comments
1 9.335 Rigid Body Mode
2 13.134 Breathing mode
3 22.69 First bending of side fiber glass panels 4 26.469 Dominant second bending of right face
5 28.399 Breathing mode with dominant left face bending
6 29.083 Second bending mode of right face with dominant second bending of left face
7 29.538 Dominant second bending of right face about Z axis 8 35.669 Dominant bending mode of right face about X axis 9 50.763 Bending mode of front and back faces
It is also observed that the shakers are able to excite the cab face along the line of excitation force and in other two directions they are not able to pass much energy also the other 3 shakers are not able to transmit the energy in those direction because the structure is quiet stiff in that direction and may be the excitation by the two shakers on the opposite faces are balanced to certain extent and therefore enable to excite only the local face. 1.00e-6 1.00 Lo g ( g/ N )
U FRF Back:3:-X/Back:50:+X U FRF Front:5:+X/Back:50:+X U FRF Left:3:+X/Back:50:+X U FRF Right:3:-X/Back:50:+X
0.00 Hz 320.00
0.98 1.00 Am p lit u d e /
The MIMO modal test conducted on the Excavator cab shows the capabilities of Multi Input modal test that if the structure is quiet heavy and rigid the multi input test becomes necessary because exciting at only one DOF will not be able to transmit the energy to the whole structure which will not help us to characterize the whole structure. It further suggests that the MIMO test will reduce the nonlinearities and reciprocity can be checked easily.
References
[1] Bart Peeters, Herman Van der Auweraer, Patrick Guillaume and Jan Leuridan, LMS International, Belgium, The PolyMAX frequency-domain method: a new standard for modal parameter estimation?, Shock and Vibration 11(2004) 395-409
[2] Chih Y. Shih, David L. Brown, (1989). The Complex Mode Indicator Function approach to Modal Parameter Estimation, UC-Irvine [3] Helen, Lammens, Sas, Modal Analysis Theory and Testing
[4] R.J.Allemang, R.W. Rost and D.L.Brown, Multiple Input Estimation of Frequency Response Functions: Excitation considerations, ASME Paper 83-DET-73.
[5] R.J. Allemang, A.W. Phillips, The Unified Matrix Polynomial Approach to Understanding Modal Parameter Estimation: An Update [6] Roger Williams ,John Crowley, Harvard Vold, The Multivariate Mode Indicator Function in Modal Analysis