202
Soil Data Classification Using Attribute Group
Rank with Filter Based Instance Selection Model
G.Murugesan, Dr. B.Radha
Abstract— Due to the advancement of automation through data mining and machine learning algorithms, research on agricultural components such as soil, crops, rainfall and price prediction have gained massive attraction from research communities. Data mining along with machine learning techniques have become the most dominating field employed in almost all the research areas pertaining to knowledge acquisition. The nutrient status of the soil along with environmental and climatic conditions are directly involved in agricultural production. Though the farmers have wide practical knowledge about the crops, the natural changes happening at the earth's surface and unpredictable climatic changes and rainfall normally do not support crop productivity. In agriculture, the soil is the foremost important factor that includes several physical parameters such as pH value, organic carbon present in the soil along with primary macronutrients and secondary micronutrients and thus the knowledge about the quality of soil reveals the type of crops to be cultivated and the amount of yield produced. In this paper, a novel classification algorithm is proposed that uses attribute group rank with filter-based instance selection for effectively classifying the soil data. Experiments have been made with the soil data of the Pollachi region in Coimbatore district, Tamil Nadu state, India which is a popular market place for various grains, vegetables, and fruits. The classification accuracy of the proposed model is also compared with the other classification models. From the result analysis, it is proved that the proposed model provides a better accuracy rate for soil data.
Index Terms— Agriculture productivity, soil data, attribute group rank, instance selection-based learning, macronutrients, micronutrients, classification accuracy, filter based instance selection
.
——————————
——————————
1 I
NTRODUCTION Agriculture plays a vital role in the Indian economy and provides occupation to about 75% of the population. As agriculture is considered to be the backbone of the country, and as it reflects the Indian economy, the soil and other necessary components have to be properly analyzed before crop cultivation. Soil is a non-renewable natural resource, and its health and land productivity have to be maintained for the sound production system. Though several factors affect the crop yield, the soil is the major factor as all inputs in the production systems can be functionally prosperous only when there is soil/ land which is qualitatively suitable for such purpose [1]. Soil classification provides information on the characteristics and location of the different kinds of soils and their potentials as well as their limitation for a different purpose.The nutrients present in the soil are the most important for plant growth. There are several nutrients present in the soil. Laboratory tests often check for plant nutrients in three categories: Major nutrients: nitrogen (N), phosphorus (P), and potassium (K), Minor nutrients: iron, manganese, copper, zinc, boron, Sulphur and physical properties such as pH, organic carbon and electric conductivity [2]. Though there are several nutrients, the primary macronutrients NPK (Nitrogen, Phosphorous, Potassium) plays a major influential role in determining soil fertility [3]. Based on the amount of NPK present in the soil, crops can be cultivated on a rotation basis to improve the yield [4, 5]. This classification of soil can be effectively carried out with classification algorithms than statistical analysis.
Data mining has gained its importance in all the fields of the research study. A classification is a learning approach that perfectly maps the unambiguous data sample to the predefined class labels. Recently, Machine learning algorithms are widely used for classifying the records of various data types irrespective of fields [6]. Not only automating the process in the field of agriculture will increase productivity but also predicting the soil types for effective yields of crops are also significant [7, 8].
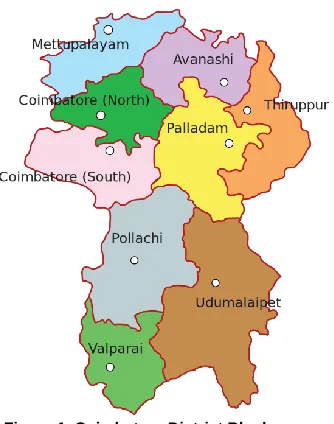
This paper presents the method that effectively classifies the soil datasets using attribute group rank with filter-based instance selection model by grouping the attributes having similar significance and then classifying the samples by filtering the patterns based on the attribute group. The method is specifically applied for Pollachi taluk soil fertility data based on soil atlas of the Coimbatore district provided by the soil survey and land use organization [9].
Figure 1. Coimbatore District Blocks
The paper is organized as follows. Section 2 briefly explains the existing methods and related works pertain to the soil classification. Section 3 presents the detailed working procedure of the overall architecture of the proposed model along with the algorithms. The experimental analysis in section 4 presents the details about the dataset used, illustration with sample test and training records along with the result analysis. Finally, section 5 concludes the proposed research work.
2
R
ELATED WORKS203 Tamil Nadu [11].
Similarly, Jayalakshmi and Savitha Devi implemented C5.0, Random forest, and K-Nearest Neighbour as classifiers for predicting soil fertility to increase crop productivity using a data analytic tool [12]. The authors found that the C5.0 classifier yields better results. Soil profile data is also analyzed using naïve Bayes classifier types and random forest based on which the author Ramesh and Ramar conclude that the results of classification algorithms are better than the statistical analysis of the soil data [13]. Similarly, the backpropagation network has been utilized for analyzing the soil properties which produces better results using gradient descent algorithm [14].
Not only classification, other data mining techniques such as clustering and classification are also highly employed for agriculture data [15]. To analyze the crop productivity with respect to the soil nutrients and rainfall, the clustering technique is used to cluster the crop based on the suitability of crop against the nature of the soil pertaining to the particular region of Coimbatore [16]. The significance of data mining techniques in the field of agriculture field has been analyzed by implementing association rule mining for different soil types in context to the agriculture domain [17]. Experts systems such as fuzzy logic inference system and other computing techniques are also analyzed with the aim of solving several issues related to the agricultural field [18].
The hybrid classifier has been utilized that consolidates the decision tree classifiers' property to isolate out dependent attributes, and finally, an effective classification is made by the naïve Bayes classifier on independent attributes [19]. However, data mining tools along with agricultural data typically increases productivity by making quality decisions and predictions [20]. Apart from specific methods for agriculture data, several other classification algorithms exist [21] that makes use of ensemble learning [22] and instance-based classifier [23]. Though several classifier models have been employed for classifying the soil data, the methods are not specific as they are not built based on the characteristics of the soil. Thus, there is a need for improving the performance of the classification of soil data by suggesting the model specifically suitable for soil characteristics. The proposed method has been specifically suggested that is suitable for the soil profile data.
3 A
TTRIBUTEG
ROUP RANK WITH FILTER BASED INSTANCE SELECTION MODEL(AGRFIS
M
ODEL)
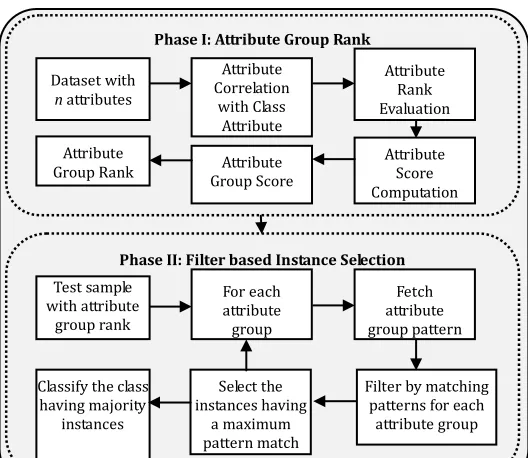
The proposed model has been divided into two significant phases such as attribute group rank and filter-based instance selection model for effectively classifying the soil nutrients and its status. The overall framework of the proposed framework is presented in Figure 2.
Figure 2. Framework of the Proposed Classification Model
The overall idea of the proposed model is that the attributes are grouped and are ranked based on which the input test samples are classified by matching the patterns of each attribute group in the order of attribute group rank. The instances are filtered at each level of pattern matching by selecting the instances that are having maximum match count and finally the class having a maximum number of instances is predicted as a class label for the test samples. The detailed working procedure of attribute group rank and filter-based instance selection model are presented in the below subsection.
3.1 Attribute Group Rank
The attribute group rank is suitable for many datasets in which some of the attributes will have the same significant level based on the attribute characteristics. For instance, the soil database is of such type. The soil database can have several attribute groups involving physical parameters, macronutrients, and micronutrient parameters. The features such as pH value, organic carbon (OC), electrical conductivity (EC) can be grouped together as they are related to physical parameters with the same significant level. Similarly, the attributes nitrogen (N), phosphorus (P), and potassium (K) are grouped as they belong to the macronutrient parameters with the same level of significance. Finally, the attributes sulfur (S), zinc (Zn), iron (Fe), copper (Cu), Manganese (Mn) and boron (B) having the same significant level are grouped together. Generally, the macronutrients and physical parameters play a vital role in classifying soil fertility than micronutrients. Thus the grouped attributes are ranked with their significance level and based on which the filtering based instance selection model is applied for effective classification of the given data.
In many cases, the dataset may contain numerous attributes and not all of them are substantial for the study. Thus the substantial features can be selected based on the various attribute evaluation methods. Most of the methods compute either rank [24] or score [23] for each attribute and with which the significant attributes are selected. The proposed method evaluates the attribute significance and thereby the ranks are allocated for all the attributes. The ranks are then converted to scores and the attribute group scores are evaluated. Finally based on the attribute group scores, attribute group rank is assigned for all the groups.
In the proposed model, the attribute ranks are evaluated using correlation analysis. The method computes the prominence of an attribute by determining the dependency between the attribute and the class using Pearson’s correlation analysis. Though there are several attribute evaluators available in literature such as decision table and relief based algorithms, correlation provides better results among them [24]. However, as the correlation scores always lie between -1 and 1, to scale the scores, the scores are converted to ranks and then to rank scores. Based on the correlation scores, the ranks are assigned to the attributes in such a way that the attribute having a maximum correlation score is assigned a minimum rank and vice versa. Once the ranks are assigned for the attributes, the corresponding score for each attribute is computed by simply inverting the ranks. Thus the formula to compute the scores for the attributes ranks are given in Eq. (1).
Here, n is the number of attributes in the dataset. On identifying the scores for the attributes, the attribute group score is computed by averaging the scores of the attributes belonging to the same group. Finally, the attribute group rank for all the groups is identified from the group scores obtained earlier. Utilizing these ranks, each attribute group pattern of the test samples is matched with patterns of the attribute group in the training set for effective classification and the procedure is explained in the next section. The algorithm for the attribute group rank is presented in Figure 3.
Phase I: Attribute Group Rank
Dataset with n attributes
Attribute Correlation
with Class Attribute
Attribute Score Computation Attribute
Group Score Attribute
Group Rank
Phase II: Filter based Instance Selection
Test sample with attribute
group rank
For each attribute group
Fetch attribute group pattern
Filter by matching patterns for each
attribute group Select the
instances having a maximum pattern match Classify the class
having majority instances
204
Figure 3. Attribute Group Rank Algorithm
3.2
Filter-based
Instance
Selection
Model
for
Classification
On determining the attribute group rank from the training set using the algorithm presented in Figure 2, the next step is to classify the test samples using the proposed filter based instance selection classifier (FIS Classifier). Based on the rank of the attribute groups, the patterns of the test set are matched with the instances in the training set. The attribute group pattern from the test set involving attribute group having the least rank is matched at the first iteration with the attribute group patterns from the training set and the formula to compute the match count is shown in Eq. (2).
where MC represents the match count for the instance I in the dataset D. k represents the number of attributes in the attribute group.
takes the value either 1 representing a match and 0 otherwise.
The instances having the maximum match are extracted or filtered out and are processed for the second step and is shown in Eq. (3).
Here ID represents the instances from the dataset. As the next iteration, the attribute group pattern involving attributes of the attribute group with the next least rank is extracted and are matched with the corresponding attribute group in the set of filtered instances. Again the instances having maximum match are filtered and extracted for the next iteration. This process continues until all the attribute groups are processed. Finally, the process ends up with the set of instances as a result of filtering at each iteration. Finally, the test sample can be classified into a class in the filtered dataset having maximum instances and the formula to compute the class label is shown in Eq. (4).
Here represents the test instance and represents the instance count of the particular class.
However, in some rare cases, the two classes may have the same maximum instance count. In such situations, the average match count for each class is computed and the class having maximum value is predicted as the class label for the given input test sample. The formula is shown in Eq. (5).
Here, represents the number of instances at each class label. Also, if there is no attribute group pattern match at any of the iteration, the specific iteration can be skipped and can be proceeded with the next successive iterations.
The algorithm for the proposed filter-based instance selection model is presented in Figure 4
Figure 4. Filter-based Instance Selection Classifier
Input : Set of training data with n attributes and m groups D, Unpredicted Test Sample, Attribute Group Ranks
Output : Predicted Class Label
ProcedureFIS_Classifier
Begin
n = number of attributes m = number of attribute group For i = 1 to m
Sort attribute ranks based on Attribute_Group_Rank(i) End For
//Initially filtered instances contains all the instances of the dataset Filtered_Insance (D) = Instances (D)
//For each attribute group rank
For i = 1 to m
//Fetch Pattern(i) from the attributes corresponding to the attribute group i of the test sample
Pattern(i)=attribute_valuestest(i); Temp_Instance (D) = Filtered_Insance (D); While end of the recordinTemp_Instance (D)
//Select the instances having maximum match count
k is the number of attributes in a particular attribute group For j = 1 to k
If (attribute_valuetest(j) = attribute_valueD(j)) MC++;
End If End For
End While
//If the match count is 0 then skip the iteration
If MC != 0
//Filter the instance by selecting them having maximum match count
;
End IF End For
Calculate the number of instances for each class label from the final filtered instances
//Class having the maximum number of instances are predicted as class label for the test sample
;
If two or more class labels are predicted
End If
End Function
Input : Set of training data with n attributes and m groups
Output : Gi – Attribute Group Rank ProcedureAttributeGroupRank
Begin
n = number of attributes m = number of attribute group For i = 1 to n
Compute Person's Correlation for ith attribute with a class attribute End For
Sort the attributes based on the correlation score For i = 1 to n
// Assign the ranks based on the attribute correlation score Attribute_Rank(i) = i;
// Compute the rank score using inversion Attribute_RScore(i) = 1/Attribute_Rank(i); End For
// Compute the average of rank score For i=1 to m
Sum_Score = 0; p = 1;
// p is the number of attributes in each group While p!=NULL
Sum_Score = Sum_Score + Attribute_Score(p); p++;
End While
Attribute_Group_Score (i) = Sum_Score/p;
End For
Sort the attributes groups based on the average attribute group score For i=1 to m
//Assign the ranks for the attribute group based on the score Attribute_Group_Rank(i) = i;
205 Several datasets have the set of attributes that can be grouped under
some characteristics with varied significance level. The attribute group rank with filter-based instance selection model produces effective results for such datasets and as the method minimizes its complexity at each iteration by filtering the instances, the method is more suitable for soil datasets.
4. EXPERIMENTAL ANALYSIS
An experimental analysis for the proposed model has been presented in this section. Dataset used for the experimental study, illustration for the proposed model and results analysis are presented in detail.
4.1 Dataset Used
For the proposed study, the soil database at the Pollachi region available at the Department of Agriculture, Cooperation and Farmers Welfare under the Ministry of Agriculture and Farmers Welfare, Government of India [25] has been utilized. The dataset includes 6718 soil data samples with 3452 samples from Pollachi north surrounding with 49 villages and 3266 samples from Pollachi south region surrounding with 29 villages by eliminating the samples having missing values. The database contains 12 attributes such as potential of Hydrogen (pH), organic carbon (OC), electrical conductivity (EC), nitrogen (N), phosphorus (P), potassium (K), sulfur (S), zinc (Zn), iron (Fe), copper (Cu), manganese (Mn) and boron (B) along with the class attribute. The class attribute has 7 classes based on the suitability and fertility of the soil such as very low, low, moderately low, moderate, moderately high, high and very high. The 12 attributes are grouped under four categories such as physical parameter, macronutrients, micronutrients 1, and micronutrients 2. The attribute groups, attribute names and the attribute parameters are presented in Table 1.
Table 1. Attribute Groups and the Attribute Values
Attribute Group
Attribute Name Attribute Parameter Value Physical
Parameter
Potential of Hydrogen (pH) AS - Acid Sulphate, SrAc - Strongly acidic, HAc - Highly Acidic, MAc - Moderately Acidic, SlAc - Slightly Acidic, MAl - Moderately Alkaline, N - Neutral,
SlAl - Strongly Alkaline Organic Carbon (OC) L - Low, VL- Very Low,
M - Medium, H - High, VH - Very High
Electrical Conductivity (EC) N- Normal, M – Medium, H- High, VH- Extreme Macro
Nutrients
Nitrogen (N) L - Low, VL- Very Low, M - Medium, H - High, VH - Very High Phosphorus (P) L - Low, VL- Very Low,
M - Medium, H - High, VH - Very High Potassium (K) L - Low, VL- Very Low,
M - Medium, H - High, VH - Very High Micro
Nutrients1
Sulfur (S) D - Deficient, S – Sufficient Zinc (Zn) D - Deficient, S – Sufficient Iron (Fe) D - Deficient, S – Sufficient Micro
Nutrients1
Copper (Cu) D - Deficient, S – Sufficient Manganese (Mn) D - Deficient, S – Sufficient Boron (B) D - Deficient, S – Sufficient
4.2 Illustration
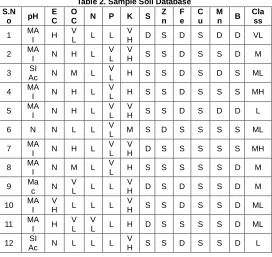
For an illustration of the proposed model, the soil database at Pollachi north region available at the Department of Agriculture, Cooperation and Farmers Welfare under the Ministry of Agriculture and Farmers Welfare, Government of India [25] has been utilized. The sample database is shown in Table 2.
Table 2. Sample Soil Database S.N
o pH E C
O
C N P K S Z n
F e
C u
M n B
Cla ss
1 MA
I H
V
L L L V
H D S D S D D VL
2 MA
I N H L
V L
V
H S S D S S D M
3 SI
Ac N M L
V
L H S S D S D S ML
4 MA
I N H L
V
L H S S D S S S MH
5 MAI N H L VL H V S S D S D D L
6 N N L L V
L M S D S S S S ML
7 MA
I N H L
V L
V
H D S S S S S MH
8 MAI N M L VL H S S S S S D M
9 Ma
c N
V
L L L V
H D S D S S D M
10 MA
I V
H L L L
V
H S S D S S D ML
11 MA
I H
V L
V
L L H D S S S S D ML
12 SI
Ac N L L L
V
H S S D S S D L
As the first phase, the attribute group rank must be computed using the Pearson correlation coefficient as a base. The dependency between each attribute and the class attribute is computed and is denoted as a correlation score. Based on the scores, the ranks are assigned. The ranks are then converted to ranks scores. The ranks scores are averaged to compute the attribute group score and with which the attribute group ranks are assigned for further classification. The values obtained on computing attribute group rank are presented in Table 3.
Table 3. Attribute Group Rank Computation
Attribute Group
Attribut e Name
Attribute Correlati on Score
Attribut e Rank
Attribut e Rank
Score
Attribut e Group Score
Attribut e Group
Rank Physical
Paramet er
pH 0.497 2 0.5000
0.2315 2
OC 0.069 9 0.1111
EC 0.045 12 0.0833
Macro Nutrients
N 0.397 6 0.1667
0.5000 1
P 0.620 1 1.0000
K 0.472 3 0.3333
Micro Nutrients
1
S 0.304 7 0.1429
0.1476 4
Zn 0.065 10 0.1000
Fe 0.399 5 0.2000
Micro Nutrients
2
Cu 0.065 11 0.0909
0.1553 3
Mn 0.456 4 0.2500
B 0.167 8 0.1250
206
Table 4. Test Samples to be Classified
S.N o pH
E C
O
C N P K S Z n F e C u M n B
Cla ss
1 SIAc N VL L L VH S S D S S D M
2 MA
I N M L
V L
V
H S S D S S S MH
The results obtained for the proposed filter-based instance selection model at all the iterations are shown in Table 5.
Table 5. Classification of Test Samples at all Iterations using Filter Based Instance Selection Model
S. N o p H E C O
C N P K S Z n F e C u M n B
Cl as s
Test Sample 1
Iteration 1
Rank 1 Attribute Group : Macro Nutrients
Attribute Group Pattern : (L, L, VH)
1 M
AI H VL L L
V
H D S D S D D VL
9 M
ac N VL L L
V
H D S D S S D M
10 M
AI V
H L L L
V
H S S D S S D ML
12 SI
Ac N L L L
V
H S S D S S D L
Iteration 2
Rank 2 Attribute Group : Physical Parameters
Attribute Group Pattern : (SIAc, N, VL)
9 M
ac N
V
L L L
V
H D S D S S D M
12
SI A c
N L L L V
H S S D S S D L
Iteration 3
Rank 3 Attribute Group : Micro Nutrients2
Attribute Group Pattern : (S, S, D)
9 M
ac N VL L L
V
H D S D S S D M
12 Ac SI N L L L H V S S D S S D L
Iteration 4
Rank 4 Attribute Group : Micro Nutrients2
Attribute Group Pattern : (S, S, D)
12 SI
Ac N L L L
V
H S S D S S D L
Test Sample 2
Iteration 1
Rank 1 Attribute Group : Macro Nutrients
Attribute Group Pattern : (L, VL, VH)
2 M
AI N H L
V L
V
H S S D S S D M
5 M
AI N H L
V L
V
H S S D S D D L
7 M
AI N H L
V L
V
H D S S S S S
M H
Iteration 2
Rank 2 Attribute Group : Physical Parameters
Attribute Group Pattern : (MAI, N, M)
2 M
AI N H L
V L
V
H S S D S S D M
5 M
AI N H L
V L
V
H S S D S D D L
7 M
AI N H L
V L
V
H D S S S S S
M H
Iteration 3
Rank 3 Attribute Group : Micro Nutrients2
Attribute Group Pattern : (S, S, S)
7 M
AI N H L
V L
V
H D S S S S S
M H
Iteration 4
Rank 4 Attribute Group : Micro Nutrients2
Attribute Group Pattern : (S, S, D)
7 M N H L V V D S S S S S M
AI L H H
In iteration 1, the pattern (L, L, VH) corresponding to the macronutrients group having rank 1 from the test sample 1, is compared with the macronutrients group of the training samples. On comparison, the instances with sample numbers such as <1, 9, 10, 12> having the match are filtered and are selected for the next step. During iteration 2, on comparing the pattern (SIAc, N, VL) corresponding to physical parameters group having rank 2 of the test sample 1, is compared with that of the training samples and the instances with sample numbers such as <9, 12> having the maximum match as (SIAc, N) and (N, VL) are filtered and selected for the next step. With iteration 3, the instance with sample numbers such as <9, 12> having the match is filtered out on comparing the pattern (S, S, D) corresponding to micro nutrients2 group having rank as 3 of the test sample 1 with the training samples. Finally, the iteration 4 provides the instance with sample number <12> as a final output by comparing the pattern (S, S, D) of the test sample and the training samples corresponding to the micronutrients 1 group with rank 4. Thus, as the final instance corresponds to class L (low), L is predicted as a class label for the test sample 1. Similarly, on evaluating the iterations using the proposed filter based instance selection classifier, it is predicted that the test sample 2 corresponds to the class label MH (moderately high).
4.3 Results and Discussion
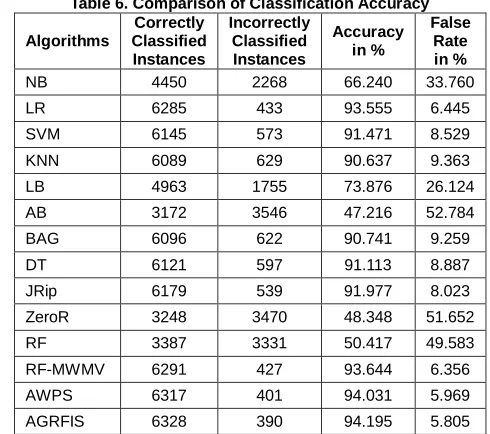
The analysis has been made for the proposed attribute group rank with a filter based instance selection model (AGRFIS) for effective classification of soil dataset of the Pollachi region. The proposed model is compared with existing classifiers such as Naïve Bayes (NB), Logistic Regression (LR), Support Vector Machine (SVM), K-Nearest Neighbour (KNN), Logistic Boost (LB), AdaBoost (AB), Bagging (BAG), Decision Table (DT), RIPPER (JRip), Zero R Classifier (ZeroR), Random Forest (RF), Random Forest with Multiple Weight Based Majority Voting (RF-MWMV) [22], Average Weighted Pattern Score (AWPS) [23]. The number of instances that are correctly classified and incorrectly classified, accuracy and false rate for the existing and proposed models are presented in Table 6.
Table 6. Comparison of Classification Accuracy
Algorithms Correctly Classified Instances Incorrectly Classified Instances Accuracy in % False Rate in %
NB 4450 2268 66.240 33.760
LR 6285 433 93.555 6.445
SVM 6145 573 91.471 8.529
KNN 6089 629 90.637 9.363
LB 4963 1755 73.876 26.124
AB 3172 3546 47.216 52.784
BAG 6096 622 90.741 9.259
DT 6121 597 91.113 8.887
JRip 6179 539 91.977 8.023
ZeroR 3248 3470 48.348 51.652
RF 3387 3331 50.417 49.583
RF-MWMV 6291 427 93.644 6.356
AWPS 6317 401 94.031 5.969
AGRFIS 6328 390 94.195 5.805
207
Figure 5. Classification Accuracy Comparison
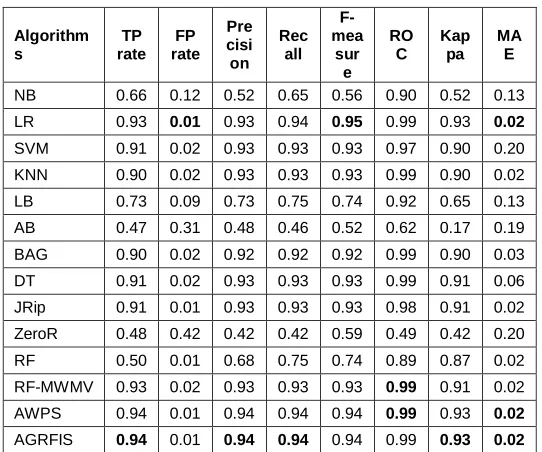
A detailed statistical analysis has been made for the proposed method and is compared with the other existing methods [26]. The values of statistical measures such as TP rate, FP rate, Precision, Recall, F-measure, Receiver Operating Characteristics (ROC), Kappa and Mean Absolute Error (MAE) for all the models are presented in Table 7.
Table 7. Statistical Analysis of Classification Results
Algorithm s
TP rate
FP rate
Pre cisi on
Rec all
F-mea
sur e
RO C
Kap pa
MA E
NB 0.66 0.12 0.52 0.65 0.56 0.90 0.52 0.13 LR 0.93 0.01 0.93 0.94 0.95 0.99 0.93 0.02
SVM 0.91 0.02 0.93 0.93 0.93 0.97 0.90 0.20 KNN 0.90 0.02 0.93 0.93 0.93 0.99 0.90 0.02 LB 0.73 0.09 0.73 0.75 0.74 0.92 0.65 0.13 AB 0.47 0.31 0.48 0.46 0.52 0.62 0.17 0.19 BAG 0.90 0.02 0.92 0.92 0.92 0.99 0.90 0.03 DT 0.91 0.02 0.93 0.93 0.93 0.99 0.91 0.06 JRip 0.91 0.01 0.93 0.93 0.93 0.98 0.91 0.02 ZeroR 0.48 0.42 0.42 0.42 0.59 0.49 0.42 0.20 RF 0.50 0.01 0.68 0.75 0.74 0.89 0.87 0.02 RF-MWMV 0.93 0.02 0.93 0.93 0.93 0.99 0.91 0.02 AWPS 0.94 0.01 0.94 0.94 0.94 0.99 0.93 0.02
AGRFIS 0.94 0.01 0.94 0.94 0.94 0.99 0.93 0.02
From the statistical analysis, it is clear that the proposed model provides the best results for 5 statistical measures out of 8 measures. The classifiers such as LR, RF-MWMV, and AWPS are also showing better results in a few of the statistical measures.
Figure 6. Soil Classification in Pollachi Region
From the experimental analysis, out of 6718 soil samples in Pollachi region, 2389 samples are classified as moderately low category, 1903 samples correspond to moderate category, 843 samples are classified as low, 828 samples correspond to very low category, 490 samples correspond to moderately high nutrient soil, 142 samples and 123 samples corresponds to high and very high categories respectively. The classified soil types for the Pollachi region is shown in Figure 6.
On average, 36% of the soil in the region has many micro and macronutrient deficiency with moderately alkaline type and thus corresponds to a moderately low category. 28% of the soil type belongs to the moderate category as the soil has major micronutrient and minor micronutrient deficiency. 25% of the soil has macronutrients, micronutrients, and organic carbon deficiency and thus they are classified as a low and very low category. 11% of the soil samples belong to moderately high, high and very high types with minimum or no nutrient deficiency. Thus, productivity can be increased by choosing appropriate crops suitable for the moderate and moderately low soil categories or the nutrients in the soil can be increased by consuming appropriate fertilizers.
5. CONCLUSION
Soil is the most significant part of the agriculture field. Classifying the soil based on the nutrients present in the soil such as nitrogen, potassium, phosphorus, sulphur, zinc, iron, copper, manganese and boron along with its physical properties such as pH value, organic carbon and electric conductivity of soil, highly helpful for increasing the agriculture productivity. This paper introduces a novel classifier for soil data that makes use of attribute group rank with filter based instance selection. Attribute group rank aids us to identify the significant attribute group for classifying the soil data by selecting the instances. From the experimental analysis, it is shown that the proposed model has better classification accuracy than many other existing classifiers under study. The proposed model has 91.2% accuracy, 94.4% precision and 94.3% recall in classifying the soil data of the Pollachi region. The future work concentrates on analyzing the soil types for the other regions in and around Coimbatore. Also, in the future, predicting the crops for the particular soil type along with the weather and climatic conditions has to be carried out which is significantly required for increasing agriculture productivity.
R
EFERENCES[1] G.Murugesan, Dr.B.Radha, ―A Study on Various Types of Farming and Factors Affecting Crop Growth and Yield‖, International Journal Of Innovative Technology And Creative Engineering, Vol.9, No.04, 2019.
[2] R. M. Yuvaraj, M. Rajeswari, ―GIS Based Soil Fertility Status of Pudukkottai District‖, International Journal of Interdisciplinary Research and Innovations, Vol. 6, Issue 2, pp. 25-35, 2018
[3] K. Samundeeswari, Dr.K.Srinivasan , ―Data Mining Techniques In Agriculture Prediction Of Soil Fertility‖ , International Journal of Science and Engineering Research Volume 8 Issue 4, April-2017. [4] Troug AE. Soil reaction influence on availability of plant nutrients. Soil
Sci Soc Am J. 1946;11, pp. 305-308.
[5] Jegadeeswari, D., Muthumanickam, D., Chitdeshwari, T. and Shukla, A.K., 2017. Fertility Mapping of Available Micronutrients Status in the Soils of Dharmapuri District, Tamil Nadu, Using GIS and GPS Techniques. Madras Agricultural Journal, 104(10/12), pp.330-334. [6] D. L. Gupta, A. K. Malviya , Satyendra Singh , ―Performance Analysis
of Classification Tree Learning Algorithms‖, International Journal of Computer Applications (0975 – 8887) Volume 55– No.6, October 2012
[7] Gholap, J., Ingole, A., Gohil, J., Gargade, S. and Attar, V., 2012. Soil data analysis using classification techniques and soil attribute prediction. arXiv preprint arXiv:1206.1557.
208 [9] G.Sowmiya, Entrepreneurial management and prospects of contract
broiler poultry farms in Coimbatore district, Thesis dissertation, Anna University, 2017.
[10] Dildarkhan T. Pathan, Pushkar D. Joshi, Prof. S. U. Balvir,(2014), "Prediction of soil Quality for Agriculture", IRJSSE International Research Journals of sustainable Science & engineering, Vol. 2, Issues 3, 2014.
[11] K. Samundeeswari, K. Srinivasan, Soil Data Analysis and Crop Yield Prediction in Data Mining using R – Programming, International Journal of Innovative Technology and Exploring Engineering, Volume-9 Issue-3, January 2020.
[12] R. Jayalakshmi, M. Savitha Devi, Relevance of Machine Learning Algorithms on Soil Fertility Prediction Using R, International Journal of Computational Intelligence and Informatics, Vol. 8: No. 4, March 2019
[13] Ramesh, V. and Ramar, K., 2011. Classification of agricultural land soils: a data mining approach. Agricultural Journal, 6(3), pp.82-86. [14] S. Ghosh, S. Koley (2014)―Machine Learning for Soil Fertility and
Plant Nutrient Management using Back Propagation Neural Networks‖ International Journal on Recent and Innovation Trends in Computing and Communication, 2(2), pp.292-297.
[15] Thakkar, R., Kayasth, M. and Desai, H., 2014. Rule based and association rule mining on agriculture dataset. International Journal of Innovative Research in Computer and Communication Engineering, 2(11), pp.6381-6384.
[16] Poongodi, S. and Rajesh Babu, M., 2019. Analysis of crop suitability using clustering technique in Coimbatore region of Tamil Nadu. Concurrency and Computation: Practice and Experience, 31(14), pp.5294.
[17] Geetha, M.C.S., 2015. Implementation of Association Rule Mining for different soil types in Agriculture. International Journal of Advanced Research in Computer and Communication Engineering, 4(4), pp.520-522.
[18] Chilwal, B. and Mishra, P.K., 2020. A Survey of Fuzzy Logic Inference System and Other Computing Techniques for Agricultural Diseases. In International Conference on Intelligent Computing and Smart Communication 2019 (pp. 1-6). Springer, Singapore.
[19] Manjula, E. and Djodiltachoumy, S., 2017. Data mining technique to analyze soil nutrients based on hybrid classification. International Journal of Advanced Research in Computer Science, 8(8), pp.505-510.
[20] RamaKrishna, B.V. and Satyanarayana, B., 2016. Agriculture soil test report data mining for cultivation advisory. Int. J. Comput. Appl, pp.2250-1797.
[21] Shazmeen, S.F., Baig, M.M.A. and Pawar, M.R., 2013. Performance evaluation of different data mining classification algorithm and predictive analysis. Journal of Computer Engineering, 10(6), pp.01-06.
[22] P.S.Ramila Rajaleximi, M.S.Irfan Ahmed, Ahmed Alenezi, 2019.―Classification of Imbalanced Class Distribution using Random Forest with Multiple Weight Based Majority Voting for Credit Scoring‖, International Journal of Recent Technology and Engineering, Vol.7, Issue-6S5, pp.517-526.
[23] Bama, S.S. and Saravanan, A., 2019. Efficient Classification using Average Weighted Pattern Score with Attribute Rank based Feature Selection. International Journal of Intelligent Systems and Applications, 11(7), p.29.
[24] Rajaleximi, P.S.R., Ahmed, M.S.I. and Alenezi, A., 2019. Feature Selection using Optimized Multiple Rank Score Model for Credit Scoring. International Journal of Intelligent Engineering and Systems, 12(2), pp.74-84.
[25] Soil Health Management, Soil Health Card Portal, Department of Agriculture, Cooperation and Farmers Welfare under Ministry of Agriculture and Farmers Welfare, Government of India. https://soilhealth.dac.gov.in/