1706
Performance Analysis Of Rain Attenuation Of An
Earth Space Path
A.Usha, G.Karunakar
Abstract— Modelling for rain attenuation is one of the important design criteria for reception Satellite signals. Particularly for Navigational data reception, accuracy being the most important design parameter, receiver design has to apply real time corrections and localized Modelling helps in that direction. At higher frequencies the design complexity of the receiver increases because of higher bandwidth resulting in higher costs implementation. Rain Attenuation increases with the frequency and become one of the most important and critical parameter in the design. In this paper, rain attenuation is estimated for cities in the State of Andhra Pradesh, India, using two different models like ITU-R, Moupfouma. The cities are typically chosen to exhibit varying climatic conditions viz., Visakhapatnam, Vijayawada and Tirupati. The estimation is done for two different frequencies 8 GHz (X- band),12 GHz (Ku- band).
Index Terms— ITU-R, Ku band, Modelling, Moupfouma, Rain attenuation, Satellite X
—————————— ——————————
1
I
NTRODUCTIONIn satellite communication rain causes the most crucial effect in communication degradations and outage in any systems operating at frequencies above 7 GHz applications particularly in the tropical and equatorial climatic regions. Water freezes at 00C mostly in the form of vapour in the air, and when the air temperature falls below 00C the hydrometeors are formed as ice that melts and falls as rain [1]. Because of the moisture content this rain affects the Satellite communication links, both Up and Down. Thermal emission increases the background noise level and scattering and absorption by hydrometeors. Scattering and absorption causes rainfall attenuation in different spectral regions. When the rain drop diameter approaches the size of the operating wavelength rain attenuates the upper spectrum of frequencies. The severity of rain impairment changes with frequency and with different regional locations [11]. Rainfall occurring over satellite link significantly affects transmission signal strength and system performance. Rain attenuation can be statistically estimated at different frequencies, from locations and path geometries, meteorological data and with proper modelling models. Rain causes undesired absorption and results in the variation of the signal strength [5]. Prediction of rain attenuation is grouped into two categories such as physical method (requires input parameters) and empirical method (database for different climatic zones of research). For any reliable communication system, unavailability during a year has to be kept at 0.01 percent, this results the availability of 99.99 percent during a year. So, rainfall with one-minute integration time is very important parameter to predict attenuation 0.01% of time availability [15].
————————————————
• A. Usha, Research Scholar, Department of ECE, GITAM
Deemed to be University, Visakhapatnam, India, E-mail: [email protected]
• G. Karunakar, Associate professor, Department of ECE, GITAM
Deemed to be University, Visakhapatnam, India, E-mail:
For proper prediction of rain attenuation and improving the link design, rain fade mitigation techniques like automatic power control, signal processing and site diversity methods are used [9]. This study considers. This study considers two different rain attenuation models, ITU-R and Moupfouma for two different frequencies of different bands for evaluating the frequency dependence of rain effects on Satellite communications signals.
2. R
AINA
TTENUATIONM
ODELSTwo models are considered ITU-R is universally accepted
model and Moupfouma model suitable mostly for tropics In this study three cities are chosen, which are at different latitudes, station heights, elevation angles. Performance of two models at different percent of exceedance are analysed and compared for measured values vis-a-vis simulated values. This paper publishes the results from the simulation for the frequencies covering two different frequency bands of lower spectrum
2.1 ITU–R Model
1707 model of non-stationary events using the Box-Jenkins
approach available and data at low latitude tropical station model are compared with the measured values of ITU-R model results and analyzed in terms of prediction error [12]. Fig1. Gives Schematic representation of an Earth Space path input parameters of the attenuation prediction where A, B, C, D give the values of snow, rain height, rain and Earth–Space path respectively.
Fig.1. Schematic representation of an Earth–Space path
Below procedure gives estimation of the long–term statistics of the slant path rain attenuation at a given location for frequencies up to 55GHz.
The parameters required are:
R0.01: point rainfall rate for the location for 0.01%of an Average year (mm/h),
hs: height above mean sea level of the earth station(km), hR : height of rain (km),
h0: 0° C isotherm height (km), ζ: elevation angle (degrees), f: frequency (GHz),
Re: effective radius of the Earth (8500 km)
The following steps are recommended (ITU-R P.839) for calculation of Attenuation
hR = h0 + 0.36 km (1) Slant path Ls= (hR-hs) / sinζ km if ζ ≥5
0
(2)
Horizontal Projection LG = Ls cosζ km (3) R0.01 can be calculated from the recommendations of ITU-R P.837
The specific attenuation γR = k (R 0.01)
α dB/km (4)
k and α are regression coefficients and depend on frequency, polarization, rain drop size polarization and temperature
k = [kH +kV+( kH-KV) cos2ζcos(2t)]/2 (5) α =[kHαH +kVαV + (kHαH-kVαV) cos2ζcos(2t)]/2k (6) t=polarization tilt angle with respect to horizontal Horizontal path adjustment factor
r0.01 =1/ (1+0.78√(LGγR/f)0.38(1-e -2L
G)) (7) Adjusted rainy path length
LR = LGr0.01/cosζ for δ > 0 (8) Ls = (hR-hs)/sinζ for δ ≤ 0 (9) Vertical reduction factor
v0.01 =1/ (1+√sinζ [31(1- e
-ζ/1+χ) √(L RγR/f
2
)-0.45] (10)
χ =36- |Փ|, for |Փ| <360 (11) χ= 0, for |Փ| ≥ 360
(12)
Effective path length through rain
LE= LRv0.01 (13)
Predicted attenuation
A0.01 = γRLE (14)
Rain attenuation for other percentages exceedance (from 0.001% to 5%)
Ap = A0.01 (P / 0.01)
– (0.655+ 0.033ln (p) -0.045ln (A0.01)-β(1-p) sinζ) (15)
p = percentage probability of interest and βis given by for p≥1%, β =0 (16 for p<1%, β =0if |Φ| ≥360
(17) β = -0.005(|Φ|) – 36 for ζ>250 and |Φ| <360
(18) β = -0.005((|Φ|) - 36 +1.8- 4.25sinζ for ζ<250
and |Φ|<360
(19)
2.2 Moupfouma Model
Rain rate modelling can be done using cumulative distribution with a lognormal behavior at lower rain rates and as a gamma distribution at higher rain rates. Requires three parameters λ, γ and R0.01 and considers geographical and climatic features. Rainfall rate with lower integration times provides more information for accurate prediction of rain fall attenuation. This model yields better results for the equatorial regions. It is analytical model and attenuation can be calculated using single empirical equation. These papers proposed prediction of rain attenuation using Moupfouma model one-minute rainfall rate at 0.01% of the time good preliminary design tool for both terrestrial and earth- satellite microwave links results obtained [5] [7] [14]. Designed refined Moupfouma model purposely for tropical zones, for rain rate maps and ITU-R 618 for the rain attenuation maps have been developed for 0.1 and 0.01% of the time over Nigeria, South Africa [11].
Attenuation A(dB) = (kRαu(p)) (R0.01/Rp) 0.38/Ls-0.25
/ (1+ε(p/0.01)-0.36
Ls m
)* Ls (20) where
m=1+1.4*10-4f1.76 loge (Ls) (21)
f= frequency in GHz, Ls=Slant path length (km)
ε=0 if l<5 km and f<25 GHz and ε=0.03 for all other cases k, α are constants
p=percentage of time Rp=Rain rate for P% of time
HR = 4 0<Ø<36 0
= 4- 0.075(Ø -36) Ø > 360 (22) H0 = Location from mean sea level
Ls = (HR –H0) / sinζ for ζ <5 0
= (HR- H0) / [sin2ζ+2(HR-H0)/8500]
0.5 + sinζ) for ζ ≥ 50
(23) This paper explained that the parameter U governs the slope of rain rate cumulative distribution (CD). The value of U depends on the local climatic conditions and geographical features [4].
For tropical localities U = (4ln10/R0.01) exp (-λ(r/R0.01)) γ
(24)
where λ=1.066, γ = 0.214
1708 predominance of convective rains (high rain rates for short
durations) cause steeper distribution. The Fig2, given below shows the relationship between rain rate and U
Fig.2. Rain rate Vs slope of rain rate
3 D
ATA ANALYSISThe rain rate measured from the Indian Meteorological Data for 5 years (2014-2019) [17] for three locations is used. However, the measured value of rain rate is less than ITU-R values.
Table 1 gives the details of the Cities locations and view angles and rain rate exceeded for 0.01% for an average year from IRNSS Satellites.
TABLE 1
Ground station and satellite data for the cities
City Visakhapatnam Vijayawada Tirupati
Station height(km)
0.004 0.032 0.162
Slant path(km) ITU-R
Moupfouma 3.72
2.15
5.75 3.99
10.47 8.64 Latitude0(N) 17.69 16.52 13.59 Longitude0(E) 83.22 80.63 79.42
R0.01 from local
data(mm/h)
92.4 79.5 87.7
R0.01from ITU-R
map(mm/h)
95 95 95
3.1 Visakhapatnam
Visakhapatnam city coordinates are 17.6883° N latitude, and 83.2186° E longitude. It has a tropical climate. Summer has more rain fall when compared with winter. In a year, the average rainfall is 1008 mm.
TABLE 2A Attenuation at 8GHz
Rain Rate(mm/h)
Attenuation(dB)
ITU Moupfouma
Predicted Measured Predicted Measured
5 -5.2 -5.3 -22.5 -22.4
15 -4.7 -4.8 -16.9 -16.8
35 -3.5 -3.6 -12.7 -12.7
45 -2.8 -2.9 -11.6 -11.5
55 -2 -2.1 -10.6 -10.5
65 -1.1 -1.2 -9.9 -9.8
80 -0.6 -0.7 -9 -8.9
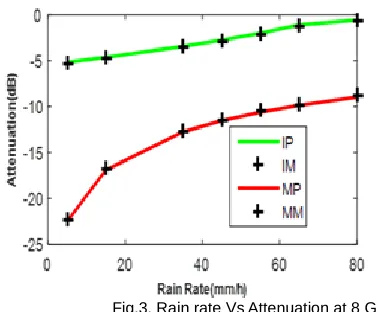
Fig.3. Rain rate Vs Attenuation at 8 GHz
For the frequencies of 8 GHz the values of rain rates considered are less than 80mm/h as shown in Table2a. Using these rain rates for both methods measured and predicted attenuation values are plotted in Fig.3. The difference between lower and higher rain rates for both methods is around 11-14 db. The percentage of error in case of ITU-R varied from 2.45 to 17.14 and in case of Moupfouma varied from 0.4 to 0.82.
TABLE 2b Attenuation at 12 GHz
Rain Rate(mm/h)
Attenuation (dB)
ITU Moupfouma
Predicted Measured Predicted Measured
5 0.36 0.25 -16.05 -15.96
15 0.87 0.75 -11.59 -11.5
25 2 1.88 -9.58 -9.49
35 2.63 2.52 -8.29 -8.2
45 3.35 3.24 -7.35 -7.27
55 4.19 4.08 -6.63 -6.55
Fig.4. Rain rate Vs Attenuation at 12 GHz
1709 3.2 Vijayawada
Vijayawada is located at 16.5193°N 80.6305°E. The average annual rainfall is 921.5 millimeters (36 in).
TABLE 3a Attenuation at 8 GHz
Rain Rate(mm/h)
Attenuation(dB)
ITU Moupfouma
Predicted Measured Predicted Measured
5 -5.45 -4.51 -22.57 -23.26
15 -1.61 -0.71 -16.57 -17.24
35 1.31 2.18 -12.14 -12.77
45 1.84 2.7 -10.87 -11.48
55 2.89 3.73 -9.91 -10.5
80 5.55 4.74 -8.23 -8.77
Fig.5. Rain rate Vs Attenuation at 8 GHz
The attenuation values increase considerably (From Table 3a, Fig.5.) for the rain rate less than 80mm/h. The ITU-R values are significant than Moupfouma. The measured percentage of error in attenuation using ITU-R method varied from 20.8 to 40 and in case of Moupfouma method varied from 2.97 to 6.17.
TABLE 3 b Attenuation at 12 GHz
Rain Rate(mm/h)
Attenuation(dB)
ITU Moupfouma
Predicted Measured Predicted Measureded
5 2.76 1.95 -14.56 -13.87
15 6.25 5.48 -9.68 -9.01
35 7.28 6.52 -6.03 5.4
45 8.83 8.1 -5.03 -4.42
55 9.3 8.57 -4.23 -3.65
65 10.21 9.49 -3.62 -3.05
75 11.77 11.03 -3.18 -2.63
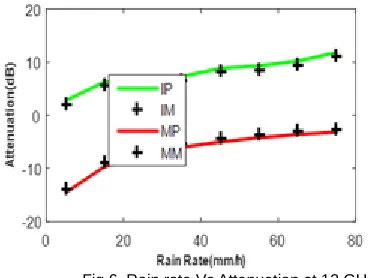
Fig.6. Rain rate Vs Attenuation at 12 GHz
From the above Table3.b, Fig 4.b, the attenuation values are considered up to 80mm/h of rain rate. Almost 6dB of attenuation difference between two methods are maintained during the above rain rates. The measured percentage of error in attenuation using ITU-R method varied from 6.23 to 41.54 and in case of Moupfouma method varied from 4.97 to 20.91.
3.3 Tirupati
Tirupati is located at 13.65°N 79.42°E. Precipitation here averages 905 mm during a year.
From the Table 4a, Fig.6., the rain rates considered are below 80mm/h. the attenuation difference in ITU-R, Moupfouma are around 7, 14 dB respectively. The measured percentage of error in attenuation using ITU-R method varied from 3.62 to 42.1 and in case of Moupfouma method varied from 1.85 to 8.36.
TABLE 4a Attenuation at 8 GHz
Rain Rate(mm/h)
Attenuation(dB)
ITU Moupfouma
Predicted Measured Predicted Measured
5 1.52 1.07 -18.12 -17.79
15 6.48 6.05 -11.92 -11.6
35 8.94 8.53 -7.35 -7.05
65 10.71 10.32 -4.31 -4.04
80 11.17 10.78 -3.37 -3.11
1710 TABLE 4b
Attenuation at 12 GHz
Rain Rate(mm/h)
Attenuation(dB)
ITU Moupfouma
Predicted Measured Predicted Measured
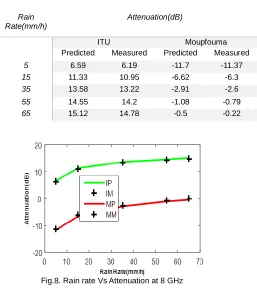
5 6.59 6.19 -11.7 -11.37
15 11.33 10.95 -6.62 -6.3
35 13.58 13.22 -2.91 -2.6
55 14.55 14.2 -1.08 -0.79
65 15.12 14.78 -0.5 -0.22
Fig.8. Rain rate Vs Attenuation at 8 GHz
The rain rate values considered are below 75mm/h (From Table 4b, Fig.8). The values are almost similar to 8GHz, because the rain rate values considered are lower values in both the cases. The measured percentage of error in attenuation using ITU-R method varied from 2.3 to 6.46 and in case of Moupfouma method varied from 2.9 to 127.
4. Conclusion
Observing the trends in performance of the rain models considered, namely ITU–R and Moupfouma, it can be deduced that based on the Regions Rainfall rate and the rainfall data, it is possible to work on a model that can be applicable for all regions for higher Rain Attenuation prediction. Particularly for the Satellite Earth Path it is important to find optimised attenuation model that ensures receiver performance to higher accuracy in Navigation systems like IRNSS or GPS. During higher rainfall, attenuation value increases due to higher rain drops. Accurate values of attenuation at higher frequencies can be further implemented in the future. In addition to, a hybrid model can be designed integrating advantages of ITU-R model and Moupfouma model that gives better result in both lower and higher frequency range with varying rain rates.
R
EFERENCES[1] E. P. Ogherohwo, B. Bukar and D. D. Baba, ―Effects of Rainfall Attenuation on Frequencies 1 and 3 GHZ in Nigeria‖, International journal of Computers & Technology, volume 15, Number 05, 2016.
[2] P Panchal and R Joshi,―Performance Analysis and Simulation of Rain Attenuation Models at 12–40 GHz Band for an Earth Space Path over Indian Cities‖, Procedia Computer Science ,Vol.79, pages 801 , 2016.
[3] ITU–R Rec ITU-R P.838–3.
[4] M. Fidelo, ―Propagation in the atmosphere and ionised media‖,
Course on basic telecommunication Science ,9Jan-3Feb, 1989. [5] R. Bhattacharya, R. Das, R. Guha, S.D. Barman and A.B.
Bhattacharya, ―Variability of millimetrewave rain attenuation and rain rate prediction: A survey‖, Indian Journal of Radio & Space Physics Vol. 36, pp. 325-344, August 2007.
[6] R. K. Crane, ―Propagation Handbook for Wireless Communication System Design ―, CRC press LLC, 2003. [7] P. Chandrika, S .V. Bhaskara Rao, N. V. P. Kirankumar and T.
Narayana Rao, ―Review and testing analysis of Moupfouma rain rate model for Southern India‖ Journal of Atmospheric and Solar-Terrestrial Physics ,2015.
[8] K. L. Bashar and M. M. Rashid, ―Performance Analysis of Rain Fades on Microwave Earth-to-Satellite Links in Bangladesh‖, International Journal of Engineering and Technology Volume 4 No. 7, July, 2014.
[9] M. Sridhar, K.P. Raju and Ch .Srinivasa Rao, ―Estimation of Rain Attenuation based on ITU-R Model in Guntur (A.P), India‖, ACEEE Int. J. on Communications, Vol. 03, No. 02, Nov 2012. [10]G. S. Feldhake and L. Ailes-Sengers, ―Comparison of Multiple
Rain Attenuation Models with Three Years of Ka Band Propagation Data Concurrently Taken at Eight Different Locations‖, Online Journal of Space Communication, Issue No. 2, Fall 2002.
[11] J. S. Ojo, M. O. Ajewole, S. K. Sarkar, ―Rain rate and Rain Attenuation Prediction for Satellite Communication in Ku and Ka bands over Nigeria‖, Progress in Electromagnetics Research B, Vol. 5, 207–223, 2008.
[12]M. Sridhar, K. Padma Raju, Ch. Srinivasa Rao, D. Venkata Ratnam, ―Prediction and Analysis of Rain Attenuation using ARIMA Model at Low Latitude Tropical Station‖, International Journal of Advanced Research in Electrical, Electronics and Instrumentation Engineering, Vol. 2, Issue 7, July 2013.
[13] M. J. Singh, S. AlDweik and A. Mustafa, ―Comparison of Rain Attenuation Prediction Models with Measurements Results of Rainfall Rate‖, Journal of Applied Sciences Research, 2014. [14]I. E. Afahakan, K. M. Udofia and M. A. Umoren, ―Analysis of
Rain Rate and Rain Attenuation for Earth-Space Communication Links Over Uyo - Akwa Ibom State‖, Nigerian Journal of Technology Vol. 35 No. 1, January 2016.
[15]D. Y. Choi, J. Y. Pyun, S. K. Noh and S. Woong Lee International Journal of Antennas and Propagation, pp. 137 – 143, 2012. [16]G. N. Ezeh, N. S. Chukwuneke, N. C. Ogujiofor and U. H.
Diala, ―Effects of Rain Attenuation on Satellite Communication Link‖, Advances in Science and Technology Research Journal, Vol. 8, 2014.