Grid Connected Rooftop Solar Pv System: A
Pre-Feasibility Estimation Using Pvsol Premium And
System Advisor Model(Sam)
V. Baby Shalini, Gattu Vinay Goud, Chandragiri Radha CharanABSTRACT: This paper presents a pre-feasibility estimation of a grid connected roof mounted solar PV system on the Roof of the buildings in the campus of JNTUH College of Engineering Jagitial, Telangana, India. The estimation results show that the roof of the various building blocks can accommodate a 550.8KW of grid-connected Solar photovoltaic system and can generate an adequate amount of electrical power as compared to Consumption and mitigate the energy consumption from grid supply as well as reduce the grid dependency. In this paper Design, performance and Financial analysis of the PV system are done by using PV Simulation software’s viz., PV*SOL premium and SYSTEM ADVISORY MODEL(SAM). Similarly, yearly Cumulative financial balance of the system is discussed here considering the concept of NET METERING which gives us the clear idea about the feasibility of the system.
Index Terms: Grid-connected roof top solar PV system, Energy consumption, PV*SOL Premium, System Advisory Model (SAM), Net-Metering, Payback period.
————————————————————
I.
INTRODUCTION
Electrical Energy utilization plays a very significant role in our day to day accomplishments. Supplying reliable and easily accessible power to everyone in a country helps for the development of the nation and by which we can increase our productivity. In India, as of march 31st 2018 of the total installed power generation capacity the share of the thermal resources for the power generation through combustion of coal, gas and diesel is about 64.8% and the share of the renewable energy sources is 33.23% which include hydro, solar, wind and other renewable sources. Since the percentage share of non-renewable energy sources is high it may lead to environmental degradation through greenhouse gas emission which intern lead to the rise in global temperatures. If the same situation persists it may also result in the loss of our resources in the next coming future, which may pose threat to the future generation. so the best supplement for this is the reduction in usage of non-renewable sources and intensify the usage of the sources which are renewable. Countries like India, where energy from sun is available throughout year it is a better option to overcome the present scenario. In the last two decades there is huge increase in the usage of photovoltaics. Many countries during this time established huge PV incubation centre’s which helped many remote and small industries and this become their main origin for the power consumption. AS of December 2017 the capacity of total PV installations in the World have reached above 400GW and is supplying about 2.1 percent of the global electricity demand. As per the solar power analysists, solar power will turn out to be the biggest power resource in the
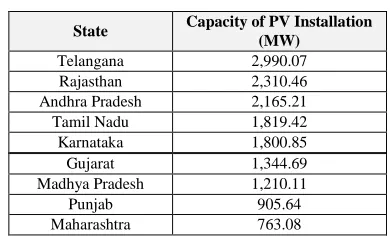
world by 2050. As per the anticipations of the solar power analysts the PV installation may rise nearly to 4000 Giga watts throughout the world and we can expect nearly about 50% of this installations happen in India and China. As per the data gathered from (NREL) many of the states in India have the Solar potential greater than 5.0Kwh/m²/day. So to increase the energy production from these PV sources our government has proposed a project called (JNNSM), which has brought a revolutionary change in the field of PV installations. Table 1 shows the descending order of Solar PV installations as of 31 December 2017 in MW in various states of India.
Table 1: State Viz., Solar PV Installations
State Capacity of PV Installation (MW)
Telangana 2,990.07
Rajasthan 2,310.46
Andhra Pradesh 2,165.21
Tamil Nadu 1,819.42
Karnataka 1,800.85
Gujarat 1,344.69
Madhya Pradesh 1,210.11
Punjab 905.64
Maharashtra 763.08
Regardless of the various initiations took by the government of India through National solar mission for the solar PV capacity addition, growth has been seen only in the addition of large scale Utility based solar PV installations whereas the small scale roof mounted solar PV installations were remained in the initial phase. To redress the balance NET-Metering model has been introduced wherein it address some key issues that lead to the wide spread of the Rooftop solar PV installations. Ronak Sharma and Lata Gidwani[1] graduates of RTU have together worked on the study of the feasibility of grid connected roof mounted solar photovoltaic installations on the university campus hostel buildings using PV simulation software - PVSOL premium and they have suggested that a 234kilowatts of PV installation can full fill all the Electrical load needs and all the investments made will be returned in a Span of eleven years. Yahya Z. Alharthi et al. [2] a team from university of Missouri have published a paper aiming the performance and ————————————————
Mrs. V. Baby Shalini, Assistant Professor in Electrical and
Electronics Engineering Department, JNTUH College of Engineering Jagtial, Email:[email protected]
Gattu Vinay Goud currently pursuing master’s degree program in
Electrical Power Systems, JNTUH College of Engineering Jagtial, Email: [email protected]
Mr. Chandragiri Radha Charan, Assistant Professor in Electrical and
Electronics Engineering Department, JNTUH College of Engineering Jagtial, Email: [email protected]
financial aspects 1.2Megawatts of a commercial PV installation in UAE. To make performance predictions and as well as to estimate the total cost of energy production they have used two different types of PV simulation software’s viz., SAM and PVwatts. R. S. Shivalkaret al. [3] conferred paper which deals with the necessity of incorporating the idea of Net Metering concept into the roof mounted PV installations. Here they have studied the economic viability of a 15kWp PV plant. In Net-Metering(NM) system the generated output from the PV installation is primarily used for the self-utilization and the excess generated output is than fed to the local distribution system and the financial transactions are made on half a yearly or on annual bases.
II.
FEED IN DATA AND SPECIFICATIONS
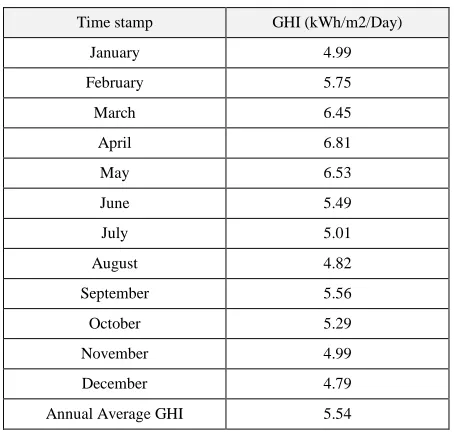
The information related to the solar irradiation data is very important prior to the design of a PV system. JNTUH college of engineering Jagtial (JNTUHCEJ) located in the region nearby kondagattu at approximate latitude and longitude location of 18.66° N, 78.90° E, GHI data of this location is imported from NREL database is as in the Table 2 and the same data is used during the simulation.
Table 2: Monthly solar Irradiation data at JNTUHCEJ
Time stamp GHI (kWh/m2/Day)
January 4.99
February 5.75
March 6.45
April 6.81
May 6.53
June 5.49
July 5.01
August 4.82
September 5.56
October 5.29
November 4.99
December 4.79
Annual Average GHI 5.54
The total connected loads in Campus buildings of JNTUH College of Engineering Jagtial is obtained from the energy auditing data. For the various buildings present in the campus total connected load block viz. is as follows administrative building block has a connected load of 10055.31Kw and for the Academic Block I and II has the total connected loads of 14904 KW and 169296Kw. Campus hostels viz. girls and boys hostel has a connected loads equal to 21994kw and 24631kw and has some other miscellaneous loads. All these connected loads collectively consume an annual energy of 671356 units. Table 3 gives the monthly info of the energy consumption of all the various electric loads present in the entire campus for the academic year 2017-18.
Table 3: Monthly energy consumption Data.
Month Electric load-kWh/month
January 48847.0
February 59063.9
March 60534.0
April 80947.0
May 39869.0
June 29350.0
July 38937.0
August 60726.0
September 72799.0
October 52586.1
November 70156.1
December 57541.0
Annual Consumption 671356.1
A. Specifications of the Photovoltaic modules and inverters:
PV Module: Physical dimensions: Width x Height: 1000mm x 1984mm, Area: 1.98m2
The PV modules considered for the proposed PV system are of 300Wp are made of silicon poly-crystalline. They are manufactured by TATA power solar limited. Series model name of the PV module is TP300, have an efficiency of 15.13%. The ratings of the module are: open circuit voltage VOC is 44.76V and short circuit current ISC is 8.71A. Voltage and current at maximum power PMAX are VMPP is 36.60V and IMPP is 8.20A.
Inverter: Inverter or the Power conditioning unit converts DC power into AC power, here we have considered six inverters of which four are of model PVS-100-TL having AC power rating of 100KW, maximum input voltage is 1000V, nominal DC voltage is 350V, maximum input current is 216A and the other two inverters are of model TRIO-TM-60 having AC power rating 0f 60KW, maximum input voltage is 1000V, nominal DC voltage is 720V, maximum input current is 108A.
III. DESIGN OF ROOF TOP SOLAR PV SYSTEM
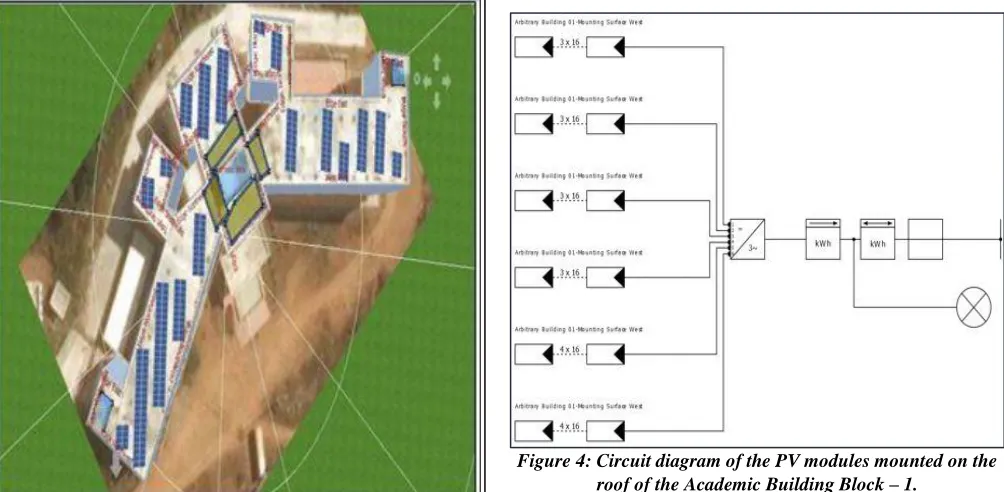
Figure 1: Designed 3-Dimensional outlook of the Academic Building Block-1 with PV modules on the roof.
After designing the existing arbitrary shading objects present on the roof of the building and placing them on the terrain, PV-SOL premium then estimates how frequently the PV panels on the roof are in the shade of the arbitrary objects and then it displays the percentage of shading on each PV module, highly shaded PV modules were removed leaving the shade free PV modules on the roof. 3-Dimensional view, Arial view and Blue print outlook of the designed Academic Building Block-1 with PV modules on the roof facing towards the South are shown in Figure 1,2 and 3.
Figure 2: Arial view of the roof of Academic Building Block-I with solar PV panels and shaded regions.
Figure 3: Blue print view of the solar PV panels on the Roof of Academic Block-I
Summary of the PV system that can be accommodated on Academic Block-I is as given below. The roof of the Academic building block having a total surface area of 2521m2 of which shade free roof area is found to be 1350m2. This area can accommodate a total of 320 number of PV modules of 300W capacity placed at a tilt angle of 18o which is equal to the latitude angle of the location and one inverter of model PVS-100-TL. PV generation output from this installation is 96KW. The configuration of the strings alignment is as shown in figure 4.
Figure 4: Circuit diagram of the PV modules mounted on the roof of the Academic Building Block – 1.
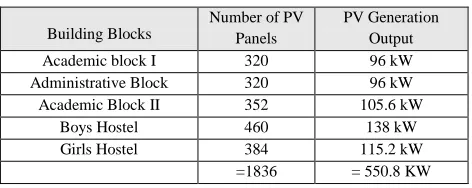
Table 4: Feasible Rooftop PV system capacity on various building blocks of the college
Building Blocks
Number of PV Panels
PV Generation Output
Academic block I 320 96 kW
Administrative Block 320 96 kW
Academic Block II 352 105.6 kW
Boys Hostel 460 138 kW
Girls Hostel 384 115.2 kW
=1836 = 550.8 KW
Thus from the design part analysis it is clear that the available roof area on five different buildings in the campus can accommodate a PV system of 550.8KW capacity with 1836 PV modules. From the simulation results of PVSOL Premium the PV Generator Energy output is 833,838 kWh/year and CO₂ Emissions avoided is 500,303 kg/year.
IV.
PERFORMANCE
AND
FINANCIAL
ANALYSIS
System Advisor Model (SAM) software is refined by the NREL (USA). It analyses the technical as well as economic performances of various solar plants depending upon the particular inputs. The solar resource library in SAM provides the weather data information of particular location here user has a provision where in one can download the latest weather files of desired location from NSRDB data base. User can select the desired PV Module and Inverter models from the available data base and can also specify the number of modules and inverters. While specifying the number of PV modules and Inverters the conclusions obtained in the design part analysis are considered here and the same are used as inputs in SAM.
A. Electrical Configuration:
The total 1836 PV modules are arranged in the form of four sub-arrays. Sub-Array 1,2 and 3 are having same configuration i.e., each sub-array consists of 30 parallel strings and each string is having 16 modules in series. Thus the open circuit voltage VOC and voltage at maximum power condition VMP at reference conditions are equal to 710.4V and 585.6V respectively. In sub-array 4 number of parallel strings are 22 and each string is having 18 PV modules in series. Here VOC is 799.2V and VMP is equal to 658.8V. Thus total 1836 PV modules are arranged into 112 strings. Total module area of the PV modules is equal to 1836 X 1.99m2 =3609.6m2.
B. Tracking and Orientation:
Here enter the values of inclination angle, Azimuth angle and ground coverage ratio (GCR) values. To get the maximum power output, we have to place the panel surface with an angle of latitude whose value is 18.665° for the chosen location. To avoid shadow of the panels over the adjacent PV panels we have to maintain a proper GCR value the GCR value chosen here is 0.64 this value enables a proper row spacing between the adjacent rows, which is equal to 5.7 metres. SAM uses these values for the calculation of roof area requirement and self-shading losses.
C. Electrical Sizing Information and System Sizing Messages:
Maximum DC voltage of an Inverter is 1000Vdc. Maximum and Minimum voltages of an inverter are 850Vdc, 449Vdc respectively. From the electrical configuration data, the string voltages of all the sub-arrays are within the limits. If string voltage in a Sub array diverges from the upper and lower voltage limits, then error messages will be displayed and the simulation gets interrupted. Therefore, care must be taken while assigning the number of PV modules in a string.
D. Estimation of Overall Land Usage:
Total roof Area = ;
= ; = 5640m2;
Therefore, to place all the PV modules on the roof with minimum shading the roof area required is equal to 5640m2.
E. Shading and Layout:
In SAM, we can model the effect of shadow caused by snow cover, external as well as self-shading. Shadow from neighboring rows of the array may fall on to the other arrays which lead to reduction in intensity of solar irradiance on the panel is called as self-shading.
F. LOSSES:
There are different types of losses in photovoltaic system like Irradiance losses, DC losses and AC losses.
Irradiance losses: These losses occur due to the formation of dust on PV panels. Because of dust formation intensity of incident radiation reduces which leads to the reduction in output power of the PV system. If we cleanup the panels regularly then we can reduce these losses.
DC Losses: The electrical losses which occur on DC side of the system are called DC Losses. There are different types of DC losses like module mismatch losses, DC power optimizer loss. Because of dc wiring, voltage drop across diodes, inaccuracy in tracking mechanism, inaccuracy of name plate details leads to losses in the system.
Total DC power loss =
100%×{1-[(1-Mismatch÷100%)
×(1-Diodes and connections÷100%) ×(1-DC wiring÷100%)
×(1-Tracking error÷100%) ×(1-Name plate÷100%)
×( 1- DC power optimizer loss ÷ 100% )] }
Net DC array power
= Subarray 1 Gross DC power × (1 - Subarray 1 Total DC power loss ÷ 100%)
+ Subarray 2 Gross DC power × (1 - Subarray 2 Total DC power loss ÷ 100%)
+ Subarray 3 Gross DC power × (1 - Subarray 3 Total DC power loss ÷ 100%)
AC Losses: These losses are on AC side of the system. Because of transformer at no-load leads to magnetization losses and under loaded condition AC wiring in the system leads to ohmic losses. By knowing these AC losses, SAM calculates the electrical output power of the system. The performance of equipment over the time reduces which leads to decrease in the output power of the system. If degradation rate is 0.5% then the system output will decrease by 0.5% of every year. Battery storage option is disabled for grid connected systems in SAM.
G. PV SYSTEM COSTS:
As part of the financial analysis in SAM it has a provision to mention electricity rates only in USD, Indian electricty rates are not included. However while enterting the Direct capital costs , Indirect capital costs and other energy charges we can enter the equivalent rates by converting Indian rupees to USD based on the conversion rate. AS per the benchmark capital cost norms set by the Central-electricity regulatory commission, costs for the complete Solar PV system installation is equal to rupees-530.02 lakhs/MW which implies that the cost/one-watt installation is 53.002Rs (in 0.74$/Watt).
Incentives: We can also include Incentives in SAM which makes us to take the economic advantage i.e., the government of India provides subside or incentives on solar PV installations. As part of JNNSM government is providing 30% incentives on the solar PV investments.
Electricity rates: We can also define the monthly electricity rates in SAM for different models. Such as for residential Model, commercial Model, and third party ownership.
Metering and Billing: Net Energy Billing method is chosen to compensate the system owner for generation of an electrical energy by the system. As per the purchase and sell rate set by TSNPDCL the sell rate for the kWh credits remained at the end of the year is equal to 4.11 Rs/kWh which is equal to 0.0575 $/kWh.
Energy Charges: TSNPDCL imposes energy utilization charges on the consumer based on the Time of Day (TOD) utilization. Three different time of day periods wise 1. Peak, 2. Normal and 3.OFF Peak are as shown in figure 5. Time of day tariff for off peak period is 6.8 RS/kWh whereas for Normal and peak periods is 7.8RS/kWh and 8.8 RS/kWh. These charges are in Indian Rupees INR and are converted into USD and the same are entered into energy charges table in SAM.
Figure 5: Time slots in the Time of Day framework for HT and EHT category loads in Telangana
V. RESULTS
With the proper input values given to the Detailed PV model in System Advisor Model, it offers simulation results in the form of bar graphs and tables:
Table 5: Summary Table of the Results obtained from System Advisor Model.
Metric Value
Annual energy (1st year) 842,539.0 kWh Simple payback period 5.3 years
Energy yield (1st year) 1,529.0 kWh/kW
Capacity factor (1st year) 17.5%
Performance ratio (1st year) 0.71
Levelized COE 4.56 ¢/kWh=3.14Rs/kWh
Net present value $229,117.0
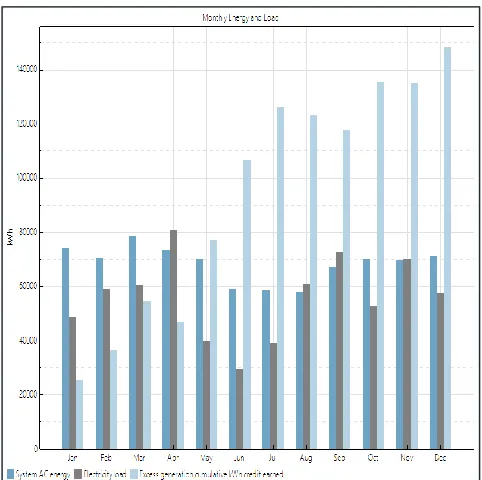
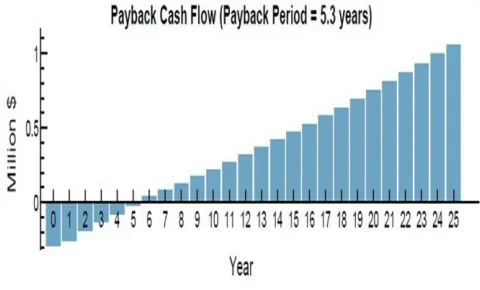
Figure 6 is a bar graph that presents the energy data with three rectangular bars in each month representing monthly AC energy production from the proposed PV installations, Energy consumed by the load and excess energy generated above the consumption with cumulative Kwh credits. It is observed that the maximum energy is generated in the month of March whose value is equal to 80690.7Kwh and the minimum energy in the month of August with 59498.7Kwh. The proposed PV installations showed a short payback period of 5.3 years. This is shown in the figure 7 which is a bar graph representing the payback cash flow where from zeroth year to fifth year the bars are negative that represent the debt payment for the loan where as from sixth to twenty fifth year bars are positive representing the profits.
Figure 7: Bar graph representing payback cash flow of the proposed PV system
VI.
CONCLUSION
PV*SOL Premium a PV simulation software is used to design the three dimensional (3-D) building blocks with solar panels adjusted optimally on shade free regions of the roof with optimum tilt angle (equal to latitude angle) to tap maximum solar radiation and in turn increase the productivity of the system. For the various building blocks in the college having a cumulative roof area of 12850m2, out of which shade free roof area suitable for mounting solar PV panels is found to be equal to 7300m2. This area can accommodate a solar PV system on the roof whose capacity is equal to 550.8KW, having 1836 PV modules/panels occupying 5640m2 of area and 6 inverters. SAM - (System Advisor Model) is also a PV simulation software is used to make the performance and financial predictions, while defining the system specifications in the input pages of SAM the result parameters obtained during PV*SOL Premium simulation are considered as the reference. While determining its feasibility the electricity bill of college, radiation at the project location, losses in the energy at various stages of the system due to many factors have been considered here. However, some basic idea is discussed here in this paper so as to have knowledge of the feasibility of solar panel installations of 550.8kW on the college rooftop and is found to be feasible too. The following conclusions can be drawn from the results of both the simulation tools and thus can justify the feasibility of the proposed Rooftop PV system at the specified location.
1. Annul energy outputs resulted from both the PV simulation tools are having approximately near values viz. 8,33,838 kWh per year and 8,42,539 kWh per year and are quite greater than the annual energy consumption of the Load which is equal to 671356.1kWh and therefore can feed excess generated power into the grid.
2. Payback period of the system is approximately found to be equal to 5.3 years.
3. The LCOE-Levelized cost of the Electricity for the designed PV system is equal to 4.56 cents/kWh which is equal to 3.1447 Rs/kWh is quite satisfactory.
4. Performance ratio of the designed system is 71% and having an annual energy yield of 1,529 kWh/kW.
5. CO₂ Emissions avoided 500,303 kg / year.
REFERENCES
[1]. R. Sharma and L. Gidwani, "Grid connected solar PV system design and calculation by using PV∗SOL premium simulation tool for campus hostels of RTU Kota," 2017 International Conference on Circuit, Power and Computing Technologies (ICCPCT), Kollam, 2017, pp. 1-5.
[2]. Y. Z. Alharthi, A. AlAhmed, M. Ibliha, G. M. Chaudhry and M. K. Siddiki, "Design, simulation and financial analysis of a fixed array commercial PV system in the city of Abu Dhabi-UAE," 2016 IEEE 43rd Photovoltaic Specialists Conference (PVSC), Portland, OR, 2016, pp. 3292-3295.
[3]. R. S. Shivalkar, H. T. Jadhav and P. Deo, "Feasibility study for the net metering implementation in rooftop solar PV installations across reliance energy consumers," 2015 International Conference on Circuits, Power and Computing Technologies [ICCPCT-2015], Nagercoil, 2015, pp. 1-6. [4]. R. Sharma and L. Gidwani, "Pre-feasibility study for solar
photovoltaic system of residential non-teaching staff colony in RTU Kota," 2016 Second International Innovative Applications of Computational Intelligence on Power, Energy and Controls with their Impact on Humanity (CIPECH), Ghaziabad, 2016, pp. 150-154.
[5]. Telangana state electricity regulatory commission Tariff Order Retail Supply Tariffs for FY 2016-17.
[6]. http://tsredco.telangana.gov.in/PDF/Solar_Energy/Solar_Roof top_Net_metering_Guidelines: Guidelines for Implementation of Net Metering Rooftop Solar PV Grid Interactive Systems [7]. https://www.valentin-software.com/