Advance Model For Cost Reduction In Cloud
Computing Environment
Dr. Keshao D. Kalaskar, Shipra Yadav, Pankaj Dhumane
ABSTRACT: Cloud computing is emerging as a strong computing paradigm with a view to efficiently utilizing resources and providing Green IT services. However, from a customer view, the choice to move to cloud computing stays dangerous given the advantages that would be achieved in that way. Cloud study is more focused on technological problems such as safety, performance, effectiveness and so on. Research on cloud computing implementation is nevertheless in its infancy. This article therefore tries to develop a model to assess the cost-benefits of deciding whether cloud computing is acceptable. Different organizational parameters, such as server amount, energy specifications and other computing / non-computer assets, are taken into account. For cost-benefit assessment, this system takes a three-layer strategy and provides perspectives into profitability if an organisation moves into cloud computer in each layer. The three layers are cost estimates, cost estimates based on the data pattern and the specific estimates of project costs. These layers are intended to offer distinct decision-making concentrations to help executives to identify the opportunities for their organization's cloud computing. Data from companies comprising both tiny and big data centers were gathered for cost benefit analysis. In comparison to established companies, cloud computing was discovered to be lucrative for start-ups and tiny companies (small group data centers).
————————————————————
1.
INTRODUCTION
Recently, cloud computing has developed and business computing has become a fresh stage. The cloud computing concept is based on the idea of computer resources residing outside the computer room and of connecting users to the cloud iusing thei resourcesi as and wheni requiredi. It actually shifts the facilities to the network, thereby reducing the general costs for managing hardware and software assets. It would appear to be extremely disruptivei (Rimali et al. 2009) technology, which suggests the future computer and storage utilities controlled by third parties. However, given their practical application of the cloud computing, organizations and the scientific community are starting to adopt cloud platforms. There is no study on a model capable of showing how the cloud implementation works and the perfect moment to move to cloud computing. This study attempts to develop a cost-benefit analysis model that can present a clear picture to the IT managers when the shifting from legacy systems to cloud computing is concerned. Every organization has its own unique computer resources and IT infrastructure. Direct profitability recommendations can not therefore be provided until all organizations ' inputs are deemed for the profitability assessment. Therefore, this article provides a system into account several parametersi of ani organisation and recommend the profitability of cloud computing. In cloudicomputingi,the price model is quite like a price dependent on utilization. Cut-out service tier arrangement covering the fundamentaltechnological facilities provides customers with payments for computational services (Xiong and Perros 2009). This idea of pay-as-you-go in cloud computing varies methods, whereby contractual costs are paid for having the resource for a certain duration, regardless of its real use. In this article, for the cost-effectiveness analysis scheme the cloud computing service is the Amazoni AWS.
It adds up its payment to the closest hour / GB of server per month. AWS is selected as an instance because significant competitors like Amazon represent the most prevalent cloud price system.The model suggested is based on three levels in this document. These layers are the various stages of cloud computing planned by organisations. In the first case, there is a basis cost estimate to compare the costs of the whole computing facility internally to the costs of switching completely. Other layer analyzes the information model depending on the median information quantity it procedures, the conversion speed, the estimated demand for supply etc. This layer provides an immediate suggestion on the feasibility of moving to the cloud with the input of layer one. The last level is a project-specific layer that would help organisations to maintain the current infrastructure untouched and to use cloud computing for a given future shows the situation commonly used in organisations today. It requires input on the complexity of the project and gives advice on the implementation of the cloud initiative. That paper proceeds as follows. The next chapter of trials draws on a thorough evaluation of cloud computing's cost-benefit analysis. Three parts of the model follow this. The factors and approaches used in the calculation of the initial cost estimates are described in Layer 1. Layer 2 tries in the same way to describe the particular project factors for the dataset factors followed by layer 3. A three-layer strategy defines the model suggested and how organisations can use it to receive cloud computing suggestions. The last chapter covers the model for small and medium-sized organisations and well-established organisations. In view of problems of information aggregation, the implementation of the suggested template is restricted to first and second layers.
2.
REVIEW OF LITERATURE
Cloud computing literature produces several variables appropriate to cloud computing in companies. These include acceptance, technical execution, cloud facilities and other considerations. described how cloud computing would translate from a traditional computing model to an implementation in the cloud. In Nucleus (2009), cloud infrastructure and distribution systems, along with the market-oriented distribution of resource products were researched. Fox et al. (2009) have been investigating the
_____________________________
Dr. Keshao D. Kalaskar, Shipra Yadav, Pankaj Dhumane Associate Professor, Dr. Ambedkar College, Chandrapur, (MH),
India, [email protected]
Research Scholar, IICC, RTM Nagpur University Nagpur, (MH), India, [email protected]
2109
difficulties and possibilities of practical cloud architecture application and the risks associated in moving from legacy systems to cloud computing. They also provided a compromise matrix to evaluate the profitability of cloud computation, which was used in this research to obtain certain elements of the template. Different blogs have explored cloud computing's profitability These blogs refer to case studies concentrating on the advantages of using cloud computing. Most of the blogs provided fundamental cloud price calculations and discussed the profitability of cloud computing. However, the range of these blogs is restricted because they cope with personal instances and no cost benefit assessment model exists. In just a few research, returns on investments were provided in applying cloud computation (Rosenberg, 2012). However, only e-mail servers had the scope and the goal was not that a cost-benefit model be moved. On the other side, a few surveys try to operate on cloud marketing, with the outcomes used to develop cost-benefit models. In the Aneka Cloud Environment, investigated the efficiency of several pricing processes, among them Fixed and FixedTime. Palankar et al. (2008) have assessed the capacity of Amazon S3 to provide price, accessibility and efficiency storage to large-scale projects for low price. It was a nice effort, considering that big companies subscribe to S3 service for many home customers and tiny businesses (Kirkpatrick, 2006). It stores over 5 billion user objects and processes over 900 million requests for users per day (Bezos, 2007). However, the user-side price calculation was not considered because Amazon's output was to be assessed on the basis of defined parameters. In Walker, MPI Applications (2008) conducted a comparable performance evaluation of the Amazon EC2 service. Li et al. (2009) tried an outstanding cost analysis too, but all calculations were made from the view of the seller only. Simson (2007), where a cloud-based sample API was assessed, showed a brief cost benefit analysis. This research assessed the performance of Amazon's service but the range of parameters for cost-benefit assessment was restricted. Deelman et al. (2008) have studied how project specifications can be adjusted in the cloud. You change the price to run a cloud-based science workflow. However, there is no model to decide on the use of cloud computing by an organisation. In Singh et al. (2007) and Zhao & Sakellariou (2007), similar implementation of workflow organized apps was dealt with. Few of the writers lately focused on ROI (Misra and Mondal 2011) in cloud computing. The aim of the ROI calculation papers is to achieve the return on cloud computation investments from a business mathematically. In some instances, these models are restricted to cost savings and company intelligence in ROI calculations appears to be the missing link of cloud ROI studies. This article thus offers an integrated system that can influence the input of a company and makes suggestions to adopt / shift from distinct angles to cloud computation.
3. LAYER 1: BASE COSTI ESTIMATIONi
Since cloud computing uses on-demand prices, calculation of cost of IT infrastructure maintenance at home is important. Although many writers recommend advanced cloud computing model costs calculation, on demand pricing still has an omnibus present in all costing
techniques, This paper discusses multiple IT infrastructure leadership expenses in-house, regardless of the specific project requirements. The notion of complete price of property (TCO) is used in the majority of parts concerned in this chapter. TCO is the way in which actual costs for IT infrastructure ownership and management are dealt with (Cappuccio et al. 1996). It takes full account of all life expenditure, investment expenses, operating costs and is therefore suited for the assessment of the basis price. Nine elements, including depreciation, server costs, network costs, energy costs, software expenses, heating costs, real estate costs, installation costs and assistance and maintenance costs, have been included in a base cost estimate. The following details are given for each component: (a) the explanation of all involved of computation calculation. The general objective is to achieve monthly expenses for all parts and thus to convert all variables into monthly parameters. The currency is US Dollars (USD) for all calculations, and calculations are produced monthly unless otherwise indicated.
3.1 Amortization
The amortization parameter for servers and other installations is therefore calculated to enable reasonable expenses to be allocated to different IT assets (hardware / softwares). It is necessary to calculate the monthly depreciation cost of each item at installations. This parameter is required. The initial costs of these items are based on the duration of the investment at the assumed rate. Studies have shown that expenses in the amortization of the facilities for CPU, storage and bandwidth more than triple the price. The interesti ratei generallyi stands at 5% per year (Greenberg et al. in 2008) and the real estate depreciation period is ten years, while server / other facilities have a three-year interest rate (Hamilton in 2009). Once the amortization parameter is reached, the element needed to get monthly price can then be calculated. Due to the separate depreciation phases, the amortizable unit parameter (Ap F) is calculated differently of the server parameter (Ap S). when the time-F is assessed in months and is the facilities depreciation period. The same applies to Ap S, Ap S and Ap F shall therefore be used for cost calculation in the next paragraphs.
3.2 Cost of Servers
Servers are usually installed on shelves, and all servers are presumed to have comparable settings. The idea is to facilitate server price calculation (without amortizationCost S can therefore be calculated as (N S* Cost PS), where N S is the server server number within an enterprise, and where the cost PS for each server is in dollars. The depreciable parameter of the server calculated in the previous part is used for the depreciated server cost-Cost Am S calculation. If the Ap S is the Amortizable Server parameter of the previous subsection, the Cost Am S=(Cost S*Ap S) value can be calculated. The costs for acquiring the server are calculated other than the fundamental cost.
3.3 Network Cost
of support and maintenance costs, maintenance operations were also drawn up independently. The expenses of switches, ports, wires and execution expenses would only be covered in this chapter. Since networking costs once again have an original price, the monthly price will be amortized. The networking costs (Cost Net) complete amount to port costs (Cost Port), cable costs (Cost Cab), switch costs (Costi Switchi), and the cost of implementing (Cost Imp). All # # s are calculated in USD is show by equation
Cost_Port= N_Port (No. of Ports) * Cost_per_Port (Cost per port) Cost_Cab= N_Cab (No. of Cables) *
Cost_per_Cab (interconnect cable cost) Cost_Switch= N_Sw (No. of Switches) * Cost_per_Sw (Cost per switch) Cost_Net= Cost_Port + Cost_Cab + Cost_Switch + Cost_Imp
The amortized networking costs of Cost Am Net, as well as the Cost Am Net = Cost Net AP S (Ap S is amortized server parameter) should be amortized in the way of the amortized networking cost calculations.
3.4 Power Cost
Few surveys have shown that energy in high-scale information facilities is the single biggest price. Although the statement's validity is debatable, it is clear that energy is one of the fastest increasing expenses (Brill, 2009). The very helpful name Green Grid, PEU, is a combined
complete energy to IT equipment energy ratio Efficiency Efficiency (PEE). Bungling abilities for businesses and efficient facilities are better than 1.2 (Google, 2010). The IT equipment that adds to the energy usage in an organisation involves computer facilities (servers, switches etc.), physical facilities of critical systems in the network, transformers, unbroken energy supplies, fans, climate controls, pumps, lighting, etc. (Sawyer, 2004).
3.5 Software Cost
The operating systemi patchesi and resourcesi fori loadi
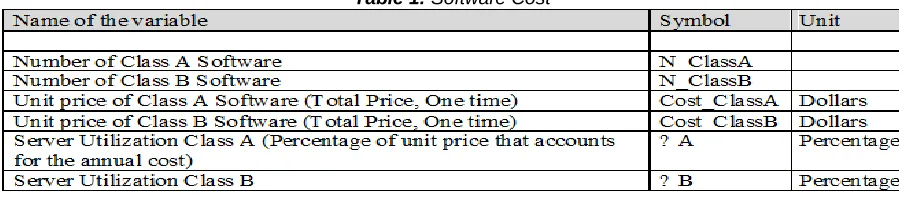
balancing are necessary to manage data centers. Software costs connected with the estimate of base costs are due to the payment of the licence. For the cost analysis depending on the lease framework, two categories of software are regarded. Operating System involves Class A software while Class B deals with other technology bases such as Application Server, VM Software, etc. The project-specific software is not included in Class B as the project expenses are dealt with in the layer. In Cybersource (2002) you can read information of the precise price depending on the TCO for Class A software. The total software cost for a company is the following: Cost Tot&Soft The overall costs for the software are the following: Table-1 provides a depiction of the factors in this equation. The overall software costs, however, must be amortized so that you can get the amortized Cost Am Soft software.
Table 1: Software Cost
3.6Cooling Cost
Past study showed that the energy consumption in the information centre, in which the energy score and thermal yield equivalence are reported, is equal to heat production (Rasmussen, 2007). The word ' cooling load factor' created by Li et al. (2009) is employed in this cost estimation approach. The heating unit consumes energy for 1W heat dissipation. It reflects power consumption. McFarlane (2005) is the source of other similar parameters like the airflow redundancy and inefficiency constants. The former reflects the auxiliary airflow needed to refresh the information centre while the latter is the auxiliary airflow for humidification. The cooling factor (Factor Cool) is calculated as the heating factor, Red Cool is a redundant airflow variable and Ineff Cool is the permanent inefficient. Factor Cool is the coolding factor[ LF Cool* (1+ Red Cool)/Ineff Cool]. The cooling factor will be calculated as a proportion of the price of electricity. The pre overall service price is therefore calculated under the Cost Tot Cool* Cost Am Pow value (the Cost Am Pow is the monthly price of energy in the preceding sub-sections).
3.7 Real Estate Cost
2111
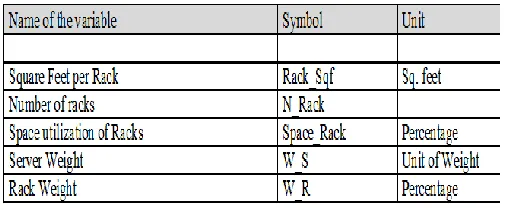
floor continuous pressure (C Pressure). V Pressure can be measured under (N S (server no.)* W S) +* (N Rack* W R)/ (Space U Rack) where the factors in Table-2 are described. For this calculation, therefore, the requirement to be encountered is.
Table 2: Real Estate Cost.
3.8 Facility Cost
These parts are tangible as well as immaterial and vital for ordinary machinery function. This is the server-bearing rack for these systems. The TCO of the installations can therefore be calculated by separating them into shelves, so that the pricesof facilities per rack can be taken as an input for cost computation. Components like PDU, KVM (keyboard), cables, etc. may form part of those installations. The total cost of the facility-Cost Tot Fac is indicated by N Rack* Cast Fac where N Rack is the numberi of racksi. In order to compute the amortized facility cost-Cost Am Fac, however, the cost of the facility should be amortized. The Cost Am Fac parameter can be calculated by the Ap S Amortizable Server Parameter.
3.9 Support and Maintenance Cost
Operational personnel are the main category of the company and very small staff in the conservation In an existing company the IT personnel percentage to server is 1:100, the automation is incomplete (Enck et al., 2009) and issues of the results are mainly a result of human mistakes (Kerravala, 2002). It has been discovered that the bulk of the work is outsource and documents the nature of the work under the agreement, after knowledge of the nature of assistance costs in various organizations. Consequently, the outsourcing portion involves the calculation of this cost by looking at the amount of trips to contracts per year and the expenses of the trips. This involves both employees and preventive maintenance agreement employees.
Cost Total SM can be computed with the following: Cost Total SM= (N Admin* Salary Support)+ (N Contract* Charge Contract)
3.10 Summaryi of the componentsi in Layer-1
In this section, a total of 9 componentsi were describedi. This comprises 8 price parts and one depreciation element, commonly used in another paragraph. It is the aim to obviously describe each element separately, to use itsoutput(s) for the calculation of expenses in cloud computing and in other levels. Table-3 summarizes the yield variable(s) of each element.
Table 3: Costi
componentiandiassociatedioutputivariable(s).
3.
LAYER 2: DATA PATTERNi BASEDi COSTi
ANALYSISi
This section covers the unique features of data patterns in an organisation, like the amount of data it produces, the time it takes for data transfer from its computer resources, the estimated demand, real average demand and the number of servers it provides to satisfy the demand. This evaluation includes aspects such as input for cost-value valuation and offers two specific analyses, evaluation moment and evaluation of requests. The variables in this layer are further used in the particular section of the project. In order to process the data at home and compare it with the cloud, time analysis will give a recommendation on how to adopt cloud computing. The demand assessment will offer advantages and disadvantages of cloud computation as regards the supply of supply in an organisation. Other potential elements could be considered in the cost analysis of the information model, but only time and request assessment are available in this research.
4.1 Time Analysis
It takes account of the amounti ofi datai that an organizationi processes for all the combined operations. Basedi on thei configurationi of cloudi instancesi specified in the cloud cost assessment section, the cloud instance can be computed on an in-house basis. The ultimate findings will show both in-house and cloud computing time. Thus, an organisation can decide on a computer-based transition to cloud computing. The variable is considered the speed to be 20Mbps / second (Garfinkel, 2007), from the organisation into the Amazon Cloud. The data processing time for the EC2 instance takes 2 hours per GB (Fox et al., 2009). Therefore, it takes 2* Size Da hours to process Sizei Dai GBi of information. The N In amount of cases can, however, be regarded as an organisation, so Sized Da GB (2* Size Da / N In) effectively takes hours to process. Thus, local calculative period (2* SizeDa/ N In) can be specified. The variable Rate Transfer is the rate of shift and Mbits / second is the measuring device. The purpose of this research is to find out how long Size Da GB information are to be transferred. Size Da GB will be required if Rate Transfer Mbit takes 1 second.
4.2 Demand Analysis
usage figures in information centres vary from 5% to 20% (Rangan, 2008; Siegele, 2008) and are exceptionally small Studies have shown. If firms prefer to serve on average, they can lose clients when the actual demand is higher than the average demand for services. This evaluation demonstrates disadvantages of both under-supply and over-supply. In cloud computing, the reward for the precise use of software resources does not cause such disadvantages N Peak is the server number a company would take into account if demand or load were the largest estimated. a website with the largest annual requirement of 1000 customers would involve five servers to host it. However, if a company chooses to create provision for the smallest supply, i.e. 200 customers, only two servers would be required. Therefore, there are five N Peak and N Trough. Ideally, an average demand should be met by an enterprise, but most companies create provision for peak demand so that prospective clients can not be lost. N Average shows the number of servers for the management of projected average supply. The median demand is calculated based on the peak and drought estimate of demand. The purpose of this research is to identify two instances of the use factor. The first case is the ideal one in which use based on the average demand is calculated. The second is the actual situation where companies use N Server servers to fulfill their requirements. As stated above, N Server companies usually hold the requirement strong. The usage variables can be calculated by discovering the corresponding server time in two instances. Though, the
iserver is provided for the estimation of N Server request and therefore the real payment for the server is provided: Provised Use= (N Server * 24) The next step is to find out how profitable cloud computing is in comparison with home systems. A comparison between N Serveri and N Averagei
would be required. In most cases, the server number provided is always highe in order to avoid potential customer loss, than the average estimated server requirement. This additional supply therefore contributes to the possible loss of server hours and poor usage. The loss factor in this research was calculated as the proportion of the use provided to current use. This factor is needed to gain ideas into inhouse building and cloud price calculation and comparison. The main concept behind the contrast is (Fox et al., 2009), which says that while the costs per service hour in the cloud over a three-year period are lower than "Loss Factor" times the price of purchasing the computer, cloud computation is a beneficial choice. A duration of 3 years has been selected as most economic designs enable the depreciation of capital expenditure linearly over a period of 3 years. In various instances, key comparative formulas are given below.
If (N Serve> N Average) then Server loss: loss ServeHours1= (Provided Use-Actual_Use) Server Hours Loss Factor= (Provisioned Use/Actual Use) If [Cost per hour of the server over 3 years] <[Loss Factor* server purchasing costs] Recommendations: Shifting to cloud computation might be useful Else [Loss Factor * server purchasing costs]
Recommendation: The shift can not be decided.
If customers (N Server < N Average) loss due to the absence of the service: if a server is provided to a client of Y, then the client is lost= (N Average-N Server) * Y Some clients are permanently lost, which is supposed to be 10% of those customers. The poor reputation of the organisation is added to the disadvantage.
Permanent Client Loss= (.1* Lost Clients) End
4.
LAYER3:
PROJECT
SPECIFIC
COST
ANALYSIS
The most popular situation for cloud computing is covered by this chapter. Many companies today want to protect their current infrastructure and assess if any forthcoming cloud projects would benefit them. For this purpose, the requirements of future projects as a ratio between existing computing infrastructure and thus that taken as input for the next project and the ratio of estimated serversi toi existingi servers can therefore be determined. This proportion may to check for calculate all project expenses calculated in the first layer. This assessment includes software costs (software for projects), which were omitted in the first phase. This layer is helpful not only for future initiatives but also to assess the efficiency of initiatives already undertaken. Cost estimates take the physical execution of the project into account. If exact demand is taken into account, the actual server need could be less than estimated. The N S servers already exist. The server ratio required for implementation of the project is, therefore: iRatio Serveri= N Est Server / N S, where the amount of estimated servers is N Est Server. The proportion can be used to calculate all project expenses using the expenses calculated in the basic price assessment (Section 3). Project expenses would be a proportion of the basic price (for related factors refer to section 3). Ratio Server is this proportion. The project expenses are therefore:
Project Cost of Servers (Cost_Am_PS) =Cost_Am_S * Ratio_Server Project Network Cost (Cost_Am_PNet) =
Cost_Am_Net * Ratio_Server Project Power Cost
(Cost_Am_PPow)= Cost_Am_Pow * Ratio_Server Project
Cooling Cost (Cost_Tot_PCool) =Cost_Tot_Cool *
Ratio_Server Project Real Estate Cost (Cost_Am_PRealE)= Cost_Am_RealE * Ratio_Server Project Facility Cost (Cost_Am_PFac) =Cost_Am_Fac * Ratio_Server
Project Support and Maintenance Cost (Cost_Am_PSM) =Cost_Am_SM * Ratio_Server
Project Cost is the ionly iestimate noti includedi in the above equations because, unlike class A and B outlined in previous segments, it contains class C equipment. The software engaged in the creation, production and implementation of a venture would require this expense. The calculation strategy is still identical to class A and class B. Software costs for the Cost Tot PSoft initiative are therefore provided by [N ClassC* Cost ClassC*alternatively]. N ClassC is the Class C (project particular software) amortized computer price. The Data P input is used for time analysis and the recommendation would be given in accordance with computing time. Data P is an estimated quantity of information that contains the backup quantity. Three replications are generally produced as a back-up strategy for an optimal venture. The cloud does not however require the same quantity of information, since it has a backup and no price at end of customers.
5.
CLOUD COMPUTING COST ANALYSIS
2113
factors. The technique was based on. The precise comparative technique mentioned in future segments, explaining the general cost-benefit assessment model. Cloud services such as Amazon leverage scale saving. The cost proportion of large data centers varies from 5 to 7 (Hamilton, 2008b) to medium data centers (networks, storaging and administration). Various Amazon EC2 families include quantity of devoted calculation capability is provided by example and loaded per hour spent. More detailed information on the families of cases (Amazon, 2011) is available. Standard Instances (On Demand Instances), owing to its prevalent use in most apps, were chosen for cost-benefit analyses. It may then be expanded to high memory and heavy CPU cases. In the community of normal cases, there are three sub-classes whose definition is provided below:
Small Instancei (Default) 1.7 GB of memoryi, 1 EC2 Compute Unit, 160 GB of local storage , 32-bite platform 1 virtualcore with 1 EC2 Compute Unit.
Large Instancei7.5 GB of memory, 4 EC2 Compute Units, 850 GB of local instance storage, 64-bit platform 2 Virtual Cores 2EC2 Compute Units each
The organization may match its server settings to these instance settings. One major example in house-server default is regarded equal to a physical one. Therefore, if N Est Server for a particular project is the no. of the estimated physical servers necessary, then N Est Server Large Amazon EC2 instances would be required. N Instance is then a cloud example, which would match a big example of N Est Server. Furthermore, on the basis of memory demands and local instance storage, one larger example is almost equal to five tiny cases and another big example corresponds to two big cases. Data processing requirements: The cloud's data processing requirements are one-third, as discussed in the project cost estimate, as a result of the automated backup of cloudiiservice providers. Cloud Data P is the data given by the Data P/3 data that is the bandwidth cost per imonth (Data P is from Section 5-Layer 3) for cloudi Datai P. Cloud Data P must be distributed as data in GB / Month as well as as as output and regional data transfer. Thus, Cloud Data P= Data Transfer into+ Data Transfer + Regional Data Transfer (Public IP is not used for analytics). This is necessary because the price for the transfer of information to and from Amazon EC2 is distinct. Table 4 describes the cost table in this regard and is based on Amazon EC2 information transmitted "in" and "out".
Table 4: Price Slabi in Amazoni.
Regional Data Transfer: $0.01 in / out for GB of information transmitted in the same region from cases in differentAvailability Areas. (If the customer does not provide
national information transfer, it is assume that 30% of the complete information being collected is accounted for) Transfer of data: € 0.01 per GB of public and elastic data IP and elastic load balancing: not taken into consideration in this analysis as regional data transfer rates are necessary, and this can not be prevented, although cases are in the same availability zone. Auto Scaling: Amazon CloudWatch enables auto scaling and no extra fees are paid for it. Each auto-scaling example starts automatically for surveillance and the fee for Amazon CloudWatch is paid.
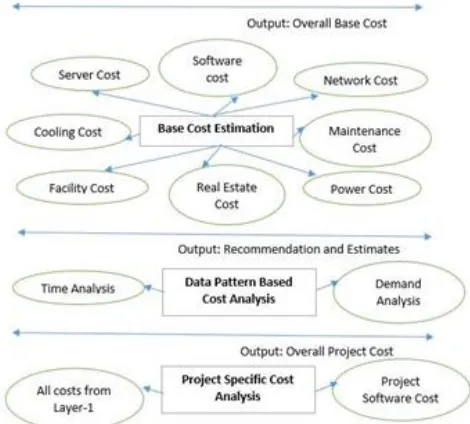
Figure 1: Three Layer Modeli for Cost-Benefit iAnalysis.
THREEi LAYERi MODEL
In previous sections,calculation were discussed. This chapter introduces the template that organisations would use in three levels of cost-benefit assessment. Figure 1 shows the model's depiction.
Decision in Layer 1: The overall cost of the base is the output of Layer 1. This shows the monthly price of keeping an in-house IT infrastructure depending on parameters that can assist in determining the possibilities for cloud computing. This baseline is likened to the Amazon Calculator's ultimate cloud price. Organizations may decide to outsource the entire cloud facilities if it is lucrative. No matter how beneficial, further assessment can be carried out in layers 2 and 3 using specific information on the organisation and projects, irespectively
Decision in Layeri 2: This layer is an autonomous layer, the analyzes in this phase recommend adoption / shift to cloud computation. Thus, a) time computer (time analysis)i, and b) lossesi ifi any are not achieved by moving to cloud systems relying on request demands (request analysis)i are two ways in which decisions can be taken.
are lower than the internal project calculation, then it is decided that the cloud project is executed.
6.
MODELi
IMPLEMENTATION
&
DATAi
COLLECTIONi
This model has been tested in IT companies with its application. Because of the potential for cloud use in India, Indian IT companies have been selected for this research. India has expanded as a worldwide center for IT and ITeS facilities. In panel 55% of thei worldwide supply market in 2010i and information from NASSCOMi indicates that the Indian softwarei andi servicesi industries generated US$ 100 billion in sales in the FY2012 area, which grew by more than 9%. Cloud computing plays an important part in
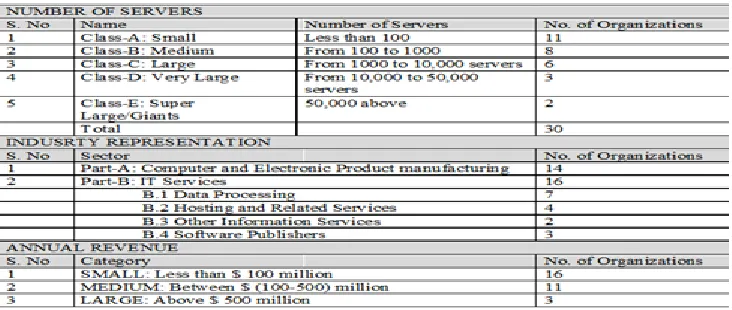
ensuring India's IT sector is kept on the worldwide market, with recent trend showing a surge in its output in India. The purpose of the evaluation and implementation of the models was twofold: a) to assess the balance between in-house price calculations (model) and the real price to the company and b) to evaluate the connection between the organizations sort (small / major companies). To achieve the second aim, the organisations had to be classified into different classifications. This ranking was performed on the basis of the amount of servers described in Table 5. Although the literature ranking of companies dependent on the amount of servers (Misra & Mondal, 2011), it is mildlyaltered to match the information collection background.
Table 5: Profile of Sample Firms (Statistics).
Data collection process: Database of the Emerging Market Informationi Servicei (EMIS ISI Emerging Market Product) was selected to discover the listi andi contactsi of IT Services / Manufacturing companies because it contains an extensive and exclusive range. The base of information included 1047 companies and the whole package was split into 3 organizations depending on the annual income of small, medium and large companies. The decision was made not to choose the entire database randomly, but rather by random selection, to maintain diversity in sample companies. Therefore, from the three organizations, 25 companies were randomly selected. A total of 75 companies thus created the research sample. Dataoi
collectionii was performed in two phases: a) collection of secondary datai pointsi ini thei model; b) compilation by online questionnaires, of the remaining information points (main information). The previous phase was used to obtain data points from secondary sources such as business websites, blogs with information on TCA, journals that use corporate data for price calculations and other web-based sources. The second phase only applied to companies whose information could not be acquired in the first phase. The second phase was carried out through a well-designed on-line survey which caught all of the model parts. Although writers first created a software application to collect information, many organisations did not allow it to be installed. The online survey was therefore created using Google Formulas and sent to the companies in the sample set. The EMIS database provided the connections of these companies. The covering letter given clear directions for collecting information points and included a overview of
information points. The original contact in any company was asked in the overview of the covered document, to appoint a person (preferably a system manager) to react. In some cases, main contact detail and transmitted the mail to ithe nominatediiindividuals, in others the nominated members received a new mail. The study provided a clause for skiping components / variables and entering the general price immediately where the company's calculation technique differed from the model. For example, in most cases. A total of 75 companies in the study could obtain full answers from 30 companies. Although 40 companies did not respond, unfinished information caused four companies to reject it. As a result, the information collection reaction frequency was 40%. Table 5 presents the profiles of these organisations (initial set). The sample companies depicted the IT sector in a fair manner (Table-5). The EMIS-Product Database covers the wide IT sector (Part A): "Computer and Electronic Product Manufacturing" (14 companies) and "2) Part B:"OIP and Softwarei
2115
a joint analytical platform. In question in order to test the model's robustness. It was found that in-house calculation costs were reasonably constant and about the real price of the server situation in-house. The median difference in this research between the organization's calculation price and the in-house calculation expenses was well within the agreed boundaries (monthly expenses). This was verified by an autonomous t-test, as there were no statistically important differences between the two techniques (5 percent meaning point). This consistency gives the suggested model a powerful basis in Layer 1. decision-making. The following chapter would give some instances for important results.
7.
RESULTS
Detailed outcomes for two organizations have been presented as an illustration before proceeding with aggregate result for all organisations. scale data center
(Category-A). In the first installation, cloud computing costs were $8,649,249 per month, computing in-house was $8625,623 per month. This shows that a big data center was cheaper for the in-house computing system. But for the second installation (tiny information center) the findings were distinct. In this situation, production costs were 2.009.43 dollars per month in residence, while computing costs on cloud were 567.01 dollars per month. This has shown significant savings of 254.39%, which shows that present spending is more than two times the cloud price. The assessment in Layer-2 of the suggested model made similar findings. Only time analyzes were done in the second phase because the information for the request assessment were hard to obtain. Compared to cloud computing the small data center had more transfer times locally and therefore the choice was favourable for the shift to cloud computing. Table 6 shows the final production for the two settings.
Table 6: Detailedi resultsi fori twoi samplei organizations.
The profitability in distinct classifications of companies differed, taking into account the full sample number of organisations. Whilst cloud computing (layer 1 choice stage) was beneficial for all 11 companies in Category A, it was not beneficial to a minority of companies in Category B. Category C companies, on the other side, had only one cloud computer company which did not
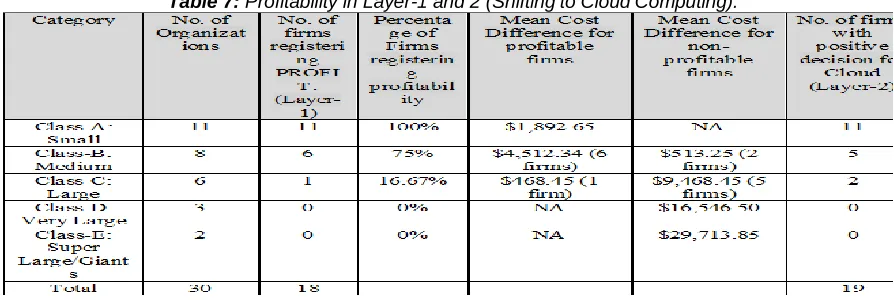
make a profit for others. All Category D and E companies recorded they moved to cloudi computingi. For the Layer-2 assessment, nearly comparable outcomes were also noted. Details like medium time differences were prevented because they differ in size Da for each organisation and thus mean distinction is not applicable. Table 7 presents the overview of profitability.
Table 7: Profitability in Layer-1 and 2 (Shiftingito CloudiComputing).
There could also be explorations of the reasons for this difference in profitability. This research, however, tries to discover a logical justification for the findings. Cloud computing non-profitability in the broad data canter could be due to economies of scale. Because the installation has a huge database, investing and computing on-line and reaping the advantages of economies of scale would be more lucrative. Moreover, companies operating in various
that Table-7 results only covered the first and second layer time analyses. It demonstrates the original comparison from home versus cloud computation of the whole facilities and the time assessment in the second layer. Although Layer-3 information were not required, there were specific cases in which a company required calculation on the third level. The company shown in Table 6 in the second set-up wanted to assess whether its future cloud project can be carried out. The tiny data center is available in German only. To that end, a project-specific assessment(Layer-3) was performed, estimating for the future indicated by the company. The would result in a total cost of $401.00 per month if carried out in-house. Cloud computing, however, again showed significant advantages, resulting in a monthly charge of $135.00. Therefore, compared with in-house computing, the cost-effectiveness of running the project on clouds would be twice as many. This specific situation is only provided to provide a reasonable picture of how Layer-3 can be used in the suggested template for assessment. However, due to test companies ' peculiarities, there is no comparison between the Layer-3 organisations.
8.
LIMITATION AND FUTURE WORK
The cloud billing model used in this article is based on a single supplier (Amazon). The applicability in Amazon Cloud alone is therefore restricted to decision making. In addition, the model is evaluated on a tiny sample and the outcomes for improved generalizability can thus be improved further. Though the research has covered a variety of organisations, the same amount of organisations can be found for stronger outcomes in every suggested category (A, B, C and D). The exclusion of results at layer 3 and the second-layer request assessment is one of the main constraints of this research. Although justification for exclusion was provided, if the results were presented for all three levels, the model would have been better analysed. The first stage in future study job is however to extend the request to the third level and to carry out the request assessment. It should also be noted that a number of problems arise when implementing cloud computing. This would include safety, confidence, efficiency, house server maintaining know- The focus of the research, however, is on the cost in the cloud to help policymakers. Consequently, the suggestions on cloud computing have not taken into consideration other variables and thus make this research another constraint. In order to find relationship between organizational size and profitability, future work would include the methodologies such as regression.. This model could be used by researchers to raise the amount of factors autonomous of their cloud computing choice. In order to make executives more flexible to decide on a change to cloud computing, the three-layer modeller will be expanded to several levels. The system also transcends Amazon cloud computing and offers computing alternatives for other facilities.
9.
CONCLUSION
In this paper, many organizations have addressed one of the main issues in their decisions to move to cloud computing. It has tried an strategy in three layers to ensure maximum flexibility for simple calculation in the template. There has been a comparison of the profitability of moving to cloud computing between distinct organisations. The
findings achieved for thirty organisations showed that small and medium-sized companies benefit from cloud computing. Large-scale enterprise has not benefited from the shift to cloud architecture. This model is transformed into a ready-made instrument where companies can supply straight information and receive suggestions on cloud computing. An analysis of the trend in the profitability of cloud-based organisations would be further study. This model could be used to comprehend the relationship between the profitability of a company and its nature. Cloud computing could be an efficient addition to Green IT in reducing the expenses of IT facilities.
REFERENCES
[1] Abramson, D., Buyya, R., & Giddy, J. (2002). A computational economy for grid computing and its implementation in the Nimrod-G resource broker. Future Generation ComputerSystems, 18(8), 1061-1074.
[2] Amazon (2010), Amazon_Billing Calculator, available at:
http://calculator.s3.amazonaws.com/calc5.html(last accessed May 2010)
[3] Amazon (2011) Amazon_EC2 Instance types, http://aws.amazon.com/ec2/instance-types.
[4] Anthes, G . (2005). Data Centers Get a Makeover. Computerworld news article (cited 2005 November 1),
Available from
http://www.computerworld.com/databasetopics/data/dat acenter/story/0,10801,97021,00.html?SKC=home9702 1
[5] Belady, C., Rawson, A., Pfleuger, J., & Cader, T. (2008). Green grid data center power efficiency metrics: PUE and DCiE. The Green Grid, 1-9.
[6] Bezos, J. (2007). Keynote talk at Web 2.0 Expo (2007). [7] Brill, K. (2009). The Invisible Crisis in the Data Center: The Economic Meltdown of Moore’s Law. Uptime Institute White Paper.
[8] Buyya, R., Yeo, C. S., Venugopal, S., Broberg, J., & Brandic, I. (2009). Cloud computing and emerging IT platforms: Vision, hype, and reality for delivering computing as the 5th utility. Future Generation computer systems, 25(6), 599-616.
[9] Cappuccio, D., Keyworth, B., & Kirwin, W. (1996). Total cost of ownership: The impact of system management tools. Gartner Group, Stamford, CT.
[10]Cybersource. (2002). Linux vs. Windows Total Cost of Ownership Comparison. Cybersource®Pty. Ltd.
[11]Deelman, E., Singh, G., Livny, M., Berriman, B., & Good, J. (2008). The cost of doing science on the cloud: the montage example. In Proceedings of the 2008 ACM/IEEE conference onSupercomputing (p. 50). IEEE Press.
[12]Enck, W., Moyer, T., McDaniel, P., Sen, S., Sebos, P., Spoerel, S., & Aiello, W. (2009). Configuration management at massive scale: system design and experience., IEEEJournal on Selected Areas in Communications, 27(3), 323-335.
2117
[14]Fox, A., Griffith, R., Joseph, A., Katz, R., Konwinski, A., Lee, G., ... & Stoica, I. (2009). Above the clouds: A Berkeley view of cloud computing. Dept. Electrical Eng. and Comput.Sciences, University of California, Berkeley, Rep. UCB/EECS, 28.
[15]Garfinkel, S. L. (2007). An evaluation of Amazon’s grid computing services: EC2, S3, and SQS.
[16]Ghag, S. (2008). Financial implications of the cloud, Infosys Microsoft Alliance and Solutions Blog, Available from
http://www.infosysblogs.com/microsoft/2008/12/financia l_implications_of_the_1.html
[17]Google (2010). Commitment to Sustainable Computing, available at: http://www.google.com/corporate/data centers/, Oct. 2008 (last accessed May 2010).
[18]Gray, J. (2008). Distributed computing economics. Queue, 6(3), 63-68.
[19]Greenberg, A., Hamilton, J., Maltz, D. A., & Patel, P. (2008). The cost of a cloud: research problems in data center networks. ACM SIGCOMM Computer CommunicationReview, 39(1), 68-73.
[20]Hamilton, J. (2008). Cost of power in large-scale data centers. Blog entry dated, 28th November.
[21]Hamilton, J. (2008b). Internet-scale service efficiency. In Large-Scale Distributed Systems andMiddleware (LADIS) Workshop (September 2008).
[22]Hamilton, J. (2009, January). Cooperative expendable micro-slice servers (CEMS): low cost, low power servers for internet-scale services. In Conference on Innovative Data SystemsResearch (CIDR’09).
[23]Hayes, B. (2008). Cloud computing. Communications of the ACM, 51(7), 9-11.
[24]Hinchcliffe, D. (2012), What does cloud computing actually cost? An analysis of the top vendors, ebiz: the Insider's Guide to Business and IT Agility, Available from
http://www.ebizq.net/blogs/enterprise/2009/08/what_do es_cloud_computing_actu.php.
[25]Hosanagar, K., Krishnan, R., Smith, M., & Chuang, J. (2004, January). Optimal pricing of content delivery network (CDN) services. In System Sciences, 2004. Proceedings of the37th Annual Hawaii International Conference on (pp. 10-pp).
[26]Kerravala, Z. (2002). Configuration management delivers business resiliency.The Yankee Group. [27]Kirkpatrick, M. (2006). Amazon releases early info on
S3 storage use.
[28]Li, X., Li, Y., Liu, T., Qiu, J., & Wang, F. (2009, September). The method and tool of cost analysis for cloud computing. In Cloud Computing, 2009. CLOUD'09. IEEEInternational Conference (pp. 93-100). [29]McFarlane, R. (2005). Let’s Add an Air Conditioner, SearchDataCenter news article, Available From ttp://searchdatacenter.techtarget.com/columnItem/0,29 4698,sid80_gci1148906,00.html.
[30]Mircea, M., Ghilic-Micu, B., & Stoica, M. (2011). Combining business intelligence with cloud computing to delivery agility in actual economy. Journal of Economic Computation andEconomic Cybernetics Studies, 45(1), 39-54.
[31]Misra, S. C., & Mondal, A. (2011). Identification of a company’s suitability for the adoption of cloud
computing and modelling its corresponding Return on Investment. Mathematicaland Computer Modelling, 53(3), 504-521.
[32]Nucleus.(2009). ROI Case Study, Nucleus Research.com-Document, Available from http://www.google.com/apps/intl/en/business/case_stud ies/tvr.pdf.
[33]Palankar, M. R., Iamnitchi, A., Ripeanu, M., & Garfinkel, S. (2008, June). Amazon S3 for science grids: a viable solution?. In Proceedings of the 2008 international workshop onData-aware distributed computing (55-64). ACM.
[34]Pyke, J. (2009). Now is the time to take the cloud seriously. White Paper, Retrieved from: www.cordys. com/cordyscms_sites/objects/bb1a0bd7f47b1c91ddf36 ba7db88241d/time_to_take_the_cl
oud_seroiusly_online_1_. pdf.
[35]Rangan, K., Cooke, A., Post, J., & Schindler, N. (2008). The Cloud Wars: $100+ billion at stake.Tech. rep., Merrill Lynch.
[36]Rasmussen, N. (2007). Calculating total cooling requirements for data centers.American PowerConversion, white paper, (25).
[37]Rimal, B. P., Choi, E., & Lumb, I. (2009, August). A taxonomy and survey of cloud computing systems. In INC, IMS and IDC, 2009. NCM'09. Fifth International Joint Conference (pp. 44-51).
[38]Rosenberg, D. (2012). The cost of cloud adoption, Available from http://news.cnet.com/8301-13846_3-10140303-62.html.
[39]Sawyer, R. (2004). Calculating total power requirements for data centers.American PowerConversion, Tech. Rep.
[40]Siegele, L. (2008). Let it rise: A special report on corporate IT. Economist Newspaper.
[41]Simson, G. (2007). Commodity grid computing with Amazons s3 and ec2, In login USENIX.
[42]Singh, G., Kesselman, C., & Deelman, E. (2007, June). A provisioning model and its comparison with best-effort for performance-cost optimization in grids. In Proceedings of the 16thinternational symposium on High performance distributed computing (pp. 117-126).ACM.
[43]Stuer, G., Vanmechelen, K., & Broeckhove, J. (2007). A commodity market algorithm for pricing substitutable Grid resources. Future Generation Computer Systems, 23(5), 688-701.
[44]Walker,E. (2008). Benchmarking Amazon EC2 for high-performance scientific computing. Usenix Login, 33(5), 18-23.
[45]Xiong, K., & Perros, H. (2009, July). Service performance and analysis in cloud computing. In Services-I, 2009 World Conference, 693-700).