378
Efficient Classification And Regression Techniques
To Predict Crop Yield
Nishchal Adil, Somesh Dewangan, Kusum SharmaAbstract: In today’s era researchers and stakeholders are witnessing the advantage of digital interventions in the field of agriculture. Many organizations are keeping records of agricultural practices and its outcomes and data being produced by such organizations is increasing exponentially. Therefore, these agricultural data must be analyzed for the purpose of observing useful patters and information. In our study we are using rapid miner tool for implementing data mining techniques to analyze available data set, mining useful patterns and obtaining predictions using generalized linear model, deep learning, decision tree, random forest, and gradient boosted trees and support vector machine algorithm.
Index Terms: Data mining, Decision Tree, Deep Learning, Generalized Linear Regression, Gradient Boosted Tree, SVM, Random Forest, Yield Prediction.
—————————— ——————————
1.
INTRODUCTION
THE farming and agricultural sector provide major foundations to the Indian economy. In spite of the fact that India has achieved self-sustainability in food staples its agricultural productivity is low [1]. India due to its varied physical features has variety of soil which is exceptionally perfect for cultivating different crops and it is leading country for rice production all over the world. To get desired outcome farmers must precisely know when to sow the seeds. Moreover India experiences varied rainfall at different places which directly affects the crop because both low and excessive rainfall will cause damage to crops; hence proper rainfall is desired for better crop production. Many factors such as temperature, humidity also affects the crop yield [10]. Agricultural output relies upon topographical, climatic conditions and season. The agricultural yield provides one of the quantifiable parameters that contribute towards the genuine income of the nation. This yield is determined on the basis of cultivated area and crop production of entire nation. To obtain improved financial outcome we should study the agricultural database consisting data about crop, season, area, production, etc. Study and analysis of such large agricultural database is carried out through the use of various data mining methods [2]. Data mining is the process of analyzing large data set for the purpose of determining useful patterns and extracting meaningful information, this process is also known as knowledge extraction. Knowledge extraction from large data set is done by applying various data mining techniques [2][3]. There are number of public sector organizations which consist of comprehensive source for agricultural data, either for educational purpose or other practices related to agriculture. This data is widely available on Indian websites. Many open source tools for mining data are available to determine trends and predictions related to agricultural outcomes and crop yield [12].
Here we are trying to obtain the prediction of crop yield by implementing various machine learning and data analysis methods such as generalized linear model, deep learning, decision tree, random forest, gradient boosted trees and support vector machine using rapid miner tool. The remaining sections of the paper consist of related work, research methods in section 2 and 3 respectively, the results have been discussed in section 4 and finally section 5 concludes about the work asserted in the paper.
2
RELATED
WORK
Vanitha CN et al. [3] in their analysis utilized python to analyze the agricultural data set, order to carry out the prediction and crop production data mining tool Jupyter Notebook is the used. The attributes taken into consideration are temperature rainfall, precipitation, evapotranspiration, reference crop, area, production and yield from January to December for years 2000 to 2018. Data mining algorithms used for crop prediction are Support Vector Machine algorithm in which crop dataset is read then data frame is created and feature extraction is carried out after that SVM class is created and finally crop prediction is performed based on temperature, year and rainfall, to create Bayesian network selective attribute algorithm is used, KNN algorithm and k-means algorithm is applied where high level of exactness is accomplished. S.Bhanumathi et al. [4] designed a system which is capable of anticipating crop yield in precise and accurate way and furthermore suggesting the recommendations for the use of fertilizer on the basis of atmospheric and soil parameters which helps the farmer to increase the productivity. The data set considered for crop yield analysis consist of seven attributes state, district, crop year, season crop name area and production. For crop yield prediction random forest algorithm is applied, 10 trees are created and data is passed to it depending on different conditions every tree is classified and models are trained and trees which gives same output will observed and tree with more count will decide the output. For fertilizer recommendation back propagation algorithm is used. Dakshita Sharma et al. [5] gathered crop data, farmer suicidal data and rainfall data from government websites and applied cluster analysis to the acquired data and clustered the attributes in order to determine factors corresponds to low crop yield .Various case studies has been done for correlating low yield outcomes, rainfall factors against suicidal data with the help of Rapid miner and R tools for data mining and analytics. Surya A. Venkaiah et al. [6] in their study analyzed ---
Nishchal Adil, M.Tech Scholar, Computer Science and Engineering, RSR RCET, Kohka, CG, India. Email: [email protected]
Somesh Dewangan, Asst. professor, Dept. of CSE, RSR RCET, Kohka, CG, India. Email: [email protected] Kusum Sharma, Asst. professor, Dept. of CSE, RSR
379 various environmental and biotic factors such as pH, soil
salinity to determine production of crops in Bangladesh. Based on these factors they clustered the data set in order to divide districts into regions and then implemented Id3and cart classification algorithms in order to determine the predictions for crop yield. S. Jambekar et al. [7] in their disserted work obtained yield prediction using regression analysis on the data of period 1950-2013 using parameters area, production, yield, area under irrigation, mean temperature and rainfall; they implemented Random Forest, Multiple Linear Regression, Multivariate Adaptive Regression Splines (Earth) algorithms for the crops rice, wheat and maize; from the results obtained they observed Multivariate Adaptive Regression Splines (Earth) performed better for rice and wheat dataset and performance of Multiple Linear Regression is better for Maize dataset. S.V. Bhosale et al. [8] in their study analysed agricultural data set using the visualization tool Tableau they joined two data sets and clustered the data using K- means clustering. They used Apriori algorithm in order to obtain yield prediction for specific site and Naive Bayes Classification to determine name of crop. Kuljit Kaur et al. [9] used WEKA tool to analyze the effect of temperature and rainfall particularly for paddy yield. Study was carried out on the dataset gathered from government sites, they performed data preprocessing and data discretization and applied Apriori algorithm for prediction. Jharna Majumdar et al. [10] in order to determine the parameters to enhance the production of crop analyzed data from Karnataka state firstly they clustered districts based on the attributes portraying similar temperature, rainfall, and soil type using DBSCAN. To cluster data based on districts producing highest crop yield PAM (Partitioning Around Medoids) algorithm is used and to determine appropriate parameters which leads to maximize the crop yield CLARA (Clustering Large Applications) algorithm is used. Finally for predicting the annual crop production Multiple Linear Regressions is applied. Sujatha et al. [11] in their study presented a model for analysis of agricultural data to estimate crop production and choose best crop for the agricultural field. The model includes input component which takes input from the farmer; input component consist of crop name, land area, soil type, soil pH, pest details, weather, water level, seed type; Feature selection component choose an attribute from crop details. Classification is applied on climatic data and crop parameters for crop yield forecasting. Pallavi V. Jirapure [12] proposed a system based on agricultural data which is aimed to provide information to the farmers bridging the gap between customers and farmers. Researchers provided architecture to store information to store data in cloud and provide services for crop production predictions using historical data using Regression analysis.
3
RESEARCH
METHODS
3.1 Data Description
The dataset used for analysis was gathered from publicly accessible websites of government of India. It consists of seven attributes:
• State name: Includes data from all 29 states. • District name: Consists of each and every district of
all states.
• Year: Records from year 1997 to 2014. • Season: Kharif, Rabi, whole year.
• Crop: All kinds of crop which are being sown.
• Area: Area which was under cultivation and is measured in hectares.
• Production: The total yield obtained from the cultivated area taken in tonne
Fig.1 Sample data set
3.2 Data Preprocessing
The raw data obtained may contain missing values so there is need to clean the data in this step. Dataset obtained in excel format consist of seven attributes state name, district name, year, season, crop, area and production. Two more attributes yield and yield class are added, yield is derived as production per unit area and based on the crop yield value various class for yield is defined such as excellent(E), very good(VG), good(G), and poor(P). After appending yield and yield class attributes the file is saved with comma separated value (.csv) extension.
Fig.2 Dataset after being processed
3.3 Building prediction models using Rapid miner
380 low value of missing, stability, ID-ness is desirable.
Fig.3 Select input
Following machine learning and data mining algorithms were used to carry out and determine the prediction results for yield: Generalized Linear Model: Generalized Linear Model
is a statistical method which is generalization of simple linear regression models. Generalization of linear regression is done by enabling relation between linear model and response variable through the link function and where the magnitude of variance of each measurement is considered to be a function of its predicted value. ―The Generalized Linear Model consists of 3 components: an exponential family of probability distributions, a linear predictor ᶯ =Xβ, and a link function g such that E (X|Y) =µ=g-1(ᶯ)‖ [13]. Deep Learning: Deep learning is defined as the class
of various machine learning algorithm, in order extract features from the higher level of raw data it make use of multiple layers [14]. Here multi-level neural network is used for learning non-linear relationships.
Decision Tree: Decision tree is a tool for machine learning which supports decision making using a tree like model finds simple tree-like models which are easy to understand. A decision tree consists of 3 kinds of node that is decision node, chance node, and end nodes [15].
Fig.4 Decision Tree
Random Forest: It is also called random decision forests which are method for ensemble learning for classification and regression it includes multiple
randomized trees [16].
Fig.5 Random Forest
Gradient Boosted Trees: It is a powerful machine learning technique which produces complex model using ensembles of decision trees [17].
Fig.6 Gradient Boosted Tree
Support vector machine: SVM is powerful machine learning algorithm for supervised learning it is relatively fast model, especially for non-linear relationships [18].
4 RESULTS
381 Fig.7 Predictions chart for Generalized Linear Model
Fig.8 Predictions chart for Deep Learning
Fig.9 Predictions chart for Decision Tree
Fig.10 Predictions chart for Random Forest
Fig.11 Predictions chart for Gradient Boosted Trees
Fig.12 Prediction chart for Support Vector Machine
382 Fig.14 Plot between total time and scoring time
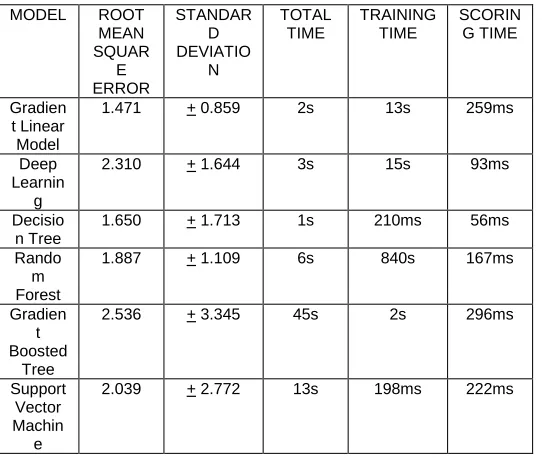
Table 1 Comparison of performance of all the models
In this paper, we tried to analyze agricultural data and obtain yield prediction by implementing generalized linear model, deep learning, decision tree, random forest, and gradient boosted trees and support vector machine algorithm. In Table 1 each models for the crop yield predictions were compared based on their Root Mean Square Error, Standard deviation and their Runtimes. We compared the error rate obtained while comparing the results for all the models we observed the root mean square error rate for Generalized Linear Model was least, while predicting the output for all the models comparison graph is also plotted shown in Fig.13; plot between total time and scoring time for the models is shown in Fig.14. In the observations we found the performance of Generalized Linear Model was best and scoring time, total time of Decision Tree was fastest as compared to other models.
5
CONCLUSION
In this analysis, we applied various data mining techniques to analyze the agricultural data and determine crop yield predictions. Algorithms used for obtaining predictions were generalized linear model, deep learning, decision tree, random forest, and gradient boosted trees and support vector machine. We presented application of these models in agriculture and also discussed the results of the prediction. In our research we obtained crop yield prediction successfully and also found the efficient algorithm from all the algorithms implemented. In future we are aiming to develop an agriculture based web application which will provide information to the farmer to help them understand yields of the crop.
REFERENCES
[1] Agriculture in India – Wikipedia,
https://en.m.wikipedia.org/wiki/Agriculture_in_India [2] Anusha A. Shettar, Shanmukhappa A. Angadi, "Efficient
data mining algorithms for agriculture data", in International Journal of Recent Trends in Engineering and Research, Vol. 2 issue 9, September 2016.
[3] Vanitha CN, Archana N, Sowmiya R, ―Agriculture analysis using data mining and machine learning techniques‖ 5th International Conference on Advanced Computing & Communication Systems (ICACCS), IEEE 2019.
[4] S.Bhanumathi, M.Vineeth, N.Rohit, ―Crop yield prediction and efficient use of fertilizers‖, in International Conference on Communication and Signal Processing, April 4-6, 2019. [5] Dakshita Sharma, Dr. A. Sai Sabitha, ―Identification of influential factors for productivity and sustainability of crops using data mining techniques‖ 6th International Conference on Signal Processing and Integrated Networks (SPIN) 2019.
[6] Surya A. Venkaiah, Kondajji Swati Sunitha, ―A new approach for predicting crop yield prediction using data mining techniques‖, in International Journal of Engineering, IT and Scientific research,vol.3 no.1 2019. [7] Suvidha Jambekar, Shikha Nema, Zia Saquib, ―Prediction
of crop production in India using data mining techniques‖, in Fourth International Conference on Computing Communication Control and Automation (ICCUBEA) 2018.
[8] Shreya V. Bhosale, Ruchita A. Thombare, Prasanna G. Dhemey, Anagha N. Chaudhari, ―Crop Yield Prediction Using Data Analytics and Hybrid Approach‖, Proceedings - 4th International Conference on Computing, Communication Control and Automation, IEEE 2018. [9] Kuljit Kaur, Kanwalpreet Singh Attwal, ―Effect of
temperature and rainfall on paddy yield using data mining‖, 7th International Conference on Cloud Computing, Data Science & Engineering, IEEE 2017. [10]Jharna Majumdar, Sneha Naraseeyappa, Shilpa Ankalaki,
―Analysis of agriculture data using data mining techniques: application of big data‖, Journal of Big Data, Springer 2017.
[11]R.Sujatha, P. Isakki, ―A Study on Crop Yield Forecasting Using Classification Techniques‖, 978-1-4673-8437-7/16 IEEE.
[12]Pallavi V. Jirapure, Prarthana A. Deshkar, ―Qualitative data analysis using Regression method for Agricultural data‖, World Conference on Futuristic Trends in Research and Innovation for Social Welfare, IEEE 2016.
[13]Generalized Linear Model – Wikipedia
https://en.m.wikipedia.org/wiki/Generalized_linear_model
[14]Deep Learning – Wikipedia
https://en.m.wikipedia.org/wiki/Deep_learning
[15]Decision Tree – Wikipedia
https://en.m.wikipedia.org/wiki/Decision_tree
[16]Random Forest– Wikipedia
https://en.m.wikipedia.org/wiki/Random_forest
[17]Gradient Boosted Tree – Wikipedia
https://en.m.wikipedia.org/wiki/Gradient_boosted_tree
[18]Support Vector Machine – Wikipedia
https://en.m.wikipedia.org/wiki/Support_vector_machine MODEL ROOT
MEAN SQUAR E ERROR STANDAR D DEVIATIO N TOTAL TIME TRAINING TIME SCORIN G TIME Gradien t Linear Model
1.471 + 0.859 2s 13s 259ms
Deep Learnin
g
2.310 + 1.644 3s 15s 93ms
Decisio n Tree
1.650 + 1.713 1s 210ms 56ms
Rando m Forest
1.887 + 1.109 6s 840s 167ms
Gradien t Boosted
Tree
2.536 + 3.345 45s 2s 296ms
Support Vector Machin
e