Second Phase Harmonized Assessment Report
VANUATU:
TROPICAL CYCLONE PAM
April 2015
08
Fall
SUMMARY OF FINDINGS
A. WATER, SANITATION AND HYGIENE
KEY FINDINGS
1. Many communities cannot access safe water sources. An estimated 68% of the rainwater harvesting catchment structures are broken, 70% of the wells have been contaminated, and piped water systems have been damaged. Water quality is poor everywhere except Port Vila, resulting in a health risk.
2. 68% of the sanitation superstructures have been destroyed, resulting in an increase in open defecation, which was reported to be up to 45% in some places. Open defecation presents urgent health, protection and dignity risks to children, women, and vulnerable groups.
3. Only 30% of households report hand washing, posing a risk of communicable disease. Some bathing facilities are unsafe.
KEY PRIORITIES
1. Provide immediate access to water supply through emergency water distribution and restoration of water systems.
2. Prevent the spread of diseases by providing hygiene messages, household water treatment and safe storage supplies and by ensuring household access to soap.
3. Ensure privacy and safe disposal of human faeces by restoring sanitation structures, complemented with sanitation promotion.
4. Ensure dignity and minimize protection risks by providing safe bathing facilities and access to sanitary protection materials for girls and women.
5. Restore protective environments at schools and health care facilities.
B. SHELTER
KEY FINDINGS
1. Many communities have received shelter assistance and are recovering fast.
2. Population and damage figures, especially in urban areas, are much higher than estimated. 3. Gaps in coverage remain, especially in Port Vila and Tanna Island.
KEY PRIORITIES
1. Tarpaulins remain a priority to meet outstanding needs and support WASH interventions.
3. Communities are turning to recovery options and need more permanent roofing materials, including traditional thatching materials, nails, and construction materials.
4. Education, information and training on safe shelter construction.
5. Information management, including communication with affected communities and feedback mechanisms.
C. HEALTH AND NUTRITION
KEY FINDINGS
1. A high proportion of health facilities were damaged. However, all but 7 remain partially (19) or fully (45) functioning.
2. The provision of health services has decreased across all sectors, and in particular in the general clinical and in the child health services.
3. Overall, the impact on the capacity of the health services to deliver curative and preventive services has been significant, especially given the fragility of the pre-cyclone health system which had a low level of health staff, particularly with regard to medical doctors and midwifes.
KEY PRIORITIES
1. Repair and re-open 6 destroyed and the 9 health facilities with major damage. Re-establish all health facilities to fully functioning status, including adequate water and sanitation services.
2. Ensure adequate human resources are available to address the increased health needs of the communities, and avoid a drop in service delivery coverage following the departure of foreign medical teams.
3. Ensure availability and distribution of essential medicines, including immunisation and cold chain capacity.
4. Finalize and start the implementation of a “building back better” strategic plan for the recovery of the health sector addressing pre cyclone health inequities.
D. EDUCATION
KEY FINDINGS
1. 88 facilities, 32% of those assessed, were found to be completely destroyed.
2. The three most immediate priorities identified by key informants at the assessed schools are (1) repairing damaged facilities (64%), (2) ensuring the safety of students and teachers (46%), and (3) establishing! Temporary Learning Spaces (45%).
3. Schools in Shefa and Tafea Provinces have the largest numbers of totally and partially damaged facilities. They also report the largest drop in access to toilets at education facilities - only 9% of schools toilets function in assessed schools in Shefa and 12% in Tafea.
4. Of the assessed schools, 17 reported the need for support in the provision of food to their students. responded to having feeding program in schools.
KEY PRIORITIES
1. Provide assistance in repairing damaged school facilities. 2. Provide teaching and learning resources to damaged schools. 3. Distribute basic WASH kits to affected schools.
4. Address the need for safe drinking water at affected schools.
5. Address the inability to pay school fees of some of the affected people. 6. Provide food for students at boarding schools.
E. GENDER AND PROTECTION
KEY FINDINGS
1. Displacement continues to be a concern.
2. Communication with affected communities has been a significant gap in the response so far. 3. Physical security for the affected population is inadequate.
4. Insufficient attention given to housing, land and property issues including the impact of the cyclone on landless tenants, as well as the challenges faced in replacement of vital civil documentation.
5. Reporting mechanisms and support services for survivors of gender based violence or child abuse are inadequate.
6. Targeted assistance is needed for persons living with disabilities, female headed households and older persons.
KEY PRIORITIES
1. Protection mainstreaming across all clusters to promote meaningful and impartial access, safety and dignity in the response.
2. Protection Monitoring and displacement tracking. 3. Communication with affected communities.
F. EARLY RECOVERY, AGRICULTURE AND LIVELIHOODS
KEY FINDINGS
1. Men and women showed significant differences in usual livelihoods, and men’s usual livelihoods were more profitable in general.
2. Usual livelihoods for men in these locations include: fishing (tuna, marlin, reef fish), lobster, coconut crabs, sandalwood, and in some islands cash crops such as kava, copra and cacao, shops.
3. Usual livelihoods for women in these locations include: weaving mats and baskets, sales of prepared foods at the markets, sewing clothes for sale, vegetable gardens.
4. Overlap in gardens and farming, in which both men and women tend to work for subsistence and also at the markets; also to some extent services and accommodation for tourists, in a few places surveyed.
5. While fishing is dominated by men, women engage in some fishing from the shore and on the reef.
6. While bigger buildings, such as schools, are already being repaired in some locations, there was widespread destruction of community infrastructure, which people rely on for their daily lives and work.
KEY PRIORITIES
1. Improve availability of, and access to, food.
2. Rehabilitation, maintenance, and diversification of agricultural livelihood systems, strategies and assets.
TABLE OF CONTENTS
1. INTRODUCTION ... 6
A. BACKGROUND ... 6
B. OBJECTIVES ... 6
2. METHODOLOGY ... 7
A. PLANNING ... 7
B. AREA OF COVERAGE... 8
C. SUMMARY OVERVIEW OF THE ASSESSMENT ... 9
3. FINDINGS ... 10
A. WATER, SANITATION AND HYGIENE ... 10
B. SHELTER ... 24
D. EDUCATION ... 38
E. GENDER AND PROTECTION ... 42
F. EARLY RECOVERY, AGRICULTURE AND LIVELIHOODS ... 54
ANNEXES ... 60
ANNEX I: COMPOSITION OF ASSESSMENT TEAMS ... 60
ANNEX II: AREA OF COVERAGE AND LOGISTICS PLANS ... 60
ANNEX III: ASSESSMENT QUESTIONNAIRES BY CLUSTER OR THEMATIC AREA ... 60
1. INTRODUCTION
A. BACKGROUND
Tropical Cyclone (TC) Pam struck Vanuatu on 13 March, causing widespread damage across all six provinces (Shefa, Tafea, Malampa, Penama, Sanma and Torba) and affecting an estimated 188,000 people, more than half of the country’s estimated population of 272,000. To gain immediate clarity on the impact of the disaster, the Government of Vanuatu, supported by humanitarian partners, led joint initial rapid needs assessments to the most affected areas of the island chain from 18 to 24 March. These assessments found that Shefa and Tafea, where all of the 11 confirmed fatalities occurred, were the hardest-hit provinces.
Information collected during this first phase was detailed enough to inform immediate response planning and the development of the Flash Appeal launched on 24 April. However, it lacked the depth to advise medium and longer-term planning of humanitarian response and early recovery. The Government of Vanuatu, therefore, decided to undertake Second Phase Harmonized Assessments at the community level in the five most-severely affected provinces of Shefa, Tafea, Malampa, Penama and Torba. From 1 to 8 April, 25 government-led teams assessed 23 islands in those provinces. The teams assessed humanitarian needs across six thematic areas: Water, Sanitation and Hygiene (WASH); Shelter; Health and Nutrition; Education; Gender and Protection; and Early Recovery, Agriculture and Livelihoods.
B. OBJECTIVES
The main objectives of the assessment were the following:
1. To gather critical information in key Clusters/Thematic areas, which would provide a comprehensive picture of humanitarian situation in the affected area, highlighting residual humanitarian needs and gaps in life-saving assistance, as well as greater understanding of overall damage and loss, which will feed into early recovery and longer term reconstruction planning.
2. METHODOLOGY
A.
PLANNING
As a preparedness measure, the Government of Vanuatu had developed standardized cluster and sector-specific assessment forms, which had successfully been used to evaluate humanitarian and early recovery needs in the country following Tropical Cyclone Lusi in 2014.
These forms,1 also used in this assessment, are harmonized to complement each other and
additional evaluations, ensure complete data sets and allow for inter-sectoral analysis. The planning for the assessment was led by the National Disaster Management Office (NDMO) with the support of Government–led clusters and humanitarian partners from the Vanuatu Humanitarian Team (VHT). Using the results of the Initial Rapid Assessment as a baseline, 23 cyclone-affected islands were selected for assessment.
The NDMO liaised with the Provincial Authorities to inform the Area Council Secretaries during the planning process. The latter then worked with the Chairmen of Community Disaster Committees (CDCs) to select local teams closely cooperated with the enumerators before and during the assessment. Government-led Clusters, with support of the VHT and Cluster Co-Leads, developed sector-specific questionnaires which had been standardized and endorsed by the Government and the NDMO prior to Tropical Cyclone Pam.
Villages were grouped according to Area Council locations, with representatives coming to a selected central location depending on geography and population size. In each Central Hub, the following representatives were requested to meet with assessment teams:
• Every Village Chief
• A member of each Community Water Committee
• A group of up to 20 persons total per central hub, ideally from an number of different
villages and representing women, youth, people with a disability, children, elderly and female headed households and other vulnerabilities,
• Nurses and Teachers
The timing of the assessment coincided with Easter, which is one of the most important religious holidays in Vanuatu. The process was thus split into two tranches: Shefa and Tafea provinces were assessed on 1 and 2 April, while Malampa, Penama and Torba provinces – on 7 and 8 April.
Australia, France, New Zealand, Solomon Islands and Tonga provided military assets to
transport the teams between and within the affected areas.2 They were greatly supported by
the Vanuatu Police naval assets.
1
Annex III: Second Phase Harmonized Assessment Questionnaires
2
B.
AREA OF COVERAGE
Assessments on Efate Island, which has an estimated population of 86,250, were carried out by the Shefa provincial government within the first week of the cyclone impact. Standardised assessment forms endorsed by the NDMO were used in all of Efate’s eight Area Councils. Results were supplemented by reports from Community Disaster Committees and compiled by Area Secretaries into Area Council Summary Reports. Findings in Efate were shared with the NDMO and Clusters for response planning and action, and have been incorporated in this report.
In addition to Efate Island, the following islands were assessed during the joint assessments from 1 to 8 April:
ISLAND POPULATION VILLAGES AND SITES VISITED TEAMS
Shefa Province
Epi 5,651 Lamen Bay/Epi School, Lokopuwi Village, Mapvilao Village, Redstone Village
Team 1 and Team 2
Tongoa 2,243 Morua Village Team 3
Tongariki 274 Kokopak Village Team 3
Buninga 112 Mbarira Village Team 3
Emae 488 Worarana Village Team 4
Makira 93 Makira School Team 4
Mataso 61 Mataso School Team 4
Pele 423 Pilirua Village Team 12
Emao 767 Wiana Village Team 12
Nguna 1,479 Marie Village, Matua School, Ulatap Village Team A
Moso 239 Tassiriki Village, Sunai Village Team B
Ifira 721 Ifira community Team B
Tafea Province
Erromango 2,251 Port Narvin, Ipota Village, Unpongor Village, Umpon Yelongi Village
Team 9 and Team 10
Aniwa 299 Asavai Village Team 11
Tanna 30,770 Inaka school, Lenakel Village, Imaki village, Port Resolution, Kings cross school, Greenhill school
Teams 5, 6, 7, 8
Futuna 620 Ishia Village Team 11
Aneityum 978 Analgauhat School Team 11
Ambrym 7,218 Neuwa Village, Ulei Village, Wuro Airstrip Teams 6, 9, 10, 11
Malakula 25,682 Benenaveth Village, Wiaru Village, Lakatoro Village, Lambumbu Village, Rapaksivir Village
Teams 7, 8, 9
Paama 1,623 Liro Village, Selusa School, Lehili College Team 11
Penama Province
Maewo 3,836 Gambule School, Naviso School, Asanvari
Village,
Teams 2, 3
Pentecost 18,809 Lini Memorial College, Nambwarangiut Village, Renbura Village, Melsisi School, Tankarang Village, Pangi Village
Teams 3, 4, 5, 6
Torba Province
Mere Lava 591 Lekwel Village, Aot Village Team 1
C. SUMMARY OVERVIEW OF THE ASSESSMENT
A total of 113 enumerators (30 Women and 83 men) were deployed in 25 teams to 23 islands across four provinces. Some enumerators took part in both tranches of assessment. Diversity in terms of gender, age and disability among Key Informants was ensured. Assessment teams consisted of specialists from different Government Ministries and Departments, volunteers from the Vanuatu Red Cross and civil society organizations, as well as staff members of international NGOs and United Nations Agencies. Each team assessed the following six thematic areas through Key Informant interviews, focus group discussions and site
assessments3:
1. Water, Sanitation and Hygiene (WASH) 2. Shelter
3. Health and Nutrition 4. Education
5. Gender and Protection
6. Early Recovery, Agriculture and Livelihoods
Upon return, Cluster Leads and Co-Leads held debriefs with the enumerators, capturing direct observations and other information which may not have been recorded in the forms. Structured and unstructured information obtained during the debrief was useful in triangulating data and filling in information gaps.4
3
Annex III: Second Phase Harmonized Assessment Questionnaires
4
3. FINDINGS
A. WATER, SANITATION AND HYGIENE
Strong winds and intense rain damaged water and sanitation infrastructure, which raises health, protection, and education concerns. Almost two thirds of the WASH assessors believed that the situation in the community surveyed was severe required immediate attention. Based on assessments conducted by other clusters, damages are expected to have been similar on water, sanitation, and hygiene services at schools and health care facilities.
The intensity of damages depends on the distance to the eye of the cyclone. The eye passed over the island of Tanna, causing severe damage. Rainwater-dependent islands were also severely affected in the aftermath of the cyclone, as communities had limited alternatives. These islands include Tongariki, Mataso, Makira, Buninga, Nguna, Moso, Aniwa, South East Ambrym. Communities that practised open defecation prior to the cyclone faced increased health risks, as unimproved water sources have been contaminated.
OVERALL SHORT-TERM OUTLOOK
50% of communities in Shefa and Tafea Provinces expect the situation to worsen. In Penama the number stands at 20%, and in Malampa around 30%. This corroborates other data indicating that Tafea and Shefa are the most affected provinces.
WATER
KEY FINDINGS
1. Water systems have sustained extensive damage. Communities reported that access to water is their first priority.
2. Wind and debris destroyed rainwater catchment intake areas (roofs) and gutters, completely damaging such systems in the provinces of Tafea (88%), Shefa (32%), Malampa (12%), and Penama (6%).
6 4
23 10 43
1 1
9
8 1 18
12
7 13 8 40
0% 10% 20% 30% 40% 50% 60% 70% 80% 90% 100%
Malampa Penama Shefa Tafea Grand Total
Short-term outlook
Crisis is worsening Need detail assessment when people are settle
3. Poor water quality was found in all sites tested outside of Port Vila from debris, sediment, and sea water, showing a need for water treatment prior to drinking. Less than half of the households reported using some form of water treatment.
4. Fallen trees and landslides damaged piped water systems, especially those which were older and poorly constructed or maintained.
5. Debris, trees, rocks and sedimentation blocked spring water intakes.
6. Power failure and mechanical damages has caused failure of pumped water systems.
KEY PRIORITIES
1. Provide immediate life-saving water supply to affected areas by water distributions, deployment of generators, water treatment units and tarpaulin distributions to restore rainwater harvesting.
2. Undertake immediate repairs and cleaning of affected drinking water systems and establish back-up sources of water to increase community resilience.
3. Minimize the risk of communicable diseases by providing household water treatment and storage items, complemented with key health messages.
4. Restore access to safe drinking water at schools and health care facilities.
OVERVIEW
1. Water availability. More than 50% of the community have reported to have less than 3 litres of drinking water available.
The variation between provinces is significant. The provinces of Tafea and Shefa have much less access to water than the provinces of Penama and Malampa which confirms other data on losses on water infrastructure being much more extensive in Tafea and Shefa.
< 3L 57% > 3L
43%
2. Damage for community systems. According to the Department of Geology, Mines and Water Resources (DGMWR), the following damages per systems have occurred:
Rainwater harvesting (RWH). Damages to roof collection, gutters, downpipes, and tanks have resulted in non-functional rainwater harvesting systems. The majority of damage is to roofs and gutters, though tanks were also damaged or broken. Based on assessment results, all RWH systems without covered tanks have been contaminated and need cleaning.
Direct Gravity Fed systems (DGF). Pipes were broken by fallen trees and landslides. Systems that did not have their pipe works fully covered sustained more damage. Intake structures were damaged due to landslides and blockage, especially where the intakes were not well-protected from runoff and sediment. Indirect Gravity Systems (IDGF). Indirect gravity systems suffer from similar damage to pipes as the DGF, with additional damage or failure of pumps. Most electric operating systems need emergency power supply, which is not captures in this figure. Some systems have been damaged at the pump due to fallen trees and collapsing buildings.
Hand pumps (HP). Hand pumps have sustained limited damage. Hand pumps are rather robust concerning cyclones and not widely found across Vanuatu, hence the limited of damage. The use of
7 4
33 14 58
11 16
11 6 44
0% 10% 20% 30% 40% 50% 60% 70% 80% 90% 100% Malampa
Penama Shefa Tafea Grand Total
Average quanity of drinking water available per province
< 3L > 3L
272
48
12 17
Community RWH
DGF IDGF HP
hand pumps could be considered to be promoted as they are found to be more resilient than other sources.
Wells. The well, a traditional water source typically constructed by communities and unprotected from runoff and flying objects sustained extensive damage. Many have been polluted with biological contamination, and in few instances with salt water, by the wind and the rain. Approximately two thirds of the wells are not working and are in immediate need of repairs and clean up.
Distribution per province. The data is further disaggregated per provinces below. Shefa Province has reported the most damages on community rainwater harvesting systems.
open wells working
30%
Open wells broken
70%
Open wells
184
30
20
38 34
6 2 6
6 6
0 0
10
2 1 4
Shefa Tafea Penama Malampa
Damages per system per province
3. Damage to private rainwater harvesting systems. Based on pre-Pam national surveys, 37.1% of the rural households in Vanuatu depend on rainwater harvesting. A large extent of these households have privately owned rainwater harvesting systems. The scope of damages to these systems is believed to be extensive. Rainwater harvesting systems include rainwater catchment structures, rainwater guttering and rainwater harvesting tanks. The most vulnerable component of the system is the catchment structure (usually a roof), as it is more vulnerable to damage caused by winds. The data for the rainwater harvesting catchment areas and gutters has been sourced from the Shelter Cluster data using housing structures damages as a proxy indicator. Questions about rainwater harvesting tanks were asked during the WASH Cluster assessment. Rainwater catchment and gutters. Rainwater harvesting catchment areas are usually based on roofing structures of individual houses and community buildings. The Shelter Cluster reports that approximately 32% of the houses have been damaged. As the roofing structure is most commonly damaged, the WASH Cluster estimates that in total 24% of the rainwater catchment structures have been damaged.
Wide variations between provinces can be observed. They are directly related to the intensity of the cyclonic winds received: in Tafea, which received the strongest winds, the damage to rainwater catchment areas is estimated to be 88%, while for Penama, the damage to the rainwater catchments is expected to be only 6%. The assessment team reported similar results; however, the guttering of rainwater harvesting systems were found to be damaged across the four provinces.
damaged 32% not
damaged 68%
Damaged houses
12% 6%
32%
88% 32%
88% 94%
68%
12% 68%
0% 10% 20% 30% 40% 50% 60% 70% 80% 90% 100%
Malampa Penama Shefa Tafea total
Damaged houses- per province
Rainwater harvesting tanks. More than 25% of the rainwater harvesting tanks are no longer functional. The damages in the tanks are mostly due to fallen trees and other items destroying tanks. Open rainwater harvesting tanks – without a lid - have been all polluted with leaves and branches and all now need cleaning.
4. Water quality
Water quality testing. The overall majority of water resources are biologically contaminated as per water quality testing results from the Department of Geology, Mines and Water Resources (DGMWR). The DGMWR collected samples of 22 different systems around Efate, of which only one system was found to be safe - the UNELCO waters supply. The other samples, taken from various systems, piped water supply, wells and rainwater harvesting exceeded the World Health Organisation (WHO) standards for water quality and are thus not safe for human consumption. This is partially caused by the cyclone due to run off and pollution by leaves, and other biological objects that contaminated the sources. In the absence of a baseline, it can only be expected that this contamination is also a pre-Pam issue, due to sanitary risks around water sources. It is therefore advised to treat water before consumption, by boiling, water purification tablets of chlorination.
Household water treatment and safe storage. As per assessment results, the majority of people do not treat their water. From those who treat their water, the most preferred option is boiling of water followed by using disinfection tablets and chlorination. As this is self-reported data by communities, and the assessment team indicated a much lower proportion of household water treatment being observed, it could be expected that the actual numbers might be much lower.
households boiling 28%
households chlorinating
6%
households using tablets
13% not using water
treatment 53%
Household water treatment
RWH working
75% RWH
tanks broken
25%
Variation between provinces is significant. The most affected districts have a much higher rate of water treatment than the lesser affected provinces. This could be attributed to the need and the joint efforts made by the WASH & Health cluster to promote household water treatment, by messaging and distributions, which has focussed on the worse effected areas. Penama, being less affected, shows a high need of hygiene messages as less the 10% of the households practise household water treatment.
Water storage. Water storage options, an important tool to mitigate the shortage of water and ensure the water quality during storage. Half the number of households have some means of water storage with a narrow neck or lid.
1270 527
314 42
2153
57 406
0 1
464
437 406 87
37
967
510 489 1119
1896
4014
0% 10% 20% 30% 40% 50% 60% 70% 80% 90% 100%
Shefa Tafea Malampa Penama Total
Household water treatment
households boiling households chlorinating households using tablets not using water treatment
households with water containers
51% households
without water containers
49%
The variation between districts is limited, with a lightly higher share of households in the worse affected provinces.
5. Severity ranking and outlook
Almost two-thirds of the WASH assessors believed that the severity of the situation need immediate attention. This situation was found to be most critical for Shefa and Tafea and in particular for communities without alternative water sources. The severity was substantially less severe in the provinces of Malampa and Penema.
1418 926 782 802
3928
856 902 913 1174
3845
0% 10% 20% 30% 40% 50% 60% 70% 80% 90% 100%
Shefa Tafea Malampa Penama Total
Household access to containers - per province
households with water containers households without water containers
8%
25% 61%
6%
Severity Ranking: Water supply
Green - Relatively normal situation or local population able to cope with crisis: no action required
Orange - Situation of concern: surveillance required
Red - Severe situation: urgent intervention required
A similar picture is seen in terms of the short term outlook. Tafea and Shefa have a much more negative outlook and around 70% of the respondents answer that there will be a critical shortfall in water quantity in the next month.
2 5 1
8
1 3
2 6
8 5 9
3
25
7 9 29
15 60
0% 10% 20% 30% 40% 50% 60% 70% 80% 90% 100%
Malampa Penama Shefa Tafea Total
Severity of water supply
Green - Relatively normal situation or local population able to cope with crisis: no action required Yellow - Lack of/unreliable data: further assessment required
Orange - Situation of concern: surveillance required Red - Severe situation: urgent intervention required
12 12 13
6 43
6 8 31
14 59
0% 10% 20% 30% 40% 50% 60% 70% 80% 90% 100% Malampa
Column Labels Penama
Shefa Tafea Grand Total
Shortfall of water in the next month?
SANITATION
KEY FINDINGS
1. Nearly all sanitation superstructures have been destroyed, especially those made of bush materials, with little availability of materials for rebuilding. Women, children, and vulnerable people now lack privacy and, in some cases, safe, bathing facilities.
2. Substantial increase in open defecation and sharing of latrines by multiple people due to lack of private toilets. 30% of the communities reported that they have resorted to open defecation since the cyclone, compared to 2.5% rural open defecation baseline (2013 Demographic and Health Survey).
3. Nearly all sanitation substructures are intact, with less than 10% damage from flooding.
KEY PRIORITIES
1. Eliminate health and protection risks from open defecation by restoring household sanitation structures.
2. Restore safe sanitation facilities at health care facilities and schools.
3. Increase knowledge and practice of safe hygiene and sanitation behaviours complemented with improved sanitation facilities.
OVERVIEW
1. Damages to sanitation. Due to the winds and fall trees most of the sanitation superstructures have been destroyed, especially in rural areas where bush materials had been used. The data for housing damages used by the Shelter Cluster could be used as a proxy indicator for the number of sanitation superstructures damaged. As per reports from the assessment teams, this situation is worsened in the provinces of Tafea and Shefa Provinces where replacement materials are in limited availability after the strong winds blew them away. As a result, people have to share facilities or practise open defecation. Issues of protection have emerged as limited privacy is currently provided.
12% 6%
32%
88% 32%
88% 94%
68%
12% 68%
Malampa Penama Shefa Tafea total
Damaged houses- per province
Pre-cyclone improved sanitation coverage was 52.7% for rural households, and 18.7% of households were sharing toilets with other families as per the 2013 Demographic Household Survey (DHS). Communities reported lower access to functional toilets following the cyclone. Though it is expected that that a higher proportion of toilets has been destroyed in Tafea and Shefa Provinces, the ratio of toilets per household is actually the lowest in Penama. This could be attributed to higher levels of sharing toilets in these provinces before the cyclone.
2. Defecation practise. The assessments show that 30% of the communities, people are going for open defecation, compared to 2.5% open defecation for rural households as per 2013 DHS. This significant increase is most likely a result due to the destroyed superstructures, and limited materials to restore the superstructure. 25% of the communities reported that people are using a community toilet, while only 45% of the communities reported that people are using family latrines. The increase in open defecation is a direct health risk. The change from family toilets to public toilets and open defecation accompanies also a protection risk for women.
1307 911
840 510
2274 1828
1520
1976
Shefa Tafea Malampa Penama
# Households - # functional toilets
households toilets
13%
17%
25% 45%
Defecation Practise
Open defecation, not in a defined and managed defecation area
Open Defecation, in a defined and managed defecation area
Public toilets
The distribution per defecation practises is not linear to the expected damages to household latrines. As defecation practises is influenced by a multiple social, cultural and enviornmental factors, people will find their own mitigaiton strategies as per context. Penama seems to have the highest level of open defecation, which could also reveal long standing practises of the communties interviewed.
3. Toilet user ratio. Only 80% of communities were able to estimate the average number of users per functioning toilet. Of these communities that were able to respond, 25% reported that toilets were being shared by more than 20 people, indicating that there were still multiple families sharing sanitation facilities. Protection aspects of these toilets needs to be addressed if sharing is to continue to avoid safety, security, and dignity risks.
6 5 2
13
2
1 7
7 17
4
6 16 26
12
7 16 11
46
0% 10% 20% 30% 40% 50% 60% 70% 80% 90% 100% Malampa
Penama Shefa Tafea Grand Total
Defecation Practise- per province
Open defecation, not in a defined and managed defecation area
Open Defecation, in a defined and managed defecation area
Public toilets
Family toilets and shared family toilets
<20 62%
21 - 50 5% 51 - 100
6% >100
7%
Do not know 20%
HYGIENE
KEY FINDINGS
1. Nearly half of the households have access to soap, but less than 30% are using it.
2. Two-thirds of communities did not have access to sanitary protection materials for girls and women.
KEY PRIORITIES
1. Promote safe hygiene behaviour using mass media, visits from health officers, health promotion teams and using traditional leadership and communication means.
2. Prevent the spread of communicable diseases by ensuring that households have access to soap and water for hand washing and bathing.
3. Restore dignity by ensuring the availability of menstrual hygiene materials for girls and women, and by providing safe and private bathing facilities.
OVERVIEW
Hand washing with soap is one of the most critical behaviour patterns to prevent diarrhoea outbreaks. The data suggests that 47% of the households have access to soap, however less than 30% use soap. The reasons stated by respondents for not using soap were lack of water and limited awareness. A combination of providing water and hygiene promotion is required to increase the usage.
The variation between provinces in terms of access and usage varies. Tafea seems to have the highest usage figures, while Penama has the lowest. It could be that the worse-affected location has received more intensive messages. Hygiene promotion should be rolled out across the provinces.
HHswith soap
47% HHs
swithout soap
53%
Households access to soap
HHs using
soap 30%
HHs not using
soap 70%
Menstrual hygiene management. Nearly two-thirds of communities reported that they did not have access to sanitary protection materials for menstruating women. This poses a health and dignity problem for girls and women living in these communities and should be addressed by initial distributions of NFIs while private sector and traditional options return.
The analysis per province reveals that Malampa has the least access compared to the highest levels being in Shefa Province.
1307 911 840 510
3568
967 917 855 1466
4205
0% 50% 100%
Shefa Tafea Malampa Penama Total
Households with access to soap - per province
households with soap households without soap
617 980 568 144
2309
1657 848 1127 1832
5464
0% 50% 100%
Shefa Tafea Malampa Penama Total
Households using soap - per province
Households using soap households not using soap
HH with access to Menstrual hygiene
35% HH without acces
65%
Households with access to menstual hygiene materials
0% 20% 40% 60% 80% 100%
Shefa Tafea Malampa Penama Total
Households to Menstrual Hygiene materials- per province
B. SHELTER
KEY FINDINGS
1. Many communities have received shelter assistance and are recovering fast.
2. Population and damage figures, especially in urban areas, are much higher than estimated. 3. Gaps in coverage remain, especially in Port Vila and Tanna Island.
KEY PRIORITIES
1. Tarpaulins remain a priority to meet outstanding needs and support WASH interventions.
2. Ongoing monitoring of gaps and targeting of vulnerable groups.
3. Communities are turning to recovery options and need more permanent roofing materials, including traditional thatching materials, nails, and construction materials.
4. Education, information and training on safe shelter construction.
5. Information management, including communication with affected communities and feedback mechanisms.
OVERVIEW
Shelter assessment teams representing Shelter Cluster agencies travelled to Areas Councils across the cyclone-affected areas and interview key informants, including village leaders, Area Council Secretaries, and Community Disaster Committee (CDC) representatives. As such, this provided the cluster with an overview of the response so far, which will also be used in conjunction with shelter-specific assessments at the household level to ascertain precise information about relief, recovery and residual humanitarian needs. This summary of findings also includes information about Efate, based on a separate shelter-specific vulnerability assessment.
There has been significant local recovery in many communities, although gaps remain. This is especially the case in Tanna Island, which was badly affected by the cyclone, and in urban Port Vila, which has a high number of people living on the urban periphery and in informal settlements. A Shefa Provincial Government enumeration is ongoing for peri-urban areas of Port Vila; population estimates appear higher than previously thought, especially in informal settlements with a high population density such as Blacksands. Tarpaulin remains a key need, as it can be used for shelter, water harvesting, kitchens and toilets. Further, key informants reported that shelter recovery tended to be lower for vulnerable groups, particularly people living with disabilities and female-headed households.
There are also different experiences depending on whether the household was rural or urban. Initial feedback indicates that there has been migration to Port Vila from rural Efate following TC Pam and this has placed pressure on aid distributions based on earlier population estimates. Evacuation centre populations were initially high in Port Vila but have all closed as shelter relief items became available, allowing people to return home to rebuild on the site of their original houses. Evacuation Centres and host families remain an issue in Tanna, however, where shelter relief items have been slower to arrive. Gaps remain in urban slum and informal settlement rebuilding with aid only now reaching some urban and peri-urban pockets of Port Vila owing to an initial focus on more difficult to reach outer islands and a freeze on distribution in the capital as assessments were carried out during the initial phases of the response. In urban areas, the following obstacles to safe shelter were identified: lack of permanence, concern over the loss of cash livelihoods, and insecurity of tenure.
Based on interviewees’ feedback, the following shelter priorities were identified. Although there has been a significant shelter distribution, some the affected communities had not received tarpaulins and there were concerns about continued leaks during heavy rain. Communities also expressed concerns about building skills to assist them to build back better. An absence of trained carpenters was identified as an obstacle to a ‘build-back-better approach’. Some communities were found to still have families in evacuation centres or living with host families but were seeking shelter assistance to help them to return to their places of origin. A more general concern was expressed about fairness in the distribution of relief items with concerns that not everyone was eligible for the same levels of assistance.
Assessment teams reported several positive trends across the areas visited. Communities are helping each other to rebuild and self-recovery in some places has been rapid with communities reconstructing their homes. Assessment teams reported that they were effectively employing local, context-specific skills and materials for reconstruction, including recycling from destroyed buildings with strong links to Community Disaster Committees. There was a high degree of preparedness with people tying down roofs and early warning information widely disseminated. There were differing accounts of the appropriateness and safety of concrete structures during the cyclone with many communities preferring traditional buildings for temporary refuge. In Epi Island, much of the livestock had survived but damage to fences meant that the animals had been freed and caused further damage to crops.
Province Island
Caseload (Destroyed or Damaged) Total HH with Tarp Distribution Completed Total HH with Tarp Distribution Ongoing
Total HH with Tarp Distribution Planned TOTAL HH WITH TARP Theoretical Final Gap Malampa
Ambrym 518 0 0 554 554 0
Malekula 0 0 0 0 0 0
Paama 353 0 450 0 450 0
Penama
Ambae 28 0 0 0 0 28
Maewo 4 0 0 0 0 4
Merelava 0 0 0 0 0 0
Pentecost 376 0 0 101 101 275
Shefa
Emau 155 129 0 0 129 26
Makira 19 35 0 0 35 0
Mataso - Matah
Alam 12 20 0 0 20 0
Tongariki 55 55 0 0 55 0
Tongoa 454 110 500 0 610 0
Port Vila 1892 1917 0 1401 3318 0
Efate RURAL 2668 1557 2110 823 4490 0
Buninga 23 30 0 0 30 0
Emae 99 115 206 0 321 0
Lelepa 83 0 107 0 107 0
Moso 48 16 29 0 45 3
Nguna 285 0 300 0 300 0
Pele 91 33 0 0 33 58
Tafea
Aneityum 0 247 0 0 247 0
Aniwa 40 138 0 0 138 0
Erromango 405 831 0 0 831 0
Futuna 0 0 0 0 0 0
Tanna 5108 2322 1039 5262 8623 0
Ambrym 518 0 0 554 554 0
Malekula 0 0 0 0 0 0
Paama 353 0 450 0 450 0
C. HEALTH AND NUTRITION
KEY FINDINGS
1. A high proportion of health facilities were damaged. However, all but 7 remain partially (19) or fully (45) functioning.
2. The provision of health services has decreased across all sectors, and in particular in the general clinical and in the child health services.
3. Overall, the impact on the capacity of the health services to deliver curative and preventive services has been significant, especially given the fragility of the pre-cyclone health system which had a low level of health staff, particularly with regard to medical doctors and midwifes.
KEY PRIORITIES
1. Repair and re-open 6 destroyed and the 9 health facilities with major damage. Re-establish all health facilities to fully functioning status, including adequate water and sanitation services.
2. Ensure adequate human resources are available to address the increased health needs of the communities, and avoid a drop in service delivery coverage following the departure of foreign medical teams.
3. Ensure availability and distribution of essential medicines, including immunisation and cold chain capacity.
4. Finalize and start the implementation of a “building back better” strategic plan for the recovery of the health sector addressing pre cyclone health inequities.
OVERVIEW
Cyclone Pam hit Vanuatu on 13 March affecting 22 islands in four provinces. Within these islands, there are 71 health facilities: hospitals (2), health centres (19) and dispensaries (50). This report summarizes the findings of the rapid health needs assessments and the multi-cluster assessments conducted in the weeks following the cyclone.
DAMAGE TO HEALTH FACILITIES
Table 1. Damage to health facilities by health facility type on affected islands, Vanuatu, March 2015.
Facility Destroyed Major Minor None Total
D 5 2 28 15 50
HC 1 6 7 5 19
Prov. H 1 1
Ref. H 1 1
There are 71 health facilities on islands affected by cyclone Pam, excluding aid posts (8 non-government owned facilities are included in this report). Assessments of varying detail have been conducted in all facilities (table 1). Of the 71 facilities that have been assessed there were 6 facilities that were destroyed and 9 facilities with major damage (table 2). Minor damage was reported in 35 facilities and there was no damage reported from 19 facilities. All assessed health facilities remain operational except for 7; Imere (Efate), Naviso (Maewo), Ikiti and Kitow (Tanna), Amboh (Tongariki), Nimair and Tavalapa (Tongoa). Imere, which presents only minor damages, is closed due to a lack of staff after the cyclone.
Table 2. Health Facilities destroyed or sustaining major damage, by island and province, Vanuatu, March 2015
Province Island Facility name Type of
Facility Status Damage
Shefa Tongariki Amboh D NF Destroyed
Tongoa Nimair
(bongabonga) D NF Destroyed
Efate Paunangisu HC PF Major
Epi Port Quimmie D PF Major
Tongoa Silimauri HC FF Major
Nguna Silmoli D PF Major
Tongoa Tavalapa
(Leimatuk) D NF Destroyed
Epi Vaemali HC PF Major
Emae Vaemauri HC PF Major
Tafea Tanna Green Hill HC PF Major
Tanna Ikiti D NF Destroyed
Tanna Kitow (Nagus
Kasaru) HC NF Destroyed
Tanna Lenakel Prov. H PF Major
Penama Maewo Naviso D NF Destroyed
Malampa Ambrym Utas HC PF Major
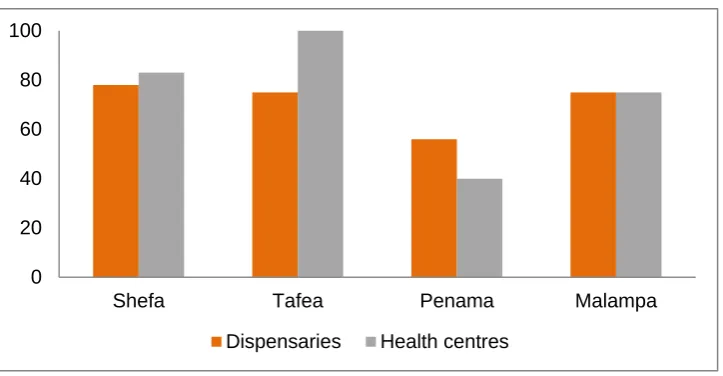
Shefa was the most affected province and 21 of 24 (87.5%) of health facilities have been damaged with 3 of 4 health facilities on Tongairki and Tongoa destroyed (Table 2).
In Tafea province, 9 of 12 dispensaries and all 4 health centres were damaged. The Provincial hospital was severely damaged (82% of all facilities). Ikiti dispensary and Kitow health centre are not functioning.
Graph 1. Proportion of facilities damaged, by type and by province, March 2015
Graph 1 shows the imbalance of the impact of the cyclone on the health facilities, with a prominent impact on health centres, which cover the critical function in delivering primary care in the Vanuatu health system.
HUMAN RESOURCES
1. Current human resources in the affected islands. The Sphere Standards in Health Action, one of the most widely known and internationally recognized sets of common principles and universal minimum standards in life-saving areas of humanitarian response, require a minimum of 22 health workers/10,000 people in population. Health Workers in Vanuatu include the following categories: doctors, nurse practitioners, midwifes, registered nurses and nurse aids.
Table 3. Human Resources in 22 Affected Islands, March 2015
Province Island/Health Zone Population Medical Doctor Practitioner Nurse Midwife Nurse Nurse Aid
Total number of health
workers
Health workers/
10,000 population
Ambrym 8481 1 1 2 4 3 11 13
Malampa
Paama 1708 0 0 0 2 2 4 23
Pentacost 17525 2 0 2 17 12 33 19
Penama
Maewo 7275 0 0 0 4 5 9 12
Health Zone 1
77386 13 4 11 116 17 161 21
Islands included - Efate (excluding Paunangisu Health Centre), Erakor, Ifira
Shefa Health Zone 2 8311 0 0 1 4 4 9 10
0 20 40 60 80 100
Shefa Tafea Penama Malampa
Islands included - Emau, Lelepa, Moso, Nguna and
including Paunangisu Health
Centre
Health Zone 3
3512 0 0 2 5 4 11 31
Islands included - Emae, Tongariki, Tongoa
Health Zone 4
8691 0 0 1 4 1 8 9
Islands included - Epi Island
Tafea
Tanna 30894 1 0 5 26 8 40 13
Other Islands -
Aneityum, Aniwa,
Erromango, Futuna 3864 0 0 0 6 1 7 18
Total numbers of health workers 167647 17 5 24 188 57 293 17
The numbers of health staff presented in the data include health workers at government and municipal operated health facilities. Privately owned hospitals and clinics were not included in the dataset. The numbers of health staff presented were assessed as before the cyclone. Of the data that was collected after the cyclone, a decrease of only four health staff noted. This included one midwife in Malampa Province and three nurses in Tafea Province. The staff at the destroyed health facilities have been repurposed to serve other areas or for the ongoing measles vaccination campaign.
The overall national ratio is far from the threshold of minimum 22 health workers per 10,000 prescribed in the Shpere standards and WHO. The breakdown by island or health zone presented in Table 3 indicates an unequal distribution of the health workers. The high concentration in the capital Port Vila brings the ratio up to 21 for almost a quarter of the population of the country. The ratio drops to 13 in other provinces, with the exception of small islands where the very small population of catchment areas of their health facilities increases the ratio. The table presents the total population by island and zone, to weigh which proportion has a high or low ratio of health workers per 10,000 people.
A second important observation relates to the composition of the overall workforce. Midwifes and nurse practitioners require four years and 6 months of training, registered nurses need three years of training, and nurse aids only nine months. While nurse aids have limited official training time, they often replace registered nurses as the only health staff available for some dispensaries in remote areas. With nurse aids representing 36% of the workforce outside the referral hospital, the quality of care becomes a concern particularly in dispensaries operated only by a nurse aid.
2. Foreign Medical Teams. A total of 20 Foreign Medical Teams (FMTs) have provided support to Vanuatu during the first month after the disaster. 11 had left Vanuatu by 6 April after completing, on average, a two-week deployment. All FMTs deployed to Vanuatu are of Type 1 and provide outpatient care either through fixed clinics or mobile teams, with the exception of one FMT Type 2, which supported referrals at the Vila Central Hospital (VCH) with outpatient and inpatient care surgical capacities for trauma care and general surgery and intensive care from the day two after the cyclone. Two FMTs provide specialized services at the VCH.
During the first month of the operation, over 140 medical staff have been deployed with FMTs to support the Ministry of Health (MoH) and deliver, among other services, over 9,000 consultations. The majority of FMTs are working at MoH health facilities, supporting their staff either static or providing frequent support to health facilities from a fixed location. A small number of FMTs provide consultations in communities where there is no health infrastructure.
The number of FMTs will further decrease with only found still being operational at the end of April. Vanuatu has received support in health service provision through mobile clinics conducted by NGOs for many years and it can be expected that this form of support will pick up again in the coming months.
WATER AND SANITATION IN HEALTH FACILITIES
1. Water. The availability of an adequate water supply was assessed, including availability of water, uninterrupted supply of water and whether there was adequate storage of water (Table 3). The risk of contamination to the water supply was also assessed. Data was made available from 64 facilities. An inadequate supply of water was reported from 31 (48%) facilities. Water supply was unchlorinated in 50 facilities (78%). Water supply was considered to be at risk of environmental contamination in 18 facilities. Twenty-six facilities are functioning without an adequate supply of water.
Table 3. Health Facilities (31) with Inadequate Water Supply
Province Island
Name of Health facility
Health facility type
Operation
al status Damage
Sufficient water supply
No interruption s to water supply
Sufficient water storage
Shefa Tongoa Silimauri HC FF Major Yes No Yes
Lelepa Amauri D FF Minor No Yes Yes
Tongariki Amboh D NF Destroyed No Yes Yes
Efate Paunangi
su HC PF Major No Yes Yes
Epi Port
Quimmie D PF Major No Yes Yes
Epi Vaemali HC PF Major No Yes Yes
Emae Vaemauri HC PF Major No Yes Yes
Tongoa
Nimair (bongabo nga)
D NF Destroyed Yes Yes No
Tongoa
Tavalapa (Leimatuk )
D NF Destroyed No Yes No
Tafea
Erromango Dillions
Bay D FF Minor Yes No Yes
Tanna Imaki HC PF Minor Yes No Yes
Tanna Lenakel Prov. H PF Major Yes No Yes
Tanna
Port Resolutio n
D PF Minor Yes No Yes
Tanna Ikawaram
anu D FF None No Yes Yes
Tanna Ikiti D NF Destroyed No Yes Yes
Aniwa Rotebeka D FF Minor Yes No No
Erromango Ipota D PF Minor Yes Yes No
Erromango Port
Narvin D PF None Yes Yes No
Tanna Green Hill HC PF Major No Yes No
Penama Maewo Naviso D NF Destroyed Yes No Yes
Pentecost Bwatnapn
e D PF Major No Yes Yes
Pentecost Enkul D FF None No Yes Yes
Pentecost Ledunsivi HC FF Minor No Yes Yes
Pentecost Melsisi HC FF None No Yes Yes
Pentecost Tsingbwe
ge D FF None No Yes Yes
Malampa Ambrym Baiap HC FF None No Yes Yes
Ambrym Endu D PF Minor No Yes Yes
Ambrym Port Vato D PF None No Yes Yes
Ambrym Utas HC PF Major No Yes Yes
Paama Liro HC PF Minor Yes No No
AVAILABILITY OF HEALTH SERVICES
Multi-cluster assessments using the Health Resources Availability Mapping System (HeRAMS) tool were conducted on nine health centres and 13 dispensaries (22). The assessment was done across six areas of service: general clinical, child health, communicable diseases, STI, HIV/AIDS and sexual violence, maternal and newborn health, non-communicable disease and environmental health. There are between 3 and 7 services per each of these 6 areas, as detailed in the HeRAMS checklist adapted to the local health system. It is presented in the last part of the health sector multi-cluster form under Annex III.
Graph 2. Overall Health Services Availability at Health Centres and Dispensaries, pre and post-Cyclone
The provision of services declined is all areas following the cyclone. The greatest decline was in the provision of child health services, mainly due to the interruption of the immunization activities and school visits.
Graph 3. General Clinic Service Availability for Health Centres (9) and Dispensaries (13)
0 10 20 30 40 50 60 70 80 90 100
General Clinic Services
Child Health Communicable
Diseases
STI/HIV Maternal and
Child Health
Non Communicable
Diseases and Environemental
Health
%
o
f
ser
v
ices av
ailab
le
Area of services
% Before % After
0 10 20 30 40 50 60 70 80 90 100
Outpatient services Short hospitalisation Referral capacity Home care visits
%
o
f
ser
v
ices av
ailab
le
Service
The largest decline in general service provision was in referral capacity where there was a 36% decline. This decline is a result of a lack of telecommunications, physical barriers to movement by road and interruptions in transport availability (Graph 3). Home care visits were impacted by the availability of health staff.
Graph 4. Child Health Services Availability for Health Centres (9) and Dispensaries (13)
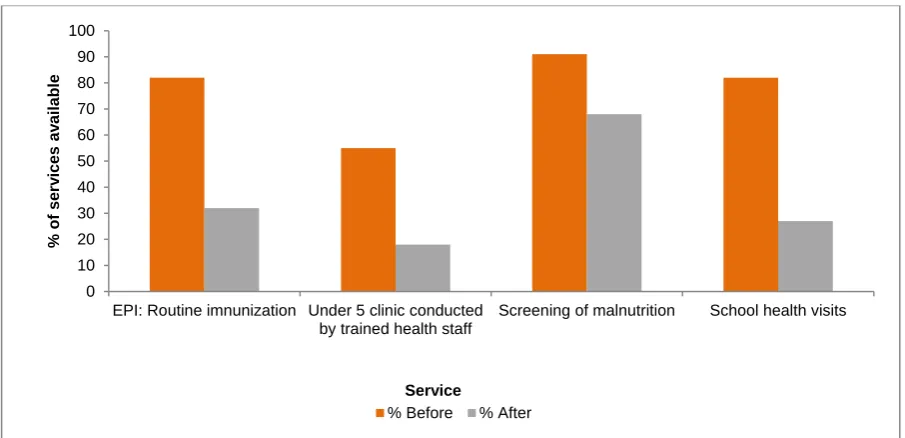
The availability of routine immunization has been reduced due to damage to vaccine fridges and solar panels, lack of available vaccines, and a reduction in available staff (Graph 4).
Prior to the cyclone, 33 facilities had a functioning cold chain: hospitals (2), health centres (17), dispensaries (14) (Table 4). After the cyclone, 25 of these facilities have information on the availability of cold chain; eight facilities report that vaccine fridges are no longer working. Of the 17 facilities with functioning cold chain, one facility is totally destroyed despite the vaccine fridge still functioning and two facilities report that they have no vaccines in stock. Therefore of the 25 facilities where information is available, only 14 facilities in affected islands are able to provide routine immunization services.
Table 4 Health Facilities (33) with Established Cold Chain Capacity
Province Island Name of Health facility Health facility type
Operational status
Cold chain after
Vaccine stock
Shefa Lelepa Amauri D FF ND ND
Epi Burumba D FF ND ND
Erakor Erakor (Kalmer Takau) D FF ND ND
Efate Paunangisu HC PF Yes Yes
Epi Port Quimmie D PF ND ND
Tongoa Silimauri HC FF Yes Yes
Nguna Silmoli D PF No No
Epi Vaemali HC PF ND ND
0 10 20 30 40 50 60 70 80 90 100
EPI: Routine imnunization Under 5 clinic conducted by trained health staff
Screening of malnutrition School health visits
%
o
f
ser
v
ices av
ailab
le
Service
Emae Vaemauri HC PF No No
Efate Vila Central Hospital Ref. H FF Yes Yes
Tafea
Tanna Green Hill HC PF No No
Tanna Ikiti D NF Yes Yes
Tanna Imaki HC PF Yes Yes
Tanna Kitow (Nagus Kasaru) HC NF No No
Tanna Lamlu (St Raphael) D FF ND ND
Tanna Lenakel Prov. H PF Yes Yes
Tanna Luonanen (Iouanhanen) D FF ND ND
Tanna Whitesands HC FF Yes Yes
Aneityum Yorien D PF Yes Yes
Penama Pentecost Abwantuntora (Mauna) HC FF Yes Yes
Pentecost Angoro D FF No No
Pentecost Aute D FF Yes Yes
Pentecost Bay Barrier D FF Yes No
Maewo Kerepei HC FF No No
Pentecost Ledunsivi HC FF Yes Yes
Pentecost Melsisi HC FF Yes No
Pentecost Namaram D FF No No
Maewo Nasawa D FF Yes Yes
Pentecost Pangi HC FF Yes Yes
Malampa Ambrym Baiap HC FF Yes Yes
Paama Liro HC PF Yes Yes
Ambrym Nebul HC FF ND ND
Ambrym Utas HC PF No No
*ND no data
Graph 5. Communicable Disease Services Availability for Health Centre (9) and Dispensaries (13)
0 10 20 30 40 50 60 70 80 90 100
Diagnosis and treatment of malaria
Diagnosis and treatment of TB
Diagnosis and treatment of yaws
%
o
f
ser
v
ices av
ailab
le
Service
The treatment of selected communicable diseases has been reduced due to the unavailability of microscopy and rapid tests, and of essential medicines (Graph 5).
Graph 6. STI and sexual violence services availability for Health Centre (9) and Dispensaries (13)
Sexual Transmissible Infections and sexual violence services have been disrupted due to damage to supplies, in particular stock out of essential drugs (Graph 6). The level of availability of services for sexual violence, such provision of emergency contraception, were extremely low well before the cyclone, highlighting an area that need special attention in the planning of the health sector recovery. Graph 7. Newborn Child Health Services Availability for Health Centre (9) and Dispensaries (13)
Maternal and newborn care-related services had an overall moderate decrease after the cyclone, but the situation is still alarming in this area. Indeed, maternal and neonatal mortality has been high in Vanuatu compared to the other Pacific island countries. The attendance of deliveries by skilled birth attendants has to be improved particularly in the rural areas, as well the quality of care of these services. Priority attention will be needed in planning selected interventions in the health sector recovery phase.
0 10 20 30 40 50 60 70 80 90 100
Postpartum care Family planning Antenatal acre Skilled care during
childbirth
%
o
f
ser
v
ices av
ailab
le
Service
% Before % After
0 10 20 30 40 50 60 70 80 90 100
Syndromic management of STI
Standard precautions Availability of free condoms Emergency contraception
%
o
f
ser
v
ices av
ailab
le
Service
Graph 8. Non Communicable Diseases and Environmental Health Services Availability for Health Centre (9) and Dispensaries (13)
While the availability of treatment of chronic conditions shows a moderate reduction, it shows a marked reduction for mental health, where the pre-cyclone level was already low. The need to provide care for mental disorders at primary care will need to be addressed possibly starting during the recovery phase. The outreach of environmental health services is coherent with the other reduction of outreach services in the school health and home visits, as highlighted in the previous paragraph, and it is related to the increased workload for curative services at the health facilities. The resumption of community based public health intervention is a priority to be addressed in the next phase.
0 10 20 30 40 50 60 70 80 90 100
Hypertension treatment
Diabetes treatment Mental health care Health facility safe waste disposal
Outreach environmental health
services
%
o
f
ser
v
ices av
ailab
le
Service
D. EDUCATION
KEY FINDINGS
1. 88 facilities, 32% of those assessed, were found to be completely destroyed.
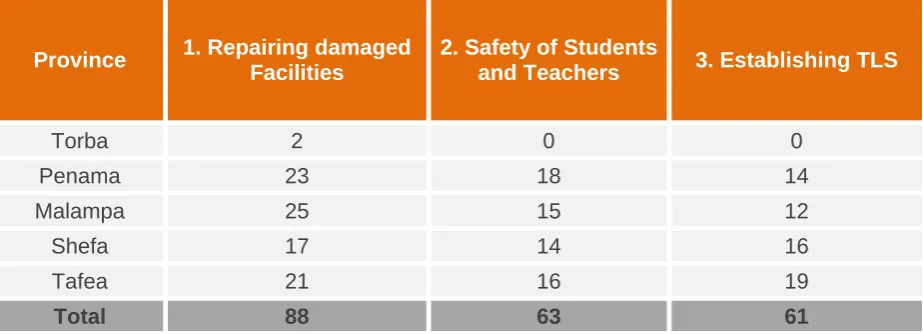
2. The three most immediate priorities identified by key informants at the assessed schools are (1) repairing damaged facilities (64%), (2) ensuring the safety of students and teachers (46%), and (3) establishing! Temporary Learning Spaces (45%).
3. Schools in Shefa and Tafea Provinces have the largest numbers of totally and partially damaged facilities. They also report the largest drop in access to toilets at education facilities - only 9% of schools toilets function in assessed schools in Shefa and 12% in Tafea.
4. Of the assessed schools, 17 reported the need for support in the provision of food to their students. responded to having feeding program in schools.
5. All assessed schools reported a need for basic WASH kits.
KEY PRIORITIES
1. Provide assistance in repairing damaged school facilities. 2. Provide teaching and learning resources to damaged schools. 3. Distribute basic WASH kits to affected schools.
4. Address the need for safe drinking water at affected schools.
5. Address the inability to pay school fees of some of the affected people. 6. Provide food for students at boarding schools.
OVERVIEW
Many School Heads, teachers, and Zone Curriculum Advisors (ZCAs) expressed their concern regarding school infrastructures. A total of 209 schools have been assessed in all selected assessment sites including Early Child Care Education (ECCE) facilities, Primary Schools, Secondary Schools and a few Rural Training Centres (RTCs). From the assessment data, 584 students enrolled in the assessed schools have been affected by TC Pam, however the real numbers are expected to exceed the above figure as, due to limited time spent on ground during the assessment, most of the enrolment figures were not completed.
SCHOOL FACILITIES
Chart 1: School Facility Assessment by Level of Damage
Chart 2: Percentage in total of all School Facilities by Level of Damages
Percentage of total destruction of primary/secondary schools and kindergartens:
primary/secondary schools 187 46%
kindergartens 218 54%
OTHER NEEDS AREAS IN EDUCATION
The Education in-depth assessment also evaluated WASH needs, access to safe drinking water, availability of learning and teaching resources and other essential needs in schools.
One of the questions asked during the assessment was the type of support that was most essential for schools or any learning centres after the cyclones. Schools were also asked to list their top three
0 50 100 150 200 250 300
Penama Malampa Shefa Tafea
School Facilities by level of damages & by
Province
No Damage Totally Destroyed Major Damage Minor Damage
35
16 24
13
10