Changing Cropping Pattern from Conventional to
Market Oriented Value Added Crops in Eastern Uttar
Pradesh, India: Variations and Causes
Adnan Shakeel
Department of Geography, Aligarh Muslim University, Aligarh, India Email: [email protected]
Paper no: 119 Received: 16 November, 2013 Revised: 19 February, 2014 Accepted: 09 March, 2014
Abstract
The study of cropping pattern is very important because it provide evidences about the changes that are taking place in landuse related to agriculture. The vast, extensive and densely populated state of Uttar Pradesh, while generally backward and predominantly agriculture is marked by considerable changes in cropping pattern. The study focuses on Eastern Uttar Pradesh, which is still identified as backward region in comparison to Western Uttar Pradesh. Changes in cropping patterns are examined from the pre-Green Revolution period (1950-53) to post-Green Revolution period (up to 2006-09) on the basis of data obtained from the Directorate, Ministry of Agriculture, Department of Statistics and Economics, Lucknow, Uttar Pradesh. Patterns of changes in the study area are shown by the proportions of land occupied by the respected crop to total cropped area and their proportion of production to the total agricultural production. The data shows that, area and production of certain crops such as fine cereals (wheat and rice) increased through out the study period and on the other extreme the area and production of our traditional crops like pulses, coarse cereals and small millets decreased. Some of the cash crops like oilseeds and sugarcane are also increasing, showing that cropping pattern is shifting from traditional to market oriented value added crops, which are more profitable and less risky to grow. Moreover, this shift in cropping pattern also affects the food and nutritional security of the masses.
Keywords: Cropping pattern, eastern Uttar Pradesh, green revolution, fine cereals, small millets, coarse cereals.
cropland in India. Since then, there has been a widespread change in cropping pattern in the region. In India during pre-independence or pre-green revolution period, self sufficiency in foodgrains has been the top priority of our policies, due to the challenges of feeding our vast population (Hazra, 2013). The signs of imbalance in cropping pattern started to come into view right from the early post Green Revolution. Technological changes brought by the green revolution caused significant shifts in land utilization, in favour of crops like fine cereals (wheat and rice) on the cost of area under coarse cereals, pulses and small millets (Chakravarti, 1973). There are number of factors which were responsible for this shift in the cropping pattern along with differential rates of technological change among crops, irrigation bias of new technology, causing shift of land away from dry crops in favour of irrigated crops and the associated policy of price support system as well as market intervention by the government in certain crops but not in other crops and changing relative price between different crops (Dantwala, 1986). The study of cropping pattern represents a significant aspect within the spatial dimension of agricultural geography as it provides a good base for regional planning (Mohammad, 1985 and Shafi 2006).
Literature Review
There are number of literature available which clearly show that area under pulses, coarse cereals and small millets has been taken away by the crops like wheat, rice and oilseeds etc. Narain (1977) in his study examined the changes in cropping pattern over two periods of 1953-54 to 1961-62 and 1961-62 to 1972-73. He observed that, low value crops such as coarse cereals lost a significant share of area to high value cereals like wheat and rice. Mian and Khan (1981) concludes on the basis of a survey undertaken in the district of Peshawar (Pakistan) that, farmers allocated 56.64 per cent of their land to cereal crops, 32.23 per cent to cash crops and the rest to other crops. Johl and Sidhu (1988) analysed the changes in cropping pattern in different states and country as a whole during the triennium ending 1984-85. They reported a decline of 3.85 per cent in area under coarse cereals and replacement of coarse cereals by fine cereals like wheat and rice. Bhat and Shah (2011) in there study opined that, there is a gradual change in the cropping pattern of two crops (wheat and rice) and the area under these crops has increased at the cost of cotton crops in Uzbekistan. Hashmi and Shakeel (2012) was also of the same opinion that after Green Revolution the changes which occurred in cropping pattern was in the favour of fine cereals at the cost of pulses, coarse cereals and small millets. Figures based on data shows the pattern of changes. The aim of this paper is to pursue explanations for the main changes within the Eastern Uttar Pradesh since 1950-53 to 2006-09.
Objectives
Materials and Methods
Methodology
Changes in the cropping pattern referred in the present study means, the changes in the proportion of cropland devoted to various crops. Change is measured here by taking percentage point difference between the 1950-53 and 2006-09 proportions of cropland under each crop. For example, if rice occupied 15 per cent of the cropland in 1950-53 and 24 per cent of the cropland in 2006-09, change is taken to be an increase of 9 per cent as the crop has improved its relative strength in the cropping pattern by two per cent. The study is based on secondary sources of data obtained from The Directorate, Ministry of Agriculture, Department of Statistics and Economics, Lucknow, Uttar Pradesh, India. The crops taken under consideration are wheat, rice, pulses (red gram, green gram, pea, chickpea, lentil and black gram), coarse cereals (barley, sorghum, pearl millet and maize), small millets (kodo, kakun, sanva, mandua, kutki), Sugarcane, oilseeds, potato and onion. The agricultural production in India is very much affected by the abnormality of weather conditions. Thus for removing the environmental irregularities causing a high level of fluctuations in area, production and yield, three years moving average has been taken (Mohammad, 1995). Growth rates of foodgrain crops have been calculated by using following equation.
GR = Vto – Vtn / Vtn * 100
Where, GR is the growth rates of foodgrains, Vto is the foodgrain production of the succeeding year and Vtn is the foodgrain production of the preceding year.
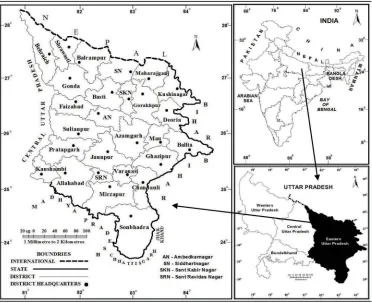
Study Area
Results and Discussion
Changing Cropping Pattern
During the course of Green Revolution, the Government of India took many important decisions related to land reform, declaration of minimum support price, public investment in irrigation, transport and marketing systems, establishment of seed production chain, installation of fertilizer factories, and farm machinery units, investment in research and human resource development (Nagarajan, 2000). All these efforts taken by the government provided stimulus for the development of agriculture, but also brought simultaneously rapid change in cropping pattern. Though the proportion of area under foodgrains has shown a declining change by 2.01 per cent and the share of production has experienced a positive change of 8.95 per cent in Eastern Uttar Pradesh, interesting inter crop variations can be observed (Table 1). For Eastern Uttar Pradesh as a whole, the main changes in cropping pattern taken during the period from 1950-53 to 2006-09 was the decline in area and production of pulses, coarse cereals and small millets, and increase in the area and production of fine cereals (wheat and rice). Comparisons have also been shown in area, production and yield of various foodgrain crops (Fig. 2). Changes in cropping pattern also took place in case of non-foodgrain crops, such as sugarcane, cotton, oilseeds and potato. The pattern of change within the region for these crops will now be examined.
Wheat
The crop that seems to have pushed forward in a real big way in eastern Uttar Pradesh is wheat. India became self sufficient in cereal production due to adoption of modern science and technology that created the ‘wheat revolution’ (Nagarajan, 2005). The proportion of wheat in the study area increased by 29.89 per cent (from 11.22 to 41.11 per cent) during 1950-53 to 2006-09 and this increase was more than that of any other crop (Fig. 3). With respect to area, wheat occupied the foremost position among the foodgrain crops. The area under wheat increased from 743.46 thousand hectares in 1950-53 to 3395.36 thousand hectares in 2006-09. The area since then has continuously increased as wheat cultivation became more profitable after the adoption of new seed-fertilizer technology during Green Revolution (Bhalla and Tyagi, 1989). Farmers all across Eastern Uttar Pradesh were in favour of growing wheat because of Government’s effort towards empowering the farmers with knowledge, creating an enabling environment, implementing farmer-centric policies and understanding the market-centric forces. Due to application of Green Revolution technology such as irrigation and modified varieties of seeds, wheat replaced gram (Chickpea) during the Rabi season in Eastern Uttar Pradesh and increase in area under wheat was mainly claimed by acquiring area under gram (Kumar, 1978; Mohammad, Bhalla and Tyagi, 1989 and Reddy, 2009). Some areas under crops like barley and pea have also been shifted to wheat and a little amount of commercialism in agriculture has started to become visible. The production of wheat has increased from 55.49 lakh quintals to a phenomenal amount of 884.36 lakh quintals during 1950-53 to 2006-09. The proportion of wheat production has experienced an increase of 18.98 per cent (4.87 to 23.84 per cent) during the study period (Fig. 3).
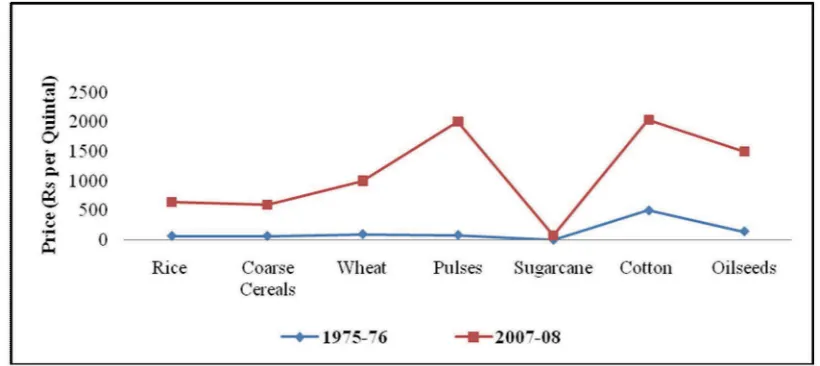
Wheat production has increased because farmers were provided with input-cum-technology package, free access to marketing and storage of output and a tax free ‘cost plus’ price. Also the lucrative minimum support and procurement price announced by the government, which was Rs 105 per quintal in 1975-76 increased to Rs 1080 per quintal in 2008-09 which further increased to Rs 1285 per quintal in 2011-12 (Fig. 4), substantial possession of wheat directly from the farmers field and technological advancement like availability of high yielding varieties if seeds, chemical fertilizers, development in the irrigation facilities are some of the factors which played effective role in increasing the area and production of wheat.
Rice
Rice is one of the most versatile crop plants. The cultivation of rice involves the most diverse crop eco-system in the world. Rice is the second major crop grown in Eastern Uttar Pradesh in terms of production and it ranks third in terms of increase in the proportion of area and production. The proportion of area and production under rice has experienced a positive change of 4.82 per cent (33.13 to 37.94 per cent) and 8.45 per cent (8.35 to 16.80 per cent) respectively, during 1950-53 to 2006-09 (Table 1). Much of Eastern Uttar Pradesh has good potentials for high rice yield. It has appropriate climate, vast areas of fertile soils and good water supply. Also some of the finest qualities rice such as Basmati,
Kalajeera, and Vishnu Prayag etc are grown here (Pathak, 1991). As a result, the area under rice has
increased from 2194.84 thousand hectares to 3134.00 thousand hectares during 1950-53 to 2006-09. The ease of accessibility of chemical fertilizers and development in the irrigation facilities for the cultivation of semi-dwarf modified varieties (MVs) of rice supported by the favourable public policy support and infrastructure development were some of the primary factors for rapid growth of rice in Eastern Uttar Pradesh. Rice is the most important substitute crop of red gram during the kharif season in Eastern Uttar Pradesh and increase in area under rice was mainly claimed by acquiring the area under pulses which were earlier sown as red gram. Moreover, the minimum support price (MSP) announced by the Government which was Rs 74 per quintal in 1974-75 increased to Rs 850 per quintal in 2008-09 and presently (2012-13) it is Rs 1250 per quintals. All these factors simultaneously operated in favour of rice. Farmers with the intention of maximization of profit and increasing net return per hectare of land started to cultivate rice and thus, its production has increased from 95.15 lakh quintals to 623.00 lakh quintals during 1950-53 to 2006-09. This phenomenal increase in the production of rice has largely come, not through increase in area but through increase in yield. The yield which was 434 kg per hectare in 1950-53 increased to 1988 kg per hectare in 2006-09. Rice in Eastern Uttar Pradesh is cultivated mainly on commercial basis for market and trading.
Pulses
This section gives an overall scenario of pulses. In context of India, pulses hold an important position because majority of population is vegetarian and pulses are the only source of protein to them. But inspite of this, the area and production of pulses is continuously declining giving a threat to the nutritional security (Shakeel and Hashmi, 2012). In general, the proportion of area under pulses to total cropped area has decline by 12.57 per cent (i.e., from 19.85 to 7.28 per cent) and with respect to production, it has also experienced a decline by 6.52 per cent (i.e., from 7.92 to 1.40 per cent) in Eastern Uttar Pradesh from 1950-53 to 2006-09. The area and production under pulses was 1314.96 thousand hectares and 90.24 lakh quintals in 1950-53, the area and production both declined to 601.07 thousand hectares and 51.82 lakh quintals in 2006-09 respectively. The minimum support price for pulses was always lower than the prevailing market price. The Government of India during 1999 set up an Expert Committee on Pulses, which suggested that a substantial hike in minimum support price for pulses will make the crop more attractive saving high risk involved in production. The absolute figure shows that, inspite of increase in minimum support price of pulses from Rs 1000 per quintal in 1998-99 to Rs 2000 per quintal in 2008-09 along with high market price, the area and production with regard to pulse is low. The reason is that no big technological breakthrough has yet achieved in case of pulses and some of the modified varieties which have been developed are out of reach of the farmers of the study area. Pulses crops are more susceptible to diseases and pest and their yield per unit of land in comparison with that of fine cereals is also low. Thus, the farmers for the maximization of profit go for the cultivation of fine cereals.
Coarse Cereals
Small Millets
Millets are oldest food known to human. They are highly nutritious, non-glutinous, non-acid forming, easily digestive, rich in magnesium, potassium, phosphorus, requires no high cost inputs as by fine cereals and are grown in dry regions as rain-fed crops. The area under small millets in 1950-53 was 471.39 thousand hectares which declined to 11.15 thousand hectares in 2006-09. The proportion of area under small millets to total cropped area was 7.11 per cent in 1950-53 which decreased to only a meagre of 0.13 per cent in 2006-09, experiencing a negative change of 6.98 per cent. With the development of irrigation facilities the area under small millets has reduced and other high yielding crops has taken over the area under the millets, especially in northern plain states (Mohammad, 1989. p-164). Secondly, the major threat which small millets are facing now is with that of maize, which is getting an unnatural promotion. Maize is encroaching into the areas previously devoted to small millets because of their corporate induced demand for bio-fuels and poultry feed. In regard with production, which was 21.87 lakh quintals in 1950-53 declined to 0.70 lakh quintals in 2006-09. The proportion of production of small millets to total agricultural production, experienced a decline by 1.90 per cent (i.e., from 1.92 to 0.02 per cent) (Table. 1). Since majority of the farmers in Eastern Uttar Pradesh is small and marginal and due to some socio-economic constraints they are unable to adopt improved varieties of seeds and improved crop management practices. Till recently, research on crop improvement and agro-techniques was neglected. There is no organised programme for production and supply of seeds of improved varieties. There is no ready market for the disposal of surplus produce at remunerative price. There is lack of extension and development support. Keeping in view, the importance of small millets and nutri-cereals, the Government of India has announced an allocation of Rs 300 Crore in 2011-12 under Rashtriya Krishi Vikas Yojana. This scheme aims to demonstrate the farmers about improved production and post-harvest technologies in an integral manner.
Commercial Crops
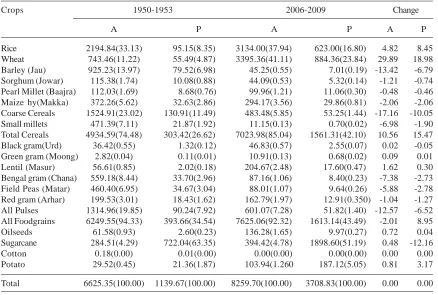
Table 1: Changes in Cropping Pattern in Eastern Uttar Pradesh
Crops 1950-1953 2006-2009 Change
A P A P A P
Rice 2194.84(33.13) 95.15(8.35) 3134.00(37.94) 623.00(16.80) 4.82 8.45
Wheat 743.46(11.22) 55.49(4.87) 3395.36(41.11) 884.36(23.84) 29.89 18.98
Barley (Jau) 925.23(13.97) 79.52(6.98) 45.25(0.55) 7.01(0.19) -13.42 -6.79 Sorghum (Jowar) 115.38(1.74) 10.08(0.88) 44.09(0.53) 5.32(0.14) -1.21 -0.74 Pearl Millet (Baajra) 112.03(1.69) 8.68(0.76) 99.96(1.21) 11.06(0.30) -0.48 -0.46 Maize hy(Makka) 372.26(5.62) 32.63(2.86) 294.17(3.56) 29.86(0.81) -2.06 -2.06 Coarse Cereals 1524.91(23.02) 130.91(11.49) 483.48(5.85) 53.25(1.44) -17.16 -10.05 Small millets 471.39(7.11) 21.87(1.92) 11.15(0.13) 0.70(0.02) -6.98 -1.90 Total Cereals 4934.59(74.48) 303.42(26.62) 7023.98(85.04) 1561.31(42.10) 10.56 15.47
Black gram(Urd) 36.42(0.55) 1.32(0.12) 46.83(0.57) 2.55(0.07) 0.02 -0.05
Green gram (Moong) 2.82(0.04) 0.11(0.01) 10.91(0.13) 0.68(0.02) 0.09 0.01
Lentil (Masur) 56.61(0.85) 2.02(0.18) 204.67(2.48) 17.60(0.47) 1.62 0.30
Bengal gram (Chana) 559.18(8.44) 33.70(2.96) 87.16(1.06) 8.40(0.23) -7.38 -2.73 Field Peas (Matar) 460.40(6.95) 34.67(3.04) 88.01(1.07) 9.64(0.26) -5.88 -2.78 Red gram (Arhar) 199.53(3.01) 18.43(1.62) 162.79(1.97) 12.91(0.350) -1.04 -1.27 All Pulses 1314.96(19.85) 90.24(7.92) 601.07(7.28) 51.82(1.40) -12.57 -6.52 All Foodgrains 6249.55(94.33) 393.66(34.54) 7625.06(92.32) 1613.14(43.49) -2.01 8.95
Oilseeds 61.58(0.93) 2.60(0.23) 136.28(1.65) 9.97(0.27) 0.72 0.04
Sugarcane 284.51(4.29) 722.04(63.35) 394.42(4.78) 1898.60(51.19) 0.48 -12.16
Cotton 0.18(0.00) 0.01(0.00) 0.00(0.00) 0.00(0.00) 0.00 0.00
Potato 29.52(0.45) 21.36(1.87) 103.94(1.260 187.12(5.05) 0.81 3.17
Total 6625.35(100.00) 1139.67(100.00) 8259.70(100.00) 3708.83(100.00) 0.00 0.00
Source: Directorate, Ministry of Agriculture, Department of Statistics and Economics, Lucknow, Uttar Pradesh, India. A – Area in ‘000’ hectares and P – Production in lakh quintals.
Note: Figures in brackets are percentages to total cropped area and total agricultural production.
Oilseeds
hectares which increased to 152.11 thousand hectares in 1999-02. Later, during 2006-09 the area allocated to oilseeds decreased to 136.28 thousand hectares. The share of area under oilseeds to total foodgrains in 1979-82 was 1.54 per cent, which experienced a slight increase up to 1.76 per cent in 2006-09. The expansion of the area under oilseeds was at the cost of coarse cereals and pulses and even rice and wheat in certain areas but the fact remained that the farmers found oilseeds cultivation less attractive as shown from there share in the total cropped area. Inspite the decrease in area during last few years, the production of oilseeds has increased because some of the oilseeds like rapeseed and mustard seed are mostly grown as a mixed crop with wheat and they are able to benefit from the residual effect of inputs applied to the main crop.
Horticulture (Potato, Onion)
The present share of Uttar Pradesh in total horticulture production of the country is approximately 26 per cent. Uttar Pradesh ranks third in fruits, second in vegetables and first in potato. Due to unavailability of data, the changes in cropping pattern with respect to horticulture has been examined by taking only two crops i.e., potato and onion. In 1950-53 potato occupied only 0.45 per cent of the total cropped area in Eastern Uttar Pradesh and later during 2006-09 it showed an increase by 0.81 per cent. Though, increase in the proportion of share of area to total cropped area is low but increase in the proportion of share of production to total crop produced is 3.17 per cent during 1950-53 to 2006-09. The area and production under potato has increased from 29.52 thousand hectares and 21.36 lakh quintals to 111.82 thousand hectares and 213.59 lakh quintals respectively, during 1950-53 to 1999-02. Because of its profitability and net return from per unit of land, increasing demand in national and international market and its use in various processed food leads to increase in area and production of potato in Eastern Uttar Pradesh. Later the area and production has declined to 103.94 thousand hectares and 187.12 lakh quintals respectively, in 2006-09.
With regard to onion, the scenario is more or less the same as potato. Though productivity has increased (14360 to 15068 kg per hectare) but area and production both has experienced a meagre decline form 10.37 thousand hectares and 14.90 lakh quintals to 9.58 thousand hectares and 14.44 lakh quintals, respectively during 1992-93 to 2006-07. Firstly, the non-availability of storage and high yielding quality seeds in combination with its susceptibility to pest and diseases, lack of post harvest facilities and policy support from the government has contributed to slow increase in area and production of potato and onion. Secondly, during the period from 1999-02 to 2006-09 the area and production under onion and potato has declined because Eastern Uttar Pradesh is characterised by frequent droughts and floods and due to abrupt weather conditions and uncertain rain in producing region during tuber formation affects the production.
Conclusion
adapted high yielding varieties of different growth period provided an opening for fine cereals (wheat and rice) under various crop sequences, rapid farm mechanization, and power for irrigation, greater access to fertilizers, pesticides and credit on easy terms provided the required motivation for a rapid change in cropping pattern. More importantly, the economic liberalization policies as well as globalization process are also exerting strong pressures on the area allocation decision of farmers, essentially through their impact on the relative price of inputs and outputs. Farmers, because of maximization of profit are easily lured by these policies and market forces. But higher prices of the crops do not always result in higher production and bringing larger area under the crop. Pulses though have high market and procurement price but there area and production is on decline because of low productivity the economic return from per unit of land is low and this crop is also highly susceptible to pest and diseases. The growth in area, production and yield of rice with respect to wheat, seems to be slower because very little progress have been made on technological development for rain-fed rice cultivation which constitutes nearly 60-70 per cent of rice area in Uttar Pradesh. The area under fine cereals (wheat and rice) has increased through out the study period on the cost of pulses, coarse cereals and small millets. The reason behind this shift was technological support, price support, infra-structural support, including market and irrigation, subsistence requirements and lesser price and yield risk. Small millets are facing annihilation and if they are not looked properly they will get extinct. Thus, by increasing the consumption of small millets we will be encouraging farmers in dry land areas to grow crops that are best suited for those regions. Emerging distortion in the cropping pattern can no longer be ignored and a rational price structure has to be developed for both input as well as output in order to bring about a desired change in cropping pattern. Policies and programmes should concentrate on increasing the production of pulses, coarse cereals and oilseeds by introducing high yielding varieties of seeds and by increasing the area under cultivation to include non-traditional areas.
References
Bansil, P.C. 1998. “Oilseeds Scenario some Issues”. Economic and Political Weekly, 32(52): A191-A200.
Bhall, G.S. and Tyagi, D.S. 1989. “Spatial Pattern of Agricultural Development in India”. Economic and Political Weekly 24(25): A46-A56.
Bhalla, G.S. and Alagh, Y.K. 1979. Performance of Indian Agriculture-A District wise Study. New Delhi: Sterling Publishers Private Limited.
Bhat, M.M. and Shah, A.R. 2011. “Recent changes in cropping patterns and its impact on output of foodgrains and non-foodgrains in Uzbekistan”, Research Journal of Agricultural Sciences 2(2): 384-387.
Chakravarti, A.K. 1973. “Green Revolution in India”, Annals of the Association of American Geographers 63(3): 319-330.
Dantwala, M.L. 1986. “Prices and cropping pattern”. Economic and Political Weekly 21(16): 694-695.
Gulati, A and Kelly, T.G. 1999. Trade Liberalization and Indian Agriculture: Cropping Pattern Changes and Efficiency Gains in Semi-arid tropics. New Delhi: Oxford University Press.
Hashmi, S.N.I. and Shakeel, A. 2012. “Imbalances in Foodgrains Production in Central Uttar Pradesh, India: Causes, Effects and Possible Solution”. Caspian Journal of Applied Sciences Research 1(9): 92-101.
Hazra, C.R. 2013. “Crop diversification in India”. Retrieved from www.fao.org/docrep/003/x6906e/x6906e06.htm. Accessd on 4/4/2013.
Johl, S.S. and Sidhu, R.S. 1988. “Developing crops zone in India-A production optimization approach. Agricultural situation in India 43(5): 369-389.
Kumar, B.L. 1978. “Declining trend in production of pulses and factors affecting it”. Economic and Political Weekly 13(27): 1112-1114.
Mian, N.I. and Khan, M.A. 1981. “A study of cropping pattern in Peshawar District”. The Institute of Economic Studies, University of Peshawar, NWFP. Publication No. 17.
Mohammad, A. 1985. Some aspect of food security and agricultural development in West Asia, Centre for West Asian Studies, Aligarh Muslim University, Aligarh.
Mohammad, A. 1989. Food production and food problem in India, New Delhi: Concept Publishing Company. Mohammad, A. 1995. “Problem of food availability and food security in the middle east”. The Geographer 42(2): 59-70. Nagarajan, S. 2000. “Wheat production in India-A success story and future strategies”. Indian Farming 50(6): 9-17. Nagarajan, S. 2005. “Can India produce enough Wheat by 2020?” Current Science 89(9): 1467-1471.
Narain, D. 1977. “Growth of productivity in Indian agriculture”, Indian journal of agricultural economics 32(1): 1-44. Pathak, M.D. 1991. Rice production in Uttar Pradesh: Progress and suggestions for improvement, Wiley Eastern
Limited. New Delhi.
Reddy, A.A. 2009. “Pulses Production Technology: Status and Way Forward”. Economic and Political Weekly 44(52): 73-80.
Shafi, M. 2006. Agricultural geography, New Delhi: Dorling Kindersley, India, Pvt. Ltd.
Shakeel, A and Hashmi, S.N.I. 2012. “Changing Spatial Pattern Trend and Regional Imbalances in Pulse Production in Eastern Uttar Pradesh-India”. Journal of Agricultural Extension and Rural Development 4(7): 129-140. Singh, N.P., Singh, P. and Singh, R.P. 2007. “Sugar Industry in Uttar Pradesh-Efficiency Still Holds the Key”, Agricultural