Functioning of 7-Year-Old Children Born at 32 to 35
Weeks
’
Gestational Age
WHAT’S KNOWN ON THIS SUBJECT: Approximately 80% of all preterm children are born moderately preterm (32–36 weeks’ gestation). Moderately preterm children are at increased risk for developmental delays, but the specific neuropsychological functions that may underlie these delays are unknown.
WHAT THIS STUDY ADDS: Moderately preterm birth is associated with poorer performance in intelligence, attention, visuospatial reasoning, and executive functioning. Using gender-specific norms, our data suggest that preterm boys catch up, whereas preterm girls lag behind their peers at 7 years of age.
abstract
OBJECTIVE: To compare neuropsychological functions in moderately preterm (32–35 weeks’ gestation) and full-term children at the age of 7 years and identify gender differences.
METHODS: Community-based prospective cohort study of 248 moderately preterm children (138 boys) and 130 full-term children (58 boys). Neuropsychological tests included IQ, memory, attention, visual perception, motor skills, visuomotor skills, and parental report of executive functioning.
RESULTS: The moderately preterm group performed significantly worse on total and performance IQ, visuospatial reasoning, attention control, inhibition, and executive functioning. No differences were found in verbal IQ, verbal memory, and visuomotor and motor skills. Preterm children were at higher risk for scores,10th percentile on intelligence, visuospatial reasoning (relative risk ratio both: 1.69 [95% confidence interval: 1.29–2.28]), and executive functioning problems (relative risk: 1.94 [95% confidence interval: 1.51–2.57]). Using gender-specific norms, preterm boys performed significantly worse than full-term boys on visuospatial reasoning (P , .01); preterm girls performed significantly worse than full-term girls on visuospatial reasoning, intelligence, attention, and executive functioning (P,.05).
CONCLUSIONS:Moderately preterm birth is associated with lower in-telligence and poorer neuropsychological functioning at early school age. No differences in motor skills and verbal memory were found. Using gender-specific norms, our data suggest that moderately preterm boys catch up, whereas moderately preterm girls lag behind their peers on various neuropsychological functions by the age of 7 years.Pediatrics2012;130:e838–e846
AUTHORS:Renata Cserjesi, PhD,aKoenraad N.J.A. Van
Braeckel, PhD,bPhillipa R. Butcher, PhD,cJorien M.
Kerstjens, MD,bSijmen A. Reijneveld, MD, PhD,dAnke
Bouma, PhD,aReint H. Geuze, PhD,aand Arend F. Bos, MD,
PhDb
aDepartment of Clinical and Developmental Neuropsychology, bDivision of Neonatology, Beatrix Children’s Hospital, and dDepartment of Health Sciences, University Medical Center
Groningen, University of Groningen, Groningen, Netherlands; andcDepartment of Psychology, The Australian National
University, Canberra, Australia
KEY WORDS
neurodevelopment, cognition, motor skill, moderately preterm, gender, school age
ABBREVIATIONS
ANOVA—analysis of variance
BRIEF—Behavior Rating Inventory of Executive Functions, Dutch version
CI—confidence interval GA—gestational age
Lollipop—Longitudinal Preterm Outcome Project PIQ—performance IQ
RR—relative risk TIQ—total IQ
UMCG—University Medical Center of Groningen VIQ—verbal IQ
This trial has been registered with the ISRCTN Register (http:// isrctn.org) (identifier ISRCTN80622320).
www.pediatrics.org/cgi/doi/10.1542/peds.2011-2079
doi:10.1542/peds.2011-2079
Accepted for publication May 31, 2012
Address correspondence to Renáta Cserjési, PhD, Department of Clinical and Developmental Neuropsychology, University of Groningen, Grote Kruisstraat 2, 9712 TS Groningen, Netherlands. E-mail: [email protected]
PEDIATRICS (ISSN Numbers: Print, 0031-4005; Online, 1098-4275).
Copyright © 2012 by the American Academy of Pediatrics
FINANCIAL DISCLOSURE:The authors have indicated they have nofinancial relationships relevant to this article to disclose.
Moderately preterm infants born at
$32 weeks’gestational age (GA)1
cur-rently make up over 80% of all preterm births in developed countries.2
Ap-proximately 7% of all births in Europe (6.3% in the Dutch population) and 10% in the United States are moderately preterm, and the incidence is rising.3,4
Although moderately preterm infants seem to be almost fully developed, studies reveal a greater risk for mor-tality and morbidity than full-terms associated with immaturity-related complications.5The increased risk for
medical complications has fueled con-cern about the long-term outcome af-ter moderately preaf-term birth.6 In
infants born very preterm (GA ,32 weeks), neurologic and physiologic immaturity has been associated with clear deficits in a number of key neu-rodevelopmental areas in childhood.7,8
These deficits have been associated with poorer school performance.9
Al-though more mature than infants born very preterm, moderately preterm-born infants are considerably less mature than infants born at full-term.
The brain almost doubles in size in the 8 weeks before full-term age as differ-entiation proceeds throughout the cortex and myelination of central brain regions continues.10This may increase
the risk for disruptions of brain growth
and development in preterm-born
infants. Evidence has been accumulat-ing that behavioral problems,11
neuro-developmental delays or deficits,6,12–16
and learning difficulties17,18 occur
more frequently in children born be-tween 32 and 36 weeks’ GA. Neuro-psychological outcome at preschool age has been investigated in 3 cohorts of moderately preterm-born children born in the last 10 years.12,13,15
In-formation on outcome at school age in children born in this period is, how-ever, missing. Furthermore, most pre-vious studies used global measures of cognition or school outcome with the
result that little is known about the specific neuropsychological deficits that may underlie the global deficits and school performance that have been identified. Because learning is a school-aged child’s primary task, we assessed both global intelligence and a range of specific neuropsychological functions in the domains of memory, attention, executive functioning, visuo-spatial reasoning, and motor skills, which can be considered to be central to effective learning in class.19
Finally, although male gender is con-sidered a risk factor in very preterm children,20 only Romeo et al12 have
addressed the issue of gender differ-ences in outcomes in children born moderately preterm. They found that girls performed better than boys at 12 to 18 months of age, suggesting that male gender is also a risk factor in moderately preterm-born children.12
Our aim was to compare moderately preterm-born children with full-term born peers at early school age on neuro-psychological and motor outcomes, with particular attention to gender differences.
METHODS
Subjects, Study Design, Sampling Procedure, and Sampling Criteria
The Longitudinal Preterm Outcome Project (Lollipop) is a large, prospective follow-up study on growth, development, and general health in preterm-born children. From a community-based cohort of 45 446 children born in 2002 and 2003 in the Netherlands, 1843 preterm (,36 weeks) and 674 full-term children (38–41+6 weeks) were included. Children were recruited from 1 of 13 Dutch preventive child health care centers. GA was calculated from the date of last menstruation, and confirmed in the majority of cases by early ultrasound measurements. Exclusion criteria were major congen-ital malformations, congencongen-ital infec-tions, or syndromes. After each second
preterm child was identified, the next full-term born child who did not meet the exclusion criteria was drawn from the samefiles as a control. Full-term children were thus from the same preventive child health care centers and in the same age range as the preterm children. Sampling proce-dures, inclusion and exclusion criteria, study conduct, participants and non-participants in the Lollipop study have been described in detail elsewhere.13,21
For the current study, we selected all moderately preterm-born children (32– 35+6 GA) and full-term controls (38– 41+6GA) from the Lollipop cohort who were currently living in the 3 northern provinces of the Netherlands. This in-cluded 341 children born moderately
preterm and 195 full-term,
age-matched controls. In total, 248 chil-dren born moderately preterm (138 boys; 110 girls; median GA: 34 weeks in both groups) and 130 full-terms (58 boys; 72 girls; median GA: 40 weeks in both groups) agreed to participate in this study, a response rate of 73% for children born moderately preterm and 67% for controls. Mean age was 6.9 years (range, 6.4–7.3).
Medical data were extracted from hospital charts. Demographic and perinatal data are presented in Table 1. All children had normal or corrected to normal vision. The study was approved by the Ethical Review Board of the University Medical Center of Groningen (UMCG). Examinations were performed in accordance with the institutional (UMCG) and international (Declaration in Helsinki, 1964, European Union Council Directive 86/609/EEC) ethical standards, including written informed consent.
Measures and Procedure
The children and their parents were invited to visit the UMCG or a well-infant clinic in their neighborhood for a 3-hour assessment comprising a number of standardized neuropsychological tests and questionnaires. Each child was tested individually by a trained psy-chologist who was blind to group as-signment while parents completed the questionnaires in the waiting room.
We used a short version of the Wechsler Intelligence Scale, Third Edition, Dutch Version22 consisting of 2 verbal
subt-ests and 2 performance subtsubt-ests to estimate total IQ (TIQ), verbal IQ (VIQ),
and performance IQ (PIQ). We assessed verbal memory by using the Dutch version of the Rey Auditory Verbal Learning Test.23 We used the design
copying subtest of the Developmental Neuropsychological Assessment bat-tery24 to assess visuomotor
function-ing. We assessed the attentional skills that are required for effective func-tioning at school, using 3 subtests from the Test of Everyday Attention for Children, Dutch version25: Map
Mission, Score!, and Same world/ Opposite world. To measure motor skills required in everyday life, we used the Dutch version of the Move-ment AssessMove-ment Battery for Chil-dren.26Behavior regulation and
meta-cognitive functioning, key aspects of executive functioning, were assessed by using the parent’s form of the Be-havior Rating Inventory of Executive Functions, Dutch version (BRIEF).27 A
more detailed description of each component of the assessment is pro-vided in Table 2.
Statistical Analysis x2
tests and t tests were used to as-sess differences between the groups in
demographic characteristics. Because the main outcome measures were normally distributed, we used analysis of variance (ANOVA) on all total scores in a 2 3 2 design (preterm versus term; boy versus girl) to detect differ-ences between the groups in neuro-developmental outcomes. We repeated the analyses adjusting for parental educational level.
Then, to minimize the impact of the gender differences that are often present in typically developing children, gender-specific z scores were com-puted for each neuropsychological do-main for boys and girls separately. The zscores were based on the data of the full-term control groups. ANOVAs were conducted on the gender-specific z scores to investigate differences be-tween preterm and full-term boys, and preterm and full-term girls.
Finally, the prevalence of clinical scores in the different neurodevelopmental domains in the preterm group was in-vestigated. The 10th percentile, defined as a z score below 21.28, was the cutoff.28The relative risk (RR) then is
defined as the ratio of the percentages of preterm and of term children with azscore below the 10th percentile.
RESULTS
Cognitive and Motor Outcomes in the Preterm and Control Groups
The mean scores are presented in Table 3. The moderately preterm group per-formed more poorly than the full-term group on every measure. The differ-ences reached statistical significance for TIQ, PIQ, visuospatial reasoning, at-tention control, and inhibition. On the BRIEF, preterm children’s parents re-ported significantly more difficulty on global executive functioning and the behavioral regulation index but not on the meta-cognition index.
Repeating the analyses with adjustment for parental education level revealed slight increases in most Pvalues but
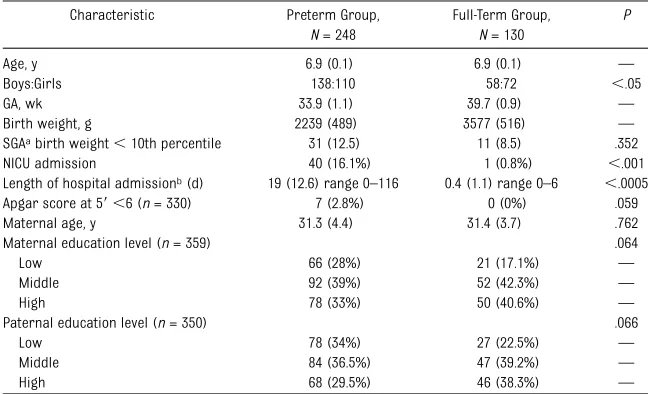
TABLE 1 Demographic and Perinatal Characteristics of the Moderately Preterm and Full-Term Groups
Characteristic Preterm Group,
N= 248
Full-Term Group,
N= 130
P
Age, y 6.9 (0.1) 6.9 (0.1) —
Boys:Girls 138:110 58:72 ,.05
GA, wk 33.9 (1.1) 39.7 (0.9) —
Birth weight, g 2239 (489) 3577 (516) —
SGAabirth weight,10th percentile 31 (12.5) 11 (8.5) .352
NICU admission 40 (16.1%) 1 (0.8%) ,.001
Length of hospital admissionb(d) 19 (12.6) range 0–116 0.4 (1.1) range 0–6 ,.0005
Apgar score at 59,6 (n= 330) 7 (2.8%) 0 (0%) .059
Maternal age, y 31.3 (4.4) 31.4 (3.7) .762
Maternal education level (n= 359) .064
Low 66 (28%) 21 (17.1%) —
Middle 92 (39%) 52 (42.3%) —
High 78 (33%) 50 (40.6%) —
Paternal education level (n= 350) .066
Low 78 (34%) 27 (22.5%) —
Middle 84 (36.5%) 47 (39.2%) —
High 68 (29.5%) 46 (38.3%) —
Data are mean (SD) or number or range or percentages (%).Pvalues of thettest andx2test. aSGA, small for GA frequency.
did not affect the statistical signifi -cance (P,.05) regarding any outcome (Table 3).
Gender Differences
Regarding demographic and perinatal characteristics, no differences existed between boys and girls. Only the num-bers of preterm children born small for GA were higher for boys (n= 21) than for girls (n = 8; P = .047). Girls per-formed significantly better than boys in the areas of verbal memory, visuomo-tor skills, sustained attention, attention control, and 2 aspects of motor skill: manual dexterity and posture control (Table 4). They also performed better on executive functioning, but the difference failed to reach statistical
significance. Boys performed better than girls on visuospatial reasoning, but this difference also did not reach sta-tistical significance. None of the inter-actions between gender and group was statistically significant.
Adjustment for parental education level hardly affected the P values of the gender differences and did not affect the statistical significance (P,.05) of any gender difference (Table 4).
Gender-Specific zScores
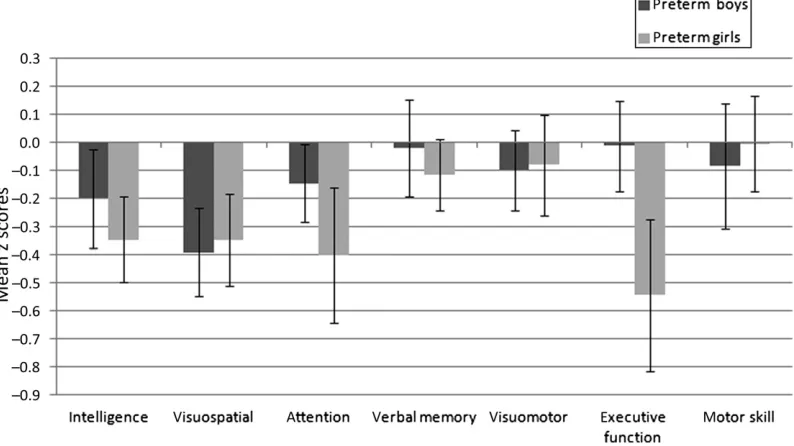
Significant differences between pre-term and full-pre-term children were more frequent in girls than boys (Fig 1). Z score profiles of the preterm group revealed that preterm boys performed significantly more poorly than full-term
boys on only 1 test, visuospatial rea-soning (F1,195 = 9.82, P = .002, h2 =
0.048). Preterm girls performed sig-nificantly more poorly than full-term girls on visuospatial reasoning (F1,181=
11.35,P= .001,h2= 0.059), intelligence (F1,181 = 13.12,P, .001, h
2
= 0.068), attention (F1,181= 7.14,P= .008,h
2
= 0.038), and executive functioning (F1,181
= 9.82,P= .002,h2= 0.052). We found a significant group 3 gender effect for executive functioning (F1,375= 10.67, P = .001, h2 = 0.028): preterm girls performed more poorly than full-term girls on executive functioning than preterm boys compared with full-term boys.
Relative Risk
Moderately preterm-born children were at higher risk for clinically sig-nificant poor (,10th percentile) scores on measures of intelligence, visuospa-tial reasoning (both RR ratios: 1.69 [95% confidence interval (CI): 1.29– 2.28]) and executive functioning (RR: 1.94 [95% CI: 1.51–2.57]).
DISCUSSION
In a detailed investigation of outcomes in a broad range of neuropsychological domains, we found that a moderately preterm group of 7-year-olds scored worse on tests of TIQ, PIQ, visuospatial reasoning, attention, and executive functioning than full-term controls. Af-ter adjustment for parental education level, the differences were largest for visuospatial reasoning and executive functioning, up to one-third SD lower, which might not be clinically significant but could be important if magnified to a whole population. The RR of impair-ment for the moderately preterm chil-dren was 1.69 for intelligence and visuospatial reasoning and 1.94 for executive functioning. On tests of VIQ, verbal memory, and visuomotor and motor skills, no differences were found between the groups.
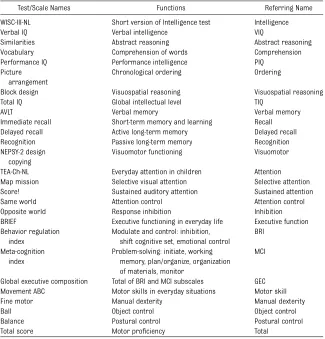
TABLE 2 Measurements, Related Cognitive and Motor Functions, and Referring Names in the Text
Test/Scale Names Functions Referring Name
WISC-III-NL Short version of Intelligence test Intelligence
Verbal IQ Verbal intelligence VIQ
Similarities Abstract reasoning Abstract reasoning
Vocabulary Comprehension of words Comprehension
Performance IQ Performance intelligence PIQ
Picture arrangement
Chronological ordering Ordering
Block design Visuospatial reasoning Visuospatial reasoning
Total IQ Global intellectual level TIQ
AVLT Verbal memory Verbal memory
Immediate recall Short-term memory and learning Recall Delayed recall Active long-term memory Delayed recall
Recognition Passive long-term memory Recognition
NEPSY-2 design copying
Visuomotor functioning Visuomotor
TEA-Ch-NL Everyday attention in children Attention Map mission Selective visual attention Selective attention Score! Sustained auditory attention Sustained attention
Same world Attention control Attention control
Opposite world Response inhibition Inhibition
BRIEF Executive functioning in everyday life Executive function Behavior regulation
index
Modulate and control: inhibition, shift cognitive set, emotional control
BRI
Meta-cognition index
Problem-solving: initiate, working memory, plan/organize, organization of materials, monitor
MCI
Global executive composition Total of BRI and MCI subscales GEC Movement ABC Motor skills in everyday situations Motor skill
Fine motor Manual dexterity Manual dexterity
Ball Object control Object control
Balance Postural control Postural control
Total score Motor proficiency Total
When using raw scores, there were no gender differences in the differences between moderately preterm and term children (ie, no statistically significant gender3GA interaction). Moderately preterm boys and girls performed equally poorer than their full-term counterparts for all outcomes. This is consistent with previous studies.12,29
However, when using gender-specific norms, preterm boys performed poorer than full-term boys only on the test of visuospatial reasoning, whereas preterm girls performed significantly worse on tests of visuospatial reason-ing, intelligence, aspects of attention, and executive functioning than full-term girls.
We identified differences in both global and specific neuropsychological func-tions. First, consistent with previous
studies,6,12,15 we found small but
sig-nificant differences between moder-ately preterm and full-term children in global intelligence. In very preterm children without serious neurologic complications, the severity of impair-ments is associated with declining GA.29 In a study of 7- to 9-year-old
moderately preterm children, van Baar et al6 found scores within the
normal range, but on average 3 IQ points lower than full-term controls. In our study, although their scores were in the normal range, the preterm chil-dren as a group scored 2.7 IQ points lower than full-term age-mates. Un-expectedly, the difference in TIQ scores between preterm and full-term chil-dren was greater for girls than for boys: 4 vs 2 points. Male gender is considered a risk factor in very
preterm children.9,12,20 Romeo et al12
found that girls performed better than boys on the mental developmental in-dex at 12 to 18 months, suggesting that male gender is also a risk factor in late preterm (between 34 and 36+6 GA) preschool children. However, at early school age, we found no difference between girls’and boys’performances in the moderately preterm group for TIQ. Further, intelligence scores were significantly lower in the preterm girls than in the full-term girls, whereas they did not differ between preterm and full-term boys. The absence of the advan-tage of the preterm girls over preterm boys at school age, and the differences between their performance and that of the full-term girls suggest that the moderately preterm boys catch up and/ or the moderately preterm girls lose some of their advantage on measures of global intelligence, falling behind full-term girls by early school age.
Second, we found that the moderately preterm group performed consider-ably more poorly on PIQ and visuo-spatial reasoning. The block design subtest assessing visuospatial rea-soning is a multidetermined subtest, because its score depends on various functions including visuospatial rea-soning andfine motor control. As noted above, motor and visuomotor scores did not differ between the 2 groups, indicating that the basis for the dif-ference was poorer visuospatial rea-soning rather than poorer motor skills. Given Baron et al’s15finding of poorer
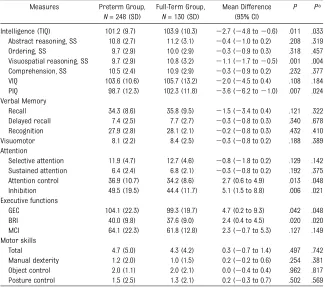
visuospatial reasoning in a group of preschoolers born between 34 and 36 weeks’GA, and ourfinding of a similar deficit in 7-year-olds born between 32 and 36 weeks’ GA, we suggest that poorer visuospatial reasoning persists at least until early school age. Visuo-spatial reasoning is an indicator of nonverbal abilities, and many preterm children display nonverbal learning disabilities.29The effects of this type of TABLE 3 Cognitive and Motor Results in the Moderately Preterm and Full-Term Groups, Mean
Differences, and Statistical Significances of Group Differences Before and After Adjustment for Parental Education
Measures Preterm Group,
N= 248 (SD)
Full-Term Group,
N= 130 (SD)
Mean Difference (95% CI)
P Pa
Intelligence (TIQ) 101.2 (9.7) 103.9 (10.3) 22.7 (24.8 to20.6) .011 .033 Abstract reasoning, SS 10.8 (2.7) 11.2 (3.1) 20.4 (21.0 to 0.2) .208 .319 Ordering, SS 9.7 (2.9) 10.0 (2.9) 20.3 (20.9 to 0.3) .318 .457 Visuospatial reasoning, SS 9.7 (2.9) 10.8 (3.2) 21.1 (21.7 to20.5) .001 .004 Comprehension, SS 10.5 (2.4) 10.9 (2.9) 20.3 (20.9 to 0.2) .232 .377 VIQ 103.6 (10.6) 105.7 (13.2) 22.0 (24.5 to 0.4) .108 .184 PIQ 98.7 (12.3) 102.3 (11.8) 23.6 (26.2 to21.0) .007 .024 Verbal Memory
Recall 34.3 (8.6) 35.8 (9.5) 21.5 (23.4 to 0.4) .121 .322 Delayed recall 7.4 (2.5) 7.7 (2.7) 20.3 (20.8 to 0.3) .340 .678 Recognition 27.9 (2.8) 28.1 (2.1) 20.2 (20.8 to 0.3) .432 .410 Visuomotor 8.1 (2.2) 8.4 (2.5) 20.3 (20.8 to 0.2) .188 .389 Attention
Selective attention 11.9 (4.7) 12.7 (4.6) 20.8 (21.8 to 0.2) .129 .142 Sustained attention 6.4 (2.4) 6.8 (2.1) 20.3 (20.8 to 0.2) .192 .375 Attention control 36.9 (10.7) 34.2 (8.6) 2.7 (0.6 to 4.9) .013 .048 Inhibition 49.5 (19.5) 44.4 (11.7) 5.1 (1.5 to 8.8) .006 .021 Executive functions
GEC 104.1 (22.3) 99.3 (19.7) 4.7 (0.2 to 9.3) .042 .048
BRI 40.0 (9.8) 37.6 (9.0) 2.4 (0.4 to 4.5) .020 .020
MCI 64.1 (22.3) 61.8 (12.8) 2.3 (20.7 to 5.3) .127 .149 Motor skills
Total 4.7 (5.0) 4.3 (4.2) 0.3 (20.7 to 1.4) .497 .742 Manual dexterity 1.2 (2.0) 1.0 (1.5) 0.2 (20.2 to 0.6) .254 .381 Object control 2.0 (1.1) 2.0 (2.1) 0.0 (20.4 to 0.4) .962 .817 Posture control 1.5 (2.5) 1.3 (2.1) 0.2 (20.3 to 0.7) .502 .569
Data are mean (SD).Pvalues of the F tests in ANOVA. Higher scores represent better performance on the subtests, except for Attention control, Inhibition, all Executive functioning and all Motor skills, where higher scores indicate poorer performance. BRI, behavioral regulation index; GEC, global executive functioning; MCI, meta-cognition index; SS, standard score (mean = 10; SD = 3).
learning disorder, which is considered to be on a continuum with executive functioning and attention disorders, may hamper academic performance as well as social interactions.30
Our moderately preterm children also performed more poorly than their full-term peers on measures of attention control, inhibition, and executive func-tioning. Previous studies have revealed poorer executive functioning in chil-dren born moderately preterm at 4 years of age.15Visuospatial, attention,
and executive functioning problems have consistently been found in chil-dren born very preterm31–34and have
been associated with white and gray matter lesions.34,35 We speculate that
these lesions are also the basis of the deficits that we found in moderately preterm-born children.36
In typically developing children, girls tend to have a general developmental advantage over boys of the same age,37
particularly in the areas of attention and executive functions.37,38 In our
study, this was indeed the case in the control group but not in the preterm group, where differences in specific
domains were more pronounced
among girls. This suggests that mod-erately preterm girls have lost their developmental advantage and perform more poorly than full-term girls and at approximately the same level as mod-erately preterm boys. Afirst alternative explanation may be selection bias (ie, above average abilities in our full-term girls). However, this is unlikely because the full-term girls’ scores, although above the mean for their age, were not significantly higher than the Dutch normative scores. A second alternative explanation may be lower GA in the preterm girls because decreasing GA is associated with neuropsychological deficits.8However, this is also unlikely
because mean and median GA did not differ significantly between the pre-term boys and girls.
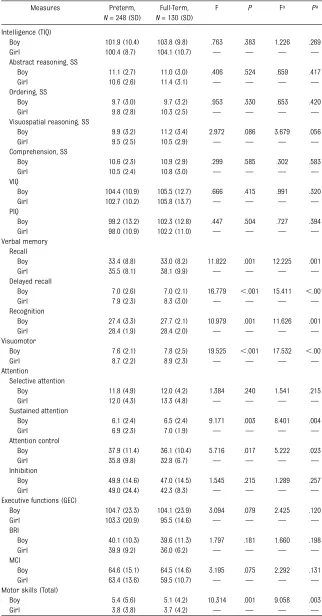
TABLE 4 Cognitive and Motor Results in the Moderately Preterm and Full-Term Groups by Gender, and Statistical Significance of Gender Difference After Adjustment for Gestational Age Category, and After Adjustment for Gestational Age Category and Parental Education
Measures Preterm,
N= 248 (SD)
Full-Term, N= 130 (SD)
F P Fa Pa
Intelligence (TIQ)
Boy 101.9 (10.4) 103.8 (9.8) .763 .383 1.226 .269
Girl 100.4 (8.7) 104.1 (10.7) — — — —
Abstract reasoning, SS
Boy 11.1 (2.7) 11.0 (3.0) .406 .524 .659 .417
Girl 10.6 (2.6) 11.4 (3.1) — — — —
Ordering, SS
Boy 9.7 (3.0) 9.7 (3.2) .953 .330 .653 .420
Girl 9.8 (2.8) 10.3 (2.5) — — — —
Visuospatial reasoning, SS
Boy 9.9 (3.2) 11.2 (3.4) 2.972 .086 3.679 .056
Girl 9.5 (2.5) 10.5 (2.9) — — — —
Comprehension, SS
Boy 10.6 (2.3) 10.9 (2.9) .299 .585 .302 .583
Girl 10.5 (2.4) 10.8 (3.0) — — — —
VIQ
Boy 104.4 (10.9) 105.5 (12.7) .666 .415 .991 .320
Girl 102.7 (10.2) 105.8 (13.7) — — — —
PIQ
Boy 99.2 (13.2) 102.3 (12.8) .447 .504 .727 .394
Girl 98.0 (10.9) 102.2 (11.0) — — — —
Verbal memory Recall
Boy 33.4 (8.8) 33.0 (8.2) 11.822 .001 12.225 .001
Girl 35.5 (8.1) 38.1 (9.9) — — — —
Delayed recall
Boy 7.0 (2.6) 7.0 (2.1) 16.779 ,.001 15.411 ,.001
Girl 7.9 (2.3) 8.3 (3.0) — — — —
Recognition
Boy 27.4 (3.3) 27.7 (2.1) 10.979 .001 11.626 .001
Girl 28.4 (1.9) 28.4 (2.0) — — — —
Visuomotor
Boy 7.6 (2.1) 7.8 (2.5) 19.525 ,.001 17.532 ,.001
Girl 8.7 (2.2) 8.9 (2.3) — — — —
Attention
Selective attention
Boy 11.8 (4.9) 12.0 (4.2) 1.384 .240 1.541 .215
Girl 12.0 (4.3) 13.3 (4.8) — — — —
Sustained attention
Boy 6.1 (2.4) 6.5 (2.4) 9.171 .003 8.401 .004
Girl 6.9 (2.3) 7.0 (1.9) — — — —
Attention control
Boy 37.9 (11.4) 36.1 (10.4) 5.716 .017 5.222 .023
Girl 35.8 (9.8) 32.8 (6.7) — — — —
Inhibition
Boy 49.9 (14.6) 47.0 (14.5) 1.545 .215 1.289 .257
Girl 49.0 (24.4) 42.3 (8.3) — — — —
Executive functions (GEC)
Boy 104.7 (23.3) 104.1 (23.9) 3.094 .079 2.425 .120
Girl 103.3 (20.9) 95.5 (14.6) — — — —
BRI
Boy 40.1 (10.3) 39.6 (11.3) 1.797 .181 1.660 .198
Girl 39.9 (9.2) 36.0 (6.2) — — — —
MCI
Boy 64.6 (15.1) 64.5 (14.6) 3.195 .075 2.292 .131
Girl 63.4 (13.6) 59.5 (10.7) — — — —
Motor skills (Total)
Boy 5.4 (5.6) 5.1 (4.2) 10.314 .001 9.058 .003
Adjustment for parental education level hardly affected the size of the differ-ences between the moderately preterm and term group. It also did not alter significance on any outcome regarding gender differences. Previous research has consistently revealed that parental socioeconomic status, in particular pa-rental education level, is positively asso-ciated with cognitive development.13,39,40
This was also the case in our cohort, but parental education level did not confound or mediate any association we found.
An important strength of this study is the direct assessment of a wide range of neuropsychological outcomes, using carefully selected, well-established mea-sures, in a large community-based sample of moderately preterm-born children. A limitation is the use of the BRIEF, a questionnaire measure rather than a direct test of executive functioning. However, we selected the BRIEF because the parents’report covers the child’s behavior in daily life evaluated over the previous 6 months. At 7 years of age, this is likely to be a more valid measure
than laboratory tasks carried out at a single moment in the child’s life.
The neuropsychological domains found to be affected in moderately preterm-born children matched those in very preterm-born children in all areas in-vestigated except visuomotor skills and verbal memory. This suggests that, al-though less vulnerable than very preterm-born children, moderately preterm-born children are more vul-nerable than full-term peers, and that the vulnerability of brain development to the disruptions that may accompany preterm birth persist between 32 and 36 weeks’GA, albeit at a reduced level. Although the differences in perform-ances between moderately preterm born and term-born children were only clinically relevant on measures of visuo-spatial reasoning and executive func-tioning, we believe that the consistently poorer performance of the moderately preterm-born group on all measures, which are called on by school learning, may disadvantage them compared with their full-term classmates.
Preterm birth is an increasing public health problem in developed countries.2,5,6 TABLE 4 Continued
Measures Preterm,
N= 248 (SD)
Full-Term, N= 130 (SD)
F P Fa Pa
Manual dexterity
Boy 1.7 (2.3) 1.3 (1.6) 20.299 ,.001 18.434 ,.001
Girl 0.7 (1.5) 0.7 (1.4) — — — —
Object control
Boy 2.0 (2.2) 1.9 (2.0) .069 .793 .00 .983
Girl 1.9 (1.8) 2.0 (2.2) — — — —
Posture control
Boy 1.8 (2.7) 1.7 (2.4) 8.064 .005 8.494 .004
Girl 1.1 (2.1) 1.0 (1.8) — — — —
Data are mean (SD). Higher scores represent better performance on the subtests, except for Attention control, Inhibition, all Executive functioning and all Motor skills, where higher scores indicate poorer performance. F andPvalues concern gender differences adjusted for (preterm or term) group, derived from F tests in ANOVA. BRI, behavioral regulation index; GEC, global executive functioning; MCI, meta-cognition index; SS, standard score (mean = 10; SD = 3).
aF andPvalues adjusted for parental education.
FIGURE 1
Therefore, clinicians and caretakers should be aware that moderately preterm birth significantly affects neuropsychological functioning of at least some of the children involved
and may lead to impaired perfor-mance at early school age. Moderately preterm girls seem to be more vul-nerable at this age. An important question that remains is what explains
the gender-differences in the effect of preterm birth on cognitive outcomes and what the underlying mecha-nisms leading to neurologic impair-ment may be.
REFERENCES
1. Stichting Perinatale Registratie Nederland. Perinatale Zorg in Nederland 2006. Utrecht, Netherlands: Stichting Perinatale Regis-tratie Nederland; 2008
2. Goldenberg RL, Culhane JF, Iams JD, Romero R. Epidemiology and causes of preterm birth. Lancet. 2008;371(9606):75–84
3. Martin JA, Hamilton BE, Sutton PD, Ventura SJ, Menacker F, Munson ML. Births:final data for 2003.Natl Vital Stat Rep. 2005;54 (2):1–116
4. Davidoff MJ, Dias T, Damus K, et al. Changes in the gestational age distribution among U.S. singleton births: impact on rates of late preterm birth, 1992 to 2002. Semin Perinatol. 2006;30(1):8–15
5. Kramer MS, Demissie K, Yang H, Platt RW, Sauvé R, Liston R; Fetal and Infant Health Study Group of the Canadian Perinatal Surveillance System. The contribution of mild and moderate preterm birth to infant mortality.JAMA. 2000;284(7):843–849
6. van Baar AL, Vermaas J, Knots E, de Kleine MJ, Soons P. Functioning at school age of moderately preterm children born at 32 to 36 weeks’gestational age.Pediatrics. 2009; 124(1):251–257
7. Aarnoudse-Moens CSH, Weisglas-Kuperus N, van Goudoever JB, Oosterlaan J. Meta-analysis of neurobehavioral outcomes in very preterm and/or very low birth weight children.Pediatrics. 2009;124(2):717–728
8. Bhutta AT, Cleves MA, Casey PH, Cradock MM, Anand KJ. Cognitive and behavioral outcomes of school-aged children who were born preterm: a meta-analysis.JAMA. 2002;288(6):728–737
9. Marlow N, Hennessy EM, Bracewell MA, Wolke D; EPICure Study Group. Motor and executive function at 6 years of age after extremely preterm birth.Pediatrics. 2007; 120(4):793–804
10. Kinney HC. The near-term (late preterm) human brain and risk for periventricular leukomalacia: a review. Semin Perinatol. 2006;30(2):81–88
11. Gray RF, Indurkhya A, McCormick MC. Prev-alence, stability, and predictors of clinically significant behavior problems in low birth weight children at 3, 5, and 8 years of age. Pediatrics. 2004;114(3):736–743
12. Romeo DM, Di Stefano A, Conversano M, et al. Neurodevelopmental outcome at 12 and 18 months in late preterm infants.Eur J Paediatr Neurol. 2010;14(6):503–507
13. Kerstjens JM, de Winter AF, Bocca-Tjeertes IF, ten Vergert EMJ, Reijneveld SA, Bos AF. Developmental delay in moderately preterm-born children at school entry. J Pediatr. 2011;159(1):92–98
14. Marret S, Ancel PY, Marpeau L, et al; Epipage Study Group. Neonatal and 5-year outcomes after birth at 30-34 weeks of gestation.Obstet Gynecol. 2007;110(1):72–80
15. Baron IS, Erickson K, Ahronovich MD, Cou-lehan K, Baker R, Litman FR. Visuospatial and verbal fluency relative deficits in
‘complicated’ late-preterm preschool chil-dren.Early Hum Dev. 2009;85(12):751–754
16. Woythaler MA, McCormick MC, Smith VC. Late preterm infants have worse 24-month neu-rodevelopmental outcomes than term infants. Pediatrics. 2011;127(3). Available at: www.pediatrics.org/cgi/content/full/127/ 3/e622
17. Chyi LJ, Lee HC, Hintz SR, Gould JB, Sutcliffe TL. School outcomes of late preterm infants: special needs and challenges for infants born at 32 to 36 weeks gestation. J Pediatr. 2008;153(1):25–31
18. Morse SB, Zheng H, Tang Y, Roth J. Early school-age outcomes of late preterm infants.Pediatrics. 2009;123(4). Available at: www.pediatrics.org/cgi/content/full/123/ 4/e622
19. Jacobson LA, Williford AP, Pianta RC. The role of executive function in children’s competent adjustment to middle school. Child Neuropsychol. 2011;17(3):255–280
20. Kapellou O, Counsell SJ, Kennea N, et al. Abnormal cortical development after pre-mature birth shown by altered allometric scaling of brain growth.PLoS Med. 2006;3 (8):e265
21. Kerstjens JM, Bos AF, ten Vergert EM, de Meer G, Butcher PR, Reijneveld SA. Support for the global feasibility of the Ages and Stages Questionnaire as developmental screener.Early Hum Dev. 2009;85(7):443–447
22. Kort W, Compaan EL, Bleichrodt N, et al. WISC-III NL Handleiding. Amsterdam: NIP Dienstencentrum; 2002
23. van den Burg W, Kingma A. Performance of 225 Dutch school children on Rey’s Auditory Verbal Learning Test (AVLT): parallel test-retest reliabilities with an interval of 3 months and normative data. Arch Clin Neuropsychol. 1999;14(6):545–559
24. Korkman M, Kirk U, Kemp S. NEPSY: A De-velopmental Neuropsychological Assessment. San Antonio, TX: Psychological Corporation; 1998
25. Manly T, Robertson IH, Anderson V, Nimmo-Smith I.TEA-Ch, Test of Everyday Attention for Children. The Netherlands: Handleiding. Harcourt Assessment; 2004
26. Smits-Engelsman BCM. Movement Assess-ment Battery for Children. Lisse, The Netherlands: Handbook, Swets & Zeitlinger Test Publishers; 1998
27. Smidts D, Huizinga M. BRIEF Executive Functies Gedragsvragenlijst. The Netherlands: Handleiding. Hogrefe Uitgrevers B.V. Amsterdam; 2009
28. Schoonenboom SNM, Visser PJ, Mulder C, et al. Biomarker profiles and their relation to clinical variables in mild cognitive im-pairment.Neurocase. 2005;11(1):8–13
29. Aylward GP. Cognitive and neuro-psychological outcomes: more than IQ scores. Ment Retard Dev Disabil Res Rev. 2002;8(4):234–240
30. Taylor HG, Klein N, Minich NM, Hack M. Middle-school-age outcomes in children with very low birthweight.Child Dev. 2000; 71(6):1495–1511
31. Davis DW, Burns BM, Wilkerson SA, Steichen JJ. Visual perceptual skills in children born with very low birth weights. J Pediatr Health Care. 2005;19(6):363–368
32. Atkinson J, Braddick O. Visual and visuo-cognitive development in children born very prematurely.Prog Brain Res. 2007;164: 123–149
33. Van Braeckel K, Butcher PR, Geuze RH, van Duijn MA, Bos AF, Bouma A. Less efficient elementary visuomotor processes in 7- to 10-year-old preterm-born children without cerebral palsy: an indication of impaired dorsal stream processes.Neuropsychology. 2008;22(6):755–764
dysfunctions in preterm children with periventricular leukomalacia. Dev Med Child Neurol. 2009;51(12):974–981
35. Nosarti C, Giouroukou E, Healy E, et al. Grey and white matter distribution in very preterm adolescents mediates neurodevelopmental outcome.Brain. 2008;131(pt 1):205–217
36. Billiards SS, Pierson CR, Haynes RL, Folkerth RD, Kinney HC, Kinney HC. Is the
late preterm infant more vulnerable to gray matter injury than the term infant? Clin Perinatol. 2006;33(4):915–933, abstract x–xi
37. Baron-Cohen S, Hammer J. Is autism an extreme form of the’male brain’?Adv In-fancy Res. 1997;11:193–217
38. Walker S, Irving K, Berthelsen D. Gender influences on preschool children’s social
problem-solving strategies. J Genet Psy-chol. 2002;163(2):197–209
39. Bradley RH, Corwyn RF. Socioeconomic status and child development. Annu Rev Psychol. 2002;53:371–399
DOI: 10.1542/peds.2011-2079 originally published online September 3, 2012;
2012;130;e838
Pediatrics
Kerstjens, Sijmen A. Reijneveld, Anke Bouma, Reint H. Geuze and Arend F. Bos
Services
Updated Information &
http://pediatrics.aappublications.org/content/130/4/e838
including high resolution figures, can be found at:
References
http://pediatrics.aappublications.org/content/130/4/e838#BIBL
This article cites 34 articles, 7 of which you can access for free at:
Subspecialty Collections
sub
http://www.aappublications.org/cgi/collection/fetus:newborn_infant_
Fetus/Newborn Infant
al_issues_sub
http://www.aappublications.org/cgi/collection/development:behavior
Developmental/Behavioral Pediatrics
following collection(s):
This article, along with others on similar topics, appears in the
Permissions & Licensing
http://www.aappublications.org/site/misc/Permissions.xhtml
in its entirety can be found online at:
Information about reproducing this article in parts (figures, tables) or
Reprints
http://www.aappublications.org/site/misc/reprints.xhtml
DOI: 10.1542/peds.2011-2079 originally published online September 3, 2012;
2012;130;e838
Pediatrics
Kerstjens, Sijmen A. Reijneveld, Anke Bouma, Reint H. Geuze and Arend F. Bos
Renata Cserjesi, Koenraad N.J.A. Van Braeckel, Phillipa R. Butcher, Jorien M.
Functioning of 7-Year-Old Children Born at 32 to 35 Weeks' Gestational Age
http://pediatrics.aappublications.org/content/130/4/e838
located on the World Wide Web at:
The online version of this article, along with updated information and services, is
by the American Academy of Pediatrics. All rights reserved. Print ISSN: 1073-0397.