Nat. Hazards Earth Syst. Sci., 13, 1445–1455, 2013 www.nat-hazards-earth-syst-sci.net/13/1445/2013/ doi:10.5194/nhess-13-1445-2013
© Author(s) 2013. CC Attribution 3.0 License.
EGU Journal Logos (RGB)
Advances in
Geosciences
Open Access
Natural Hazards
and Earth System
Sciences
Open Access
Annales
Geophysicae
Open Access
Nonlinear Processes
in Geophysics
Open Access
Atmospheric
Chemistry
and Physics
Open Access
Atmospheric
Chemistry
and Physics
Open Access
Discussions
Atmospheric
Measurement
Techniques
Open Access
Atmospheric
Measurement
Techniques
Open Access
Discussions
Biogeosciences
Open Access Open Access
Biogeosciences
DiscussionsClimate
of the Past
Open Access Open Access
Climate
of the Past
Discussions
Earth System
Dynamics
Open Access Open Access
Earth System
Dynamics
Discussions
Geoscientific
Instrumentation
Methods and
Data Systems
Open Access
Geoscientific
Instrumentation
Methods and
Data Systems
Open Access
Discussions
Geoscientific
Model Development
Open Access Open Access
Geoscientific
Model Development
DiscussionsHydrology and
Earth System
Sciences
Open Access
Hydrology and
Earth System
Sciences
Open Access
Discussions
Ocean Science
Open Access Open Access
Ocean Science
Discussions
Solid Earth
Open Access Open Access
Solid Earth
DiscussionsThe Cryosphere
Open Access Open Access
The Cryosphere
Discussions
Natural Hazards
and Earth System
Sciences
Open Access
Discussions
Augmenting Austrian flood management practices through
geospatial predictive analytics: a study in Carinthia
S. M. Ward1and G. Paulus2
1Department of Geography and Anthropology, Louisiana State University, Baton Rouge, Louisiana, USA 2Carinthia University of Applied Sciences, School of GeoInformation, Villach, Austria
Correspondence to: S. M. Ward ([email protected]) and G. Paulus ([email protected])
Received: 3 October 2012 – Published in Nat. Hazards Earth Syst. Sci. Discuss.: – Revised: 15 February 2013 – Accepted: 20 February 2013 – Published: 11 June 2013
Abstract. The Danube River basin has long been the
loca-tion of significant flooding problems across central Europe. The last decade has seen a sharp increase in the frequency, duration and intensity of these flood events, unveiling a dire need for enhanced flood management policy and tools in the region. Located in the southern portion of Austria, the state of Carinthia has experienced a significant volume of intense flood impacts over the last decade. Although the Austrian government has acknowledged these issues, their remedial actions have been primarily structural to date. Continued fo-cus on controlling the natural environment through infras-tructure while disregarding the need to consider alternative forms of assessing flood exposure will only act as a provi-sional solution to this inescapable risk. In an attempt to rem-edy this flaw, this paper highlights the application of geospa-tial predictive analytics and spageospa-tial recovery index as a proxy for community resilience, as well as the cultural challenges associated with the application of foreign models within an Austrian environment.
1 Introduction
While flooding has long signified one of the most ubiquitous hazard risks throughout Austria, one can argue that the catas-trophic flood event in August of 2002 characterizes a semi-nal moment in flood risk management for the central Euro-pean nation (EuroEuro-pean Commission, 2002). The last compa-rable event to impact this Alpine region occurred in 1899, far surpassing the memory of even its eldest citizens. With-out this a posteriori knowledge, it is difficult to imagine flood mitigation being at the forefront of modern Austrian
politi-cal agendas. On the surface this statement appears to be an appropriate depiction of the reason behind the devastation in 2002, but a closer look at flood history and flood management in Austria reveals a different story. Dating back to as early as 1954, the Austrian portions of the Lower Danube River basin have been subjected to intense flood events resulting in sig-nificant economic damages and loss of life (Bl¨oschl et al., 2012; Arellano et al., 2007). Although none of these events have equaled the 2002 flood, their frequency and intensity have steadily increased, with the first decade of the millen-nium realizing the most concentrated period of flooding in modern history (Frei et al., 2006; Caspary, 2004). Coinci-dent with the steady rise in flood events throughout the coun-try since the mid-twentieth century, has been a maturation of flood mitigation strategy (Arellano et al., 2007). When con-sidering the fact that Austrian authorities have frequently en-hanced flood mitigation efforts over the last 60 yr, it is rea-sonable to question why flooding since the 2002 event has continued to result in such negative impacts throughout the country.
In order to shed light upon this inquiry, the authors have expanded upon flood recovery modelling research initiated in 2009 in the province of Carinthia. Utilizing a spatial re-covery index as a proxy for flood resilience in the region, the 2009 study sought to define local flood risk in a context dif-ferent from the typical engineering based analyses (Ward et al., 2009). The results of this analysis relied upon the appli-cation of a recently developed geospatially based model for identifying flood recovery potential. With the application of this model at the core, the intent of the 2009 study was to do the following:
1. Determine if a geospatially based model developed for an urban area in the United States could be applied to other regions throughout the world.
2. Identify what factors might limit the effectiveness of model execution and value of results.
3. Provide a tool by which planners in the Carinthia region could assess vulnerability to flooding.
While reviewing literature and exploring the results of this analysis, the authors were able to not only answer the afore-mentioned questions, but also identify a number of subtleties underlying the subject of flood risk within the study region in Lower Austria. More revealing than the spatial distribu-tion of recovery potential was the lack of research and in-formation focused on the socio-cultural aspects of flooding. When considered in conjunction with the structural and en-gineering focus of the current literature on flooding in the region, it becomes clear that an alternative approach to as-sessing flood risk is necessary. It is speculated that many flooding problems in Austria stem from anthropogenic al-terations to rivers and streams (Arellano et al., 2007). Over-managing these features has led to a false sense of security, stimulated development in hazard zones, and exaggerated the intersection between vulnerable populations and the physical elements which put them at risk. Continuing to rely on flood mitigation strategies based primarily on the engineering and physical factors driving risk may be inadvertently increasing public apathy towards flooding. Furthermore, it is important that officials charged with flood control begin to adopt a more investigative approach to assessing risk.
1.1 Flood history and study region
Central Europe has long been at significant risk from flood-related hazards, especially those areas lying within the Danube Basin (Zischg et al., 2011). Extended periods of rain and flash flood events associated with the tributaries of the Danube have been characterized as the most important haz-ard impacting Austrian communities; yet, the hazhaz-ardscape of many portions of the country remain largely misunderstood (Bl¨oschl et al., 2012; Gaume et al., 2009). Exasperating the impact of this risk is the fact that over 70 % of the Austrian landscape is covered by mountainous terrain (Keiler et al., 2010; Staffler et al., 2008). This steep topography limits de-velopable land and in turn has led to unsustainable develop-ment patterns and dense population distribution (Embleton-Hamann, 1997; Url and Sinabell, 2008). When one consid-ers this in conjunction with the fact that over 93 people per square kilometer live within the Austrian territory drained by the Danube, the grave nature of this risk is quite hum-bling (Sch¨onerklee, 2008). An analysis of the 2002 flood event reinforced this threat, suggesting that over 40 % of the flooded areas were heavily developed based on legal land use planning ordinances (Paulus et al., 2004). An
Embleton-Hamann (1997) study also advises that 9–12 % of structures in Austria are considered to be at extreme risk to floods.
To state that the 2002 flood event did not result in a re-newed interest in limiting the impacts of hazards would be misleading. Austrian authorities have taken significant steps to understand the driving factors behind floods, to quantify their risk, and to communicate this risk to planners and cit-izens. Furthermore, the need for increasingly sophisticated understanding of flood risks has not gone unnoticed by the European Union (EU) (Paulus et al., 2004). The EU Flood Directive, developed in 2006, has called for a reduction in flood-related risks to health, property and infrastructure (Paulus et al., 2004). Leading up to the establishment of this directive, the nations impacted by the 2002 event gathered at a workshop hosted in Vienna. Experts in numerous flood-related fields worked to develop a series of recommendations related to flood risk reduction strategies (Nachtnebel, 2007). The fatal flaw in this workshop, as pointed out by Nacht-nebel (2007), was the fact that the shortcomings to flood risk management identified in Vienna were no different than those identified following floods a half-century prior. To this end, Nachtnebel (2007) has suggested that insufficient imple-mentation and coordination are the primary limiting factors to improved flood risk management in Central Europe.
S. M. Ward and G. Paulus: Augmenting Austrian flood practices 1447
platform depicts flood zones in much the same way as the Digital Flood Insurance Rate Maps prepared by the Federal Emergency Management Agency in the United States. As in-formative as the eHORA platform proved to be, the analy-sis used to generate its data was limited to a steady-state model which does not consider discharge, impacted struc-tures, impacted population, or any other details. For this rea-son, the map’s usefulness is restricted to basic development decisions.
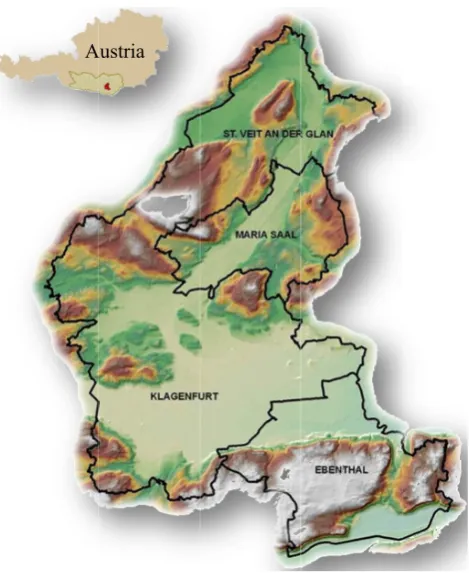
Despite the efforts highlighted in the previous paragraph, recent studies have described the administrative areas within Lower Austria as having the highest level of flood risk in the country (Embleton-Hamann, 1997). Couple this with the significant risk of torrent hazards and Carinthia represents a particularly vulnerable region in Lower Austria. Carinthia of-fers a unique blend of both mountainous terrain and relatively flat valleys populated with well-established urban, suburban, and rural communities intersected by numerous rivers and streams (Kosaret al., 2011). Bearing these characteristics in mind, Carinthia presented itself as an ideal candidate for this study. Based on data availability, the municipalities of Kla-genfurt, Ebenthal, Maria Saal, and St. Veit an der Glan were selected for analysis (Fig. 1). These areas were determined to be representative of both the physical and cultural geography of Carinthia, allowing for broader conclusions to be drawn from results of the analysis. The primary rivers dividing the study region are the river Glan and the river Gurk. The con-fluence of these two features is in the Ebenthal region in the southern portion of the study area.
The analysis and data collection phase of this study was initiated in June of 2009 at the Carinthia University of Ap-plied Sciences (CUAS) to the west of the study region in Vil-lach, Austria. Complementary research on Natural Hazards in Carinthia was being conducted at the university during the same time frame, offering a healthy academic environment for this project. Data for this study was largely provided by KAGIS, Corine Land Cover (CLC) and the government of Carinthia. The initial stages of the work were presented at the 2009 GI-Forum in Salzburg and a companion study was con-ducted at CUAS in 2010 (Kosar et al., 2011). While research can often be conducted from remote locations, centring it in Carinthia provided invaluable insight into the at-risk geogra-phy and communities being studied.
2 Spatial recovery index: methods and results
The spatial recovery index (SRI) was initially developed as a rapid means of assessing post disaster recovery based upon the spatial distribution of undamaged critical infrastructure (Ward et al., 2010). An evaluation of the results of the SRI demonstrated variations in the model’s fidelity based on the structure of input parameters as well as scale. Further re-search has demonstrated that the index has potential benefit as a metric for resilience when applied to pre-event
condi-114 115 116 117 118 119 120 121 122 123 124 125 126 127 128 129 130 131 132 133 134 135 136 137 138 139 140 141 142 143 144 145 146 147 148 149 150 151 152 153 154 155 156 157 158
manage
Carinthi
transitio
national
Federal
2006). B
100, and
to the e
each fed
way as t
Agency
used to
impacte
usefulne
Despite
adminis
(Emblet
represen
both m
suburba
Bearing
Carinthi
candida
data av
of Klag
and St
selected
These a
represen
and cult
allowing
be draw
The prim
region
river Gu
two feat
in the s
area.
The an
phase o
June o
Univers
(CUAS)
region
Comple
ment in the
ia is consist
on from dea
l level, the H
Ministry o
By 2006, th
d 300 year r
eHORA rele
deral provin
the Digital
y in the Unit
generate its
ed structure
ess is restric
the efforts
strative area
ton-Hamann
nts a particu
ountainous
an, and rura
g these chara
ia presented
ate for this
vailability, t
genfurt, Ebe
. Veit an
d for anal
areas were
ntative of b
tural geogra
g for broad
wn from resu
mary rivers
are the riv
urk. The co
tures is in th
southern po
nalysis and
of this study
of 2009 a
sity of A
) to the w
in V
ementary re
e region (Pa
tent with a t
aling with in
Hochwasser
of Agricultu
he program
return perio
ease, flood
nce (Faber, 2
Flood Insur
ted States. A
s data was l
es, impacted
cted to basic
s highlighte
as within low
n 1997). Co
ularly vulne
terrain and
al communi
acteristics in
d itself as a
study. Ba
the munici
enthal, Mari
der Glan
lysis (Figu
determined
both the p
aphy of Ca
der conclus
ults of the an
dividing th
ver Glan a
onfluence o
he Ebenthal
ortion of the
d data col
y was initi
at the Ca
Applied S
west of the
Villach,
A
search on N
aulus et al. 2
trend in Aus
ndividual ha
rrisikozonie
ure, Forestry
released its
ods via an o
damages an
2006). The e
rance Rate M
As informat
limited to a
d populatio
c developme
ed in the p
wer Austria
ouple this w
erable regio
d relatively
ities interse
n mind,
an ideal
ased on
ipalities
ia Saal,
n were
ure 1).
d to be
physical
arinthia,
ions to
nalysis.
he study
and the
of these
l region
e study
llection
ated in
arinthia
ciences
e study
Austria.
Natural
2004). This
stria which h
azards to an
rung Austri
ry, Environm
s first maps
nline versio
nd managem
eHORA pla
Maps prepa
tive as the e
steady state
on, or any
ent decision
previous par
as having t
with the sign
on in lower
y flat valley
ected by nu
A
Figure 1: St
integrated
has seen the
all-hazards
ia (HORA) w
ment, and W
s depicting
on of HORA
ment proces
atform depic
red by the F
eHORA pla
e model wh
other deta
ns.
ragraph, rec
the highest l
nificant risk
Austria. Ca
ys populate
umerous riv
Austria
tudy Area in
approach to
e manageme
s perspective
was launche
Water Man
nationwide
A (eHORA)
sses were h
cts flood zon
Federal Eme
atform prov
hich does no
ails. For th
cent studies
level of floo
of torrent h
arinthia offe
ed with we
vers and str
n Carinthia
o risk mana
ent of natur
e (Zischg 20
ed in late 20
nagement (B
flood risk
) (Zischg 20
andled diffe
nes in much
ergency Ma
ed to be, th
ot consider d
his reason,
s have desc
od risk in th
hazards and
ers a unique
ell-establish
reams (Kos
Austria
agement in
ral hazards
011). At a
002 by the
BMLFUW
at the 30,
011). Prior
ferently by
h the same
anagement
he analysis
discharge,
the maps
cribed the
he country
d Carinthia
e blend of
hed urban,
ar, 2010).
Fig. 1. Study area in Carinthia Austria.
tions (Ward et al., 2010). In consideration of this probable value and the narrow flood management scope identified in the current literature, the SRI was used to assess flood risk in the study region. Offering an alternative measure of flood risk across the community provides the initial shift away from engineering centric flood management strategies called for in recent work (Gaume et al., 2009; Faber, 2006; Ganoulis, 2009). Url and Sinabell (2008) have also called for policy, insurance, and social consideration to drive a new integrated approach to flood management in Austria. The SRI also an-swers the call of Paulus et al. (2004) and Szab´o (2007), who have independently cited the need for an increased applica-tion of geospatial technology for hazards and disasters man-agement in the region.
Based upon the results of their prior research, the au-thors have posited that flood resilience can be measured rapidly in the absence of social or even flood-related data by using the spatial proximity of structures. This can be realized because of the fact that structures are not one di-mensional when considered in the recovery context. Build-ings and their intended purpose are facilitators of social net-works (i.e. schools, churches, community centres, and ath-letic clubs). For instance, the negative consequences associ-ated with an individual residence impacted by a flood will generally be isolated to a single family. On the other hand, buildings which house critical infrastructure or social capi-tal have the ability to impact a much larger portion of the
population as multiple families rely on them as part of their social network. The SRI model is based on the notion that buildings which provide services to the entire community have more importance to the resilience of that community than any single family dwelling (Ward et al., 2010). This can be evidenced in the case of a water treatment facility being damaged by a flood, restricting the entire community’s ac-cess to potable water whether or not the flood impacted the community itself. By identifying the spatial location of struc-tures housing the key components of social networks within a community, one can begin to create a spatial network or sphere of influence that each structure contributes to the pub-lic. When combined with the “spheres” of all other compo-nents, a surface depicting resilience or recovery potential can be created. This overall range of influence is captured by the SRI and can be run pre-event or even post-event based on damaged facilities. Because all of this analysis is con-ducted using the geoprocessing capabilities of GIS software, the data can then be analysed to identify characteristics about the distribution of resilience across the study region, or com-pared to engineering studies to offer decision makers a more comprehensive view of risk.
2.1 Carinthia case study
In the case of the Carinthia study, three variants of the SRI were conducted based on varying input parameters, model structure, and scale. The multiple iterations were necessary to understand what modifications were necessary to prop-erly employ the model. The SRI was originally developed to operate in the urban environment of a medium-sized city, and it was suspected that running an unmodified version may produce misleading results. A variety of input variables are divided into recovery indicators (i.e. structures) and vulner-ability indicators (i.e. flood zones). The influence of each of these variables on the community is based on distance decay theory and represented using a Euclidean distance conver-sion to a raster dataset with the same cell size as the elevation DEM. These two categories are then combined in the model using an additive raster calculation to produce a final SRI value. From this output the data can be resampled, divided into administrative units with a zonal analysis, or analysed for patterns and relationships.
2.2 SRI 2009
The first model runs were conducted using the exact frame-work as the original SRI detailed in the 2009 study in New Orleans (Ward et al., 2010). Every available dataset for the study region which was part of the original SRI data structure was clipped and incorporated into the analy-sis. These datasets included railroads, power lines, churches, schools, healthcare facilities, roads, flood zones, elevation, fire brigades, police stations, gas terminals, rivers, and wa-ter stations. The output from this scenario was intriguing as
it demonstrated a higher level of resilience and less variance than expected (Fig. 2a). The same trend was present when the model was executed with just the recovery indicators (Fig. 2b). The vulnerability indicators associated with ele-vation, slope, flood zones and other natural features revealed a normal distribution of vulnerability in relation to rivers in the region when run on their own (Fig. 2c). The symbology in Fig. 2 depicts high recovery potential in green decreasing on a colour gradient from yellow to orange, and finally to red, which is indicative of the least resilient areas of the region.
The lack of variation in the output of this initial SRI anal-ysis suggests a flaw in model inputs or structure. Segregating the components of the model into individual variables shows that the number of buildings included in the recovery indi-cators far exceeded the total number of variables ever run in the model, artificially enhancing the value of these input vari-ables and homogenizing the model output. This high number of records was symptomatic of the large study area, a higher quality data set and the pre-event status of the scenario. How-ever, the results of this first model run did demonstrate that the necessary data were available to run the model and pro-duce results which had some spatial commonality with the flood zones from eHORA.
2.3 SRI 2010
S. M. Ward and G. Paulus: Augmenting Austrian flood practices 1449 203 204 205 206 207 208 209 210 211 212 213 214 215 216 217 218 219 220 221 222 223 224 225 226 227 228 229 Spatial Recovery Index
Figure 2: T 2.1 Car
In the c input p understa original suspecte variable flood zo decay th same ce an addit resampl relation 2.2 SRI The firs the 2009 which w These d flood zo output f variance with ju elevatio vulnerab symbolo from ye region. Three Comp rinthia Case
case of the parameters, and what m
ly develope ed that runn es are divid ones). The heory and r ell size as th tive raster c led, divided
ships.
I 2009
st model run 9 study in N was part of t
datasets inc ones, elevati from this sc e than expe ust the reco on, slope, f bility in re ogy in Figu ellow to ora
onents of 20 e Study
Carinthia st model stru modification
ed to opera ning an unm ded into rec influence o represented he elevation
calculation d into admin
ns were con New Orlean the original luded railro ion, fire brig cenario was ected (Figur overy indica flood zones elation to ri ure 2 depict
ange and fin
Recovery Indicators
009 SRI Ana tudy, three ucture, and ns were nec ate in the ur modified vers overy indic of each of th
using a Euc DEM. Thes to produce nistrative un
nducted usin ns (Ward et SRI data st oads, power gades, polic intriguing, e 2a). The ators (Figu s and other ivers in the ts high reco
nally to red
alysis variants of d scale. Th cessary to p rban enviro sion may pr cators (i.e. s hese variab clidean dist se two categ
a final SR nits with a z
ng the exac al. 2010). E tructure was r lines, chu ce stations, g
as it demon same trend ure 2b). Th r natural fe e region w overy potent d which is i
Vu In f the SRI w
he multiple properly em onment of a
roduce misle structures) a les on the c ance conver gories are th RI value. Fr
zonal analy
t framework Every avail s clipped an urches, scho gas terminal nstrated a h was presen he vulnerab features rev when run on
tial in green indicative o
lnerability ndicators were conduct
e iterations mploy the m a medium s
eading resul and vulnera community rsion to a ra hen combine rom this out sis, or analy
k as the ori able dataset nd incorpora ools, healthc ls, rivers, an igher level nt when the bility indica vealed a no n their own n decreasing of the least
ted based o s were nec model. The ized city, a lts. A variet ability indic is based on aster datase ed in the mo tput, the da yzed for pa
iginal SRI d t for the stu ated into the
care faciliti nd water sta of resilienc model was ators associ ormal distri n (Figure 2 g on a colo
resilient are
on varying cessary to
SRI was and it was ty of input cators (i.e.
n distance et with the odel using ata can be atterns and detailed in udy region e analysis. ies, roads, ations. The ce and less s executed iated with ibution of 2c). The or gradient eas of the
Fig. 2. Three components of 2009 SRI analysis.
modification in cell size for the analysis, the relative weight of recovery indicators and vulnerability indicators were con-sidered. Kosar et al. (2011) speculated that in addition to the aforesaid faults with the recovery data, the vulnerability in-dicators were also contributing to the limited detail in the model output. To account for this proposed flaw, the vulner-ability indicators were weighted forty percent less than the recovery indicators in the final SRI output.
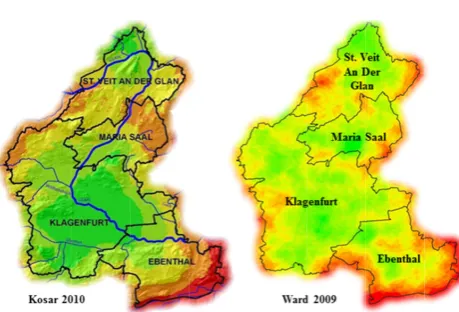
At a cursory glance, the output of the Kosar et al. (2011) SRI analysis produced varying results from the original SRI analysis in 2009. Figure 3 compares the original SRI output to the modified version using the same symbology to repre-sent recovery potential as that used in Fig. 2. When compar-ing the two assessments, the overall recovery potential for the study region is fairly consistent with the exception of a few areas. The rural corridor between St. Veit An Der Glan and Maria Saal, the areas of Ebenthal to the southeast of Klagen-furt and the region to the northwest of KlagenKlagen-furt all have a reduced capacity for recovery based on Kosar’s SRI method-ology. Review of the individual data components in these re-gions unveils similarities in their physical geography which may be leading to the consistency in their low level of recov-ery potential (Kosar et al., 2011). Kosar also suggests that the large number of structures supporting social networks within the cities has a high level of influence on the high SRI scores in these areas. While a distinct change in output exists be-tween these two models, it is unclear based on the work by Kosar et al. (2011) what is driving this dynamic. By altering the structure, input variables, weighting scheme, and grid cell size in a single model run, it is impossible to determine if a single modification or a combination of adjustments have led to the variance in model output. The 2010 analysis was also restricted by the fact that it did not analyse the data using ad-ministrative units smaller than the municipality. While areas such as Klagenfurt appear to be largely immune when viewed at the municipal or regional scale, analysing the results from these areas at varying administrative units (i.e. postal codes, neighbourhoods, land use, etc.) may tell a different story. 273 274 275 276 277 278 279 280 281 282 283 284 285 286 287 288 289 290 291 292 293 294 social n areas. W
the wor variable determin model o using ad to be lar these ar tell a di for Mar model o attempti Althoug the revis interpre improve depicted as the h high pot Fi
networks wi While a dist
rk by Kosar es, weightin ne if a sing output. The dministrativ rgely immu reas at varyi ifferent story ria Saal by output. Unf ing to draw gh these lim
sed method ted and mo ement was d on eHORA high risk are
tential for re igure 3: 201
ithin the cit inct change
r et al. (201 ng scheme, gle modifica 2010 analy ve units sma une when vie ing adminis y. Kosar et itself, dem fortunately, w conclusio mitations ma ology emplo ore consisten further con A. While th eas identifie ecovery from 0 Kosar SRI
ties has a hi in output e
10) what is and grid ation or a c ysis was als aller than th ewed at the strative unit
al. (2010) a monstrating t this single ons on com ay restrict th
oyed in the nt with the nfirmed wh he extent of ed by the S m Klagenfu I compared
igh level of xists betwee
driving thi cell size in ombination so restricted he municipa municipal s (i.e. posta attempted to that varying model run mponent in he model fro
2010 study distribution hen the outp f the eHOR RI; the gen urt througho to 2009 Wa
f influence en these two
is dynamic. n a single of adjustm d by the fact ality. While or regional al codes, nei o address th g the scale at the mun nfluence and om being an did produc n of popula put was com RA delineate
neral trend o ut the rest o rd SRI
on the high o models, it
By altering model run, ments have l t that it did areas such scale, analy ighborhood his issue by has signific nicipal scale d city-wide n effective d e results wh ation across mpared to ed risk zone of risk trans of the study
h SRI score t is unclear b
g the struct , it is impo led to the v d not analyz as Klagenfu yzing the re
s, land use, y executing cant influen e is inadequ e recovery decision sup hich were m the landsca the flood r es is not as sitioning fro
area is repr es in these
based on
ture, input ossible to variance in ze the data furt appear sults from etc.) may the model nce on the uate when potential. pport tool, more easily ape. This risk zones expansive om low to esented. Fig. 3. 2010 Kosar SRI compared to 2009 Ward SRI.
Kosar et al. (2011) attempted to address this issue by exe-cuting the model for Maria Saal by itself, demonstrating that varying the scale has significant influence on the model out-put. Unfortunately, this single model run at the municipal scale is inadequate when attempting to draw conclusions on component influence and city-wide recovery potential. Al-though these limitations may restrict the model from being an effective decision support tool, the revised methodology employed in the 2010 study did produce results which were more easily interpreted and more consistent with the distri-bution of population across the landscape. This improvement was further confirmed when the output was compared to the flood risk zones depicted on eHORA. While the extent of the eHORA delineated risk zones is not as expansive as the high risk areas identified by the SRI, the general trend of risk tran-sitioning from low to high potential for recovery from Kla-genfurt throughout the rest of the study area is represented.
2.4 SRI 2011
In late 2011 the topic of recovery in the same region of Carinthia was revisited once more in an attempt to further refine the SRI methodology. Prior to this analysis, Zischg et
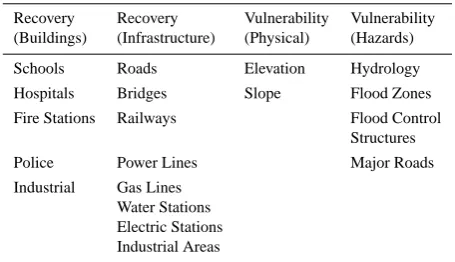
Table 1. Recovery and vulnerability elements included in 2012 en-hanced Austrian SRI.
Recovery Recovery Vulnerability Vulnerability (Buildings) (Infrastructure) (Physical) (Hazards)
Schools Roads Elevation Hydrology Hospitals Bridges Slope Flood Zones
Fire Stations Railways Flood Control Structures Police Power Lines Major Roads
Industrial Gas Lines Water Stations Electric Stations Industrial Areas
al. (2011) approached the assessment of risk to natural haz-ards in Carinthia as a function of climate change. This Euro-pean study took a very similar approach to the original SRI analysis which considered structures as key elements of vul-nerability. Just as Ward et al. (2010) postulated in the New Orleans study, Zischg et al. (2011) identified a list of at-risk elements exposed to hazards. These elements were largely structural in nature and grouped into three categories: build-ings (e.g. buildbuild-ings, schools, and domiciles), infrastructure (e.g. roads, power lines, bridges, gas lines, and railways), and agriculture (e.g. farmland, grassland, and forest). These cat-egories were derived from the European Water Framework Directive and the guidelines for cost–benefit analyses in hy-draulic engineering (BMLFUW, 2006, 2008). These cate-gories were reviewed by a team of local administrators in Carinthia to adjust for native conditions. Prior to the Zischg et al. (2011) study, the SRI had been used in Austria with little variation in the methodology or recovery features in-cluded in the model. With the intent to modify the index to be more reflective of Austrian ideology, the SRI analysis was conducted in 2012 using these new at-risk elements to re-place the original recovery indicator components.
When considering these categories in the context of the SRI methodology, there are two very interesting variances. The first is the heavy focus on domiciles (single-family and multi-family), while the second is the lack of any cultural or commercial facilities. No churches, banks, pharmacies, gro-cery stores or elder care facilities were included in the at-risk elements classification used in the Zischg et al. (2011) study, indicating a possible variation in Austrian risk percep-tion when compared to that identified in New Orleans. While Zischg et al. (2011) progress to an increasingly complex as-sessment and estimation of impacted population based on the conflation of various datasets focused on these at-risk ele-ments, the SRI adopted a less intricate approach. It was im-portant for the SRI analysis on these new classes to stay true to its original intent and only consider these elements from a spatial perspective. The final SRI run used the Austrian at-risk elements detailed in Table 1.
This input data represented a significant reduction in vari-ables used to calculate the SRI when compared to the afore-mentioned versions of the analysis. This decrease in input variables was welcomed as the overwhelming volume of data used in the 2009 study was suspected of reducing the quality of the model output. The data layers were each converted to a raster format using the geoprocessing procedures outlined in the 2009 SRI study in New Orleans (Ward et al., 2010). These raster files represented each at-risk element’s potential level of influence on recovery based on Euclidean distance. The level of influence on recovery for each element was inversely related to the distance between structures. These rasters were summed using a raster calculation to create a single layer rep-resenting recovery potential for the entire study region. The output of this SRI analysis is compared to the 2009 and 2010 indices in Fig. 4.
Visual inspection of the 2012 SRI results illustrates a bal-ance between the data-rich 2009 study and the heavily ma-nipulated 2010 analysis. The primary distribution of recovery potential across the study area is very similar using all three methods, but further analysis of the 2012 data revealed sig-nificant patterns which were not present in the 2009 and 2010 studies. Using a global spatial autocorrelation (Moran’s I) tool in the spatial statistics extension in ArcGIS, the re-sults of the 2012 study were analysed. The Moran’s I analy-sis demonstrated significant clustering of recovery potential throughout the study region (Fig. 5) with a Moran’s I index value of 0.85 andpvalue of 0.00187, both of which desig-nate clustering at a significance interval of 0.01. Having not seen a significant level of clustering in the output of the 2009 and 2010 iterations of SRI, it was important to gain an un-derstanding of the nature of the general trend identified in the 2012 study.
Significant areas of high and low clustering or “hot/cold spots” were examined using a local Getis–Ord Gi∗analysis. This statistical method assigned azscore andpvalue to each cell in the final output raster and identified significant areas of high and low clustering of recovery potential. Areas with a highzscore and lowpvalue represent hot spots (red) where high recovery values are clustered, while areas with low neg-ativezscores and smallp values indicate cold spots (blue) where low recovery values are clustered (Fig. 6). All other cells in the output raster havezscores near zero which indi-cate no apparent clustering of recovery values.
S. M. Ward and G. Paulus: Augmenting Austrian flood practices 1451 325 326 327 328 329 330 331 332 333 334 335 336 337 338 339 340 341 342 343 344 345 346 347 348 349 350 351 Figure This inp compare welcom the qual geoproc These r based on related t to create this SRI Visual i and the the stud revealed spatial a the 201 recovery p-value seen a s importa Signific Getis O final ou potentia recovery cold spo raster ha
e 4: Compar
put data rep ed to the af med as the ov lity of the m
cessing proc raster files
n Euclidean to the distan e a single la I analysis is
inspection o heavily ma dy area is v d significant autocorrelat
2 study we y potential t of .00187; b significant le ant to gain an
cant areas o rd Gi* anal utput raster al. Areas w y values are ots (blue) w ave z-scores
rison of 2009
presented a foremention verwhelmin model outpu cedures outl represented n distance. T
nce between ayer represe
compared t
of the 2012 anipulated 20
very similar t patterns w tion (Moran ere analyzed
throughout t both of whi evel of clus n understan
of high and lysis. This s r and ident with a high
e clustered, where low re s near zero w
9, 2010, and
significant ned versions
g volume of ut. The data
lined in the d each at-ris
The level of n structures enting recov
to the 2009
SRI results 010 analysi r using all which were n ’s I) tool in d. The Mor the study re ich designat stering in th nding of the
low cluster tatistical me tified signif z-score an while areas covery valu which indic
2011 SRI R
reduction i s of the ana f data used
layers were
e 2009 SRI sk element’ f influence
. These rast very potenti and 2010 in
s illustrates is. The prim three meth not present i the spatial ran’s I anal egion (Figur te clustering he output of nature of th
ring or “ho ethod assign ficant areas nd low p-va
with low n ues are clust ate no appa
esults
n variables alysis. This
in the 2009 e each conve
study in N ’s potential
on recovery ters were su al for the en ndices in Fig
a balance b mary distribu hods, but fu in the 2009 statistics ex lysis demon re 5) with a g at a signifi f the 2009 an he general tr
ot/cold spots ned a z-scor s of high a alue represe negative z-sc tered (Figur arent clusteri
used to cal decrease in study was s erted to a ra
New Orleans level of in y for each e ummed usin ntire study r gure 4.
between the ution of reco urther analy
and 2010 st xtension in A nstrated sign Moran’s I in cance interv nd 2010 iter rend identifi
s” were exa re and p-val and low clu
ent hot spo cores and sm re 6). All oth ing of recov
lculate the n input vari suspected o aster format
s (Ward et nfluence on element was ng a raster c region. The
data rich 2 overy poten ysis of the 2
tudies. Usin ArcGIS, the nificant clu ndex value val of .01. H
rations of S ied in the 20
amined usin lue to each ustering of ots (red) w mall p-value her cells in very values.
SRI when iables was f reducing t using the
al. 2010). n recovery s inversely calculation e output of
2009 study tial across 2012 data ng a global e results of ustering of
of .85 and Having not SRI, it was 012 study.
ng a local cell in the f recovery where high es indicate
the output
Fig. 4. Comparison of 2009, 2010, and 2011 SRI results.
352 353 354 355 356 357 358 359 360 Reviewi in the ur obvious structure high rec recovery risk elem Figure 5 Figure 6
ing both the rban areas o s choices f
es. Of great covery pote y potential i ments in the 5: Global Spa
6: Local Spa
e global and of Klagenfu for high re ter interest t ential northw
in Ebenthal ese regions atial Autoco
atial Autocor
d local statis urt, Maria S
covery pot to emergenc west and so l and to the
provides lim orrelation –
rrelation – H
stics reveals aal, and St. tential due cy managers
outhwest of east and we mited option Moran’s I R
Hot Spot An
s the highest Veit An D to their d s in the regio f Klagenfur
est of St. V ns within th Results
nalysis (Getis
t clustering er Glan. Th density of a
on may be t rt as well a eit An Der he built envi s Ord Gi*)
of recovery hese urban c at-risk elem the smaller c s the cluste Glan. The l ironment for
y potential centers are ments and
clusters of ers of low lack of at-r at-recoveat-ry Fig. 5. Global spatial autocorrelation – Moran’s I results.352
353 354 355 356 357 358 359 360 Reviewi in the ur obvious structure high rec recovery risk elem Figure 5 Figure 6
ing both the rban areas o s choices f
es. Of great covery pote y potential i ments in the 5: Global Spa
6: Local Spa
e global and of Klagenfu for high re ter interest t ential northw
in Ebenthal ese regions atial Autoco
atial Autocor
d local statis urt, Maria S
covery pot to emergenc west and so l and to the provides lim orrelation –
rrelation – H
stics reveals aal, and St. tential due cy managers
outhwest of east and we mited option Moran’s I R
Hot Spot An
s the highest Veit An D to their d s in the regio f Klagenfur
est of St. V ns within th Results
nalysis (Getis
t clustering er Glan. Th density of a
on may be t rt as well a eit An Der he built envi s Ord Gi*)
of recovery hese urban c at-risk elem the smaller c s the cluste Glan. The l ironment for
y potential centers are ments and
clusters of ers of low lack of at-r at-recoveat-ry Fig. 6. Local spatial autocorrelation – Hot spot analysis (Getis–Ord Gi∗).
for recovery to anchor to. These clusters represent latent ar-eas of vulnerability which may exacerbate the management and mitigation of floods in the region. To put these find-ings into perspective, one must imagine the entire state of Carinthia or country of Austria riddled with these dormant pockets of low recovery potential, creating a network of vul-nerability to floods which cannot be ameliorated by means of structural flood control alone.
3 Risk perception in Austria
Though the results of this third iteration of the SRI proved to be far more promising than the early efforts by Ward et al. (2010) and Kosar et al. (2011), the fact that the benefit came at the expense of the cultural component of recovery in-dicators was stimulating. This was exaggerated further when considering the importance of churches and education facili-ties in the New Orleans study, leading to the conclusion that the application of the SRI in Austria may be suffering from risk perception issues. Without a thorough understanding of risk perception values within Austrian culture, and little doc-umentation of local recovery from large flood events, appro-priate input variables are difficult to identify. Including too many variables may dilute the results of the study (see Ward et al., 2010), while excluding important variables will over-generalize the results (see Kosar et al., 2011). This indef-initeness of input variables highlighted the underlying cul-tural context, which is important to consider when assessing risk and vulnerability. Zischg et al. (2011) began to touch on this in the discussion of his analysis by suggesting that disas-ter management in Austria is experiencing a shift to a more integrated approach. This approach will call for more respon-sibility to be placed on the individual for damages incurred from flooding, but can only be accomplished with improved communication and comprehensive risk perception (Zischg et al., 2011).
The notion of culturally driven risk perception having in-fluence on the application of the SRI is not implausible when cultural theory is considered. In order to gain a better understanding, Gierlach et al. (2010) investigated this phe-nomenon with interesting results. They found that risk per-ception across cultures has little to do with exposure to a dis-aster and more to do with an optimistic bias or “not in my backyard” mentality generated by social construct (Emerg-ing Health Threats Forum, 2008). The idea that hazards play more of a global risk than a local risk is pervasive across cul-tures and often results in imprecise valuation of risk, vulner-ability, and preparedness (Emerging Health Threats Forum, 2008). In light of this, personal experience and socio-cultural factors will often be superseded by ideologies created by groups within the community (Emerging Health Threats Fo-rum, 2008). For instance, individual members of a congrega-tion at a church may undervalue individual risk based on the fact that as a group they are more resilient. This notion is
fur-ther supported by the work of Burton (1972), which points to inflexibility in social and institutional perceptions as a lead-ing cause of repetitive loss to disasters.
In Austria it has been stated that this type of risk percep-tion varies across the country based on expectancy–value the-ory (Thomas, 1981; Hobfoll, 2001). In other words, what benefit do I gain or lose from taking steps to prepare for a flood event? Answering this question can be problematic for the public official who has to balance highly technical risk and vulnerability assessments with public risk perception re-quiring practicality and benefit (Renn, 1998; Homan, 2001). In light of this predicament, the application of methods used to assess vulnerability or recovery potential should be ap-plied with cultural values in mind, whether they are a social metric or not. As such, the SRI as a stand-alone quantification of recovery potential will hold little value with the general public. In order to improve perception with assessment tools such as the SRI, the analysis must be conducted from the ap-propriate cultural perspective and presented in conjunction with additional factors (Fleischhauer et al., 2012). These fac-tors can be referred to as “soft facts” which underscore the “hard facts” or results of technical assessments (Schmidt, 2004). A better understanding of the “soft facts” influenc-ing risk perception in Austria will lead to an improved SRI model based on a refined set of at-risk elements.
S. M. Ward and G. Paulus: Augmenting Austrian flood practices 1453
contribute to a passive view towards change, whether that be policy, technology, building standards, etc. (Gazs´o, 2008). When formulating risk perception towards natural hazards, this detached mentality to policy change and political com-munication can have dire consequences, as its fault may only be recognized following a disaster. In order to improve upon risk communication between the government and the pub-lic, credibility of risk assessment tools must be established through improved risk communication (Reid, 1999). This will in turn lead to a better understanding of how the public perceives risk, what mechanisms of the social network are at greatest risk, and finally, which structures within the built en-vironment are necessary to sustain these social mechanisms (Fleischhauer, 2012). With this information in hand, the SRI can be applied using empirical recovery indicators which are correlated with public risk perception.
4 Discussion
By examining the role of predictive spatial analytics in flood management and mitigation, this study has expanded upon the aforementioned evolution of risk management in Aus-tria. Although the initial phase and scope of the study was to apply the spatial recovery index in Carinthia, the use of this technology also led to a complementary summary of cul-tural influence on risk perception and recovery potential. The two crucial questions behind this investigation focused on the transferability of an urban index developed in the United States to a regional level in Austria, and the influence of cul-ture on the assessment of potential for community recovery. In short, the answer to these is that the SRI can be utilized to assess recovery potential in Austria, but only with signif-icant consideration given to the cultural setting it is being applied in. With this being said, it must be noted that this as-sessment was written from an American perspective based on observed data and research in the study region. As such, the information associated with this study does not lend itself to extrapolation across the rest of the state or country, but does offer a practical framework to build from.
Through three iterations of the SRI model, this study was able to identify that the variables input into the model had more influence on its outcome than the model structure, res-olution or weighting scheme. The results of the analysis indi-cate that although the corridor between Maria Saal and Kla-genfurt may be one of the most vulnerable to floods in all of Austria, the density of recovery indicators in the Klagenfurt area may be able to offset the impacts of a widespread flood. More isolated and localized flooding in the region may result in problematic recovery for areas in Ebenthal and north of Klagenfurt which do not have the combination of recovery elements to facilitate social stability. The analysis could ben-efit from detailed post-flood data in the region which would allow for the most influential at-risk elements to be identified. Moving forward, it would also be beneficial to run different
components of the SRI at varying scales. Isolating the urban areas and rural areas into separate model runs may begin to offer more detail on the variance explained by each indicator used in the analysis, and it would also help eliminate some of the overwhelming volume of data used in the first iteration of the study. In addition, adapting the land cover class devel-oped by Zischg et al. (2011) to account for agricultural lands versus non-agricultural lands may reveal a nuance in recov-ery potential undetected in the scenarios used in this study. It should also be stated that floods do not present the only hazards in this Alpine region. Torrents, avalanches and land-slides represent a few of the other hazards in this region of Carinthia. Couple any one of these events with a large flood event and predicting recovery becomes considerably more complex.
The nuances in recovery potential across this regional setting represent a critical missing component in current flood management practices in Austria. At present, individ-ual structures are not viewed as enablers of social networks, and as such their function and the people they house are placed in a secondary tier of flood management in Austria. One-dimensional flood management and reduced risk com-munication have created a culture with a skewed perception of resilience, risk, and vulnerability. In addition, personal re-sponsibility for flood damages are dwindling and an obliga-tion for rapid and thorough recovery has been left largely in the hands of government (Zischg et al., 2011; Fuchs, 2009). Zischg et al. (2011) recognized this in their loss estimation study, and called for new tools to assess the various compo-nents of disasters in Austria. In order to be effective, these tools had to be able to identify vulnerable hot spots, distin-guish between factors driving vulnerability and risk, and be easily updated with new data and information (Zischg et al., 2011). The results of this study suggest that with limited re-finement, the SRI will meet all of these criteria in a simple and adaptable spatial decision support tool. Combining the SRI’s prediction of recovery with other non-structural mea-sures of vulnerability could place Carinthia at the forefront of flood management practices in Europe.
The integration of cultural values into non-social met-rics in disaster science is not a new idea, but has been relatively dormant in the literature for some time. The recent increase in hazard intensity and frequency across the globe has resulted in a renewed interest in the intersection between these two subjects. This condition was recently illustrated in Austria by Kulmesch (2010), who faced numerous challenges when trying to transition Hazards US (HAZUS) loss estimation models to Austrian communities. In addition, the Federal Emergency Management Agency (FEMA) has only just initiated the RiskMap programme which features the opportunity to combine cultural, social, and non-engineering-based vulnerability assessments with ancillary flood map products (FEMA, 2008). These emerg-ing trends are blurremerg-ing the lines between risk perception, technologically driven risk assessment, and communication
in a manner which provides a new perspective for manag-ing flood hazards. This new viewpoint is a necessity for proactive management of hazards as human environments are increasingly overlapping hazardous geographies around the globe. In a community where the most hazardous geographies are already populated and developed, it does no good to “help” people by delineating flood zones on a map. Communities must find ways to retroactively mitigate flood risk by quantifying and defining recovery potential across these zones, better focusing mitigation funds, and enhancing risk awareness and communication.
Edited by: K.-T. Chang
Reviewed by: two anonymous referees
References
Arellano, A., Vetere, L., de Roo, A., and Nordvik, J.-P.: Reflections on the Challenges of EU Policy-Making with View to Flood Risk Management: Actors, Processes and the Acquis Communautaire, in: Flood Risk Management in Europe, edited by: Begum, S., Stive, M. J. F., and Hall, Jim W., New York, NY: Springer Press, Section V, 2007.
Bl¨oschl, G., Merz, R., Parajka, J., Salinas, J., and Viglione, A.: Floods in Austria, in: Changes in Flood Risk in Europe, edited by: Kundzewicz, Z. W., IAHS Special Publication 10, Walling-ford, Oxfordshire, 2012.
BMLFUW: Richtlinien f¨ur die Wirtschaftlichkeitsuntersuchung und Priorisierung von Maßnahmender Wildbach- und Lawinenver-bauung gem¨aß §3 Abs. 2 Z 3 Wasserbautenf¨orderungsgesetz 1985, Teil I: Kosten-Nutzen-Untersuchung (KNU) und standard-isierte Nutzenuntersuchung, Teil II: Leitfaden Priorit¨atenreihung, Wien, 2006 (in German).
BMLFUW: Kosten-Nutzenuntersuchungen im Schutzwasserbau, Richtlinie, Wien, 2008 (in German).
Burton, I.: Cultural and Personality Variables in the Perception of Natural Hazards, in: Environment and the Social Sciences: Per-spectives and Applications, Wohlwill, J. F. and Carson, D. H., American Psychological Association, New York, NY, USA, 184– 195, 1972.
Caspary, H. J.: Zunahme “kritischer” Wetterlagen als Ursache f¨ur die Entstehung extremer Hochwasser in S¨udwestdeutschland, KLIWA-Symposium (Klimaver¨anderung und Konsequenzen f¨ur die Wasserwirtschaft-Fachvortr¨age) in Wurzburg, 3 und 4 Mai 2004, 135–151, 2004 (in German).
Embleton-Hamann, C.: Austria, in: Geomorphological Hazards of Europe, edited by: Embleton, C. and Embleton-Hamann, C., El-sevier, Amsterdam, 1–30, 1997.
Emerging Health Threats Forum: Culture Sways Views of Disas-ter Risk, available at: http://anitamakri.com/wp-content/uploads/ 2007/12/EHTF10.08.13 anitamakri.com .pdf, last access: July 2012, 2008.
European Commission: Communication From the Commission to the European Parliament and the Council, The European Com-munity Response to the Flooding in Austria, Germany and Several Applicant Countries – A Solidarity-Based Initiative, COM(2002) 481 Brussels, Belgium, available at: http://eur-lex.
europa.eu/, last access: July 2012, 2002.
European Social Survey: available at: http://www. europeansocialsurvey.org/index.php, last access: August 2012, 2011.
Faber, R.: Flood Risk Analysis: Residual Risks and Uncertainties in an Austrian Context, Unpublished Dissertation, University of Natural Resources and Applied Life Sciences, Vienna, Austria, 2006.
FEMA (Federal Emegrency Management Agency): FEMA’s Risk MAP Strategy – Integrating Mapping, Assessment, and Mitiga-tion Planning, available at: http://www.fema.gov, last access: Au-gust 2012, 2008.
Fleischhauer, M., Greiving, S., Flex, F., Scheibel, M., Stickler, T., Sereinig, N., Koboltschnig, G., Malvati, P., Vitale, V., Grifoni, P., and Firus, K.: Improving the active involvement of stake-holders and the public in flood risk management – tools of an involvement strategy and case study results from Austria, Ger-many and Italy, Nat. Hazards Earth Syst. Sci., 12, 2785–2798, doi:10.5194/nhess-12-2785-2012, 2012.
Frei, C., Scholl, R., Fukutome, S., Schmidli, J., and Vidale, P. L.: Future change of precipitation extremes in Europe: Intercompar-ison of scenarios from regional climate models, J. Geophys. Res., 111, D06105, doi:10.1029/2005JD005965, 2006.
Fuchs, S.: Susceptibility versus resilience to mountain hazards in Austria – paradigms of vulnerability revisited, Nat. Hazards Earth Syst. Sci., 9, 337–352, doi:10.5194/nhess-9-337-2009, 2009.
Ganoulis, J. : An Integrated Approach for Flood Risk Management. Real-Time and Deliberative Decision Making, in: NATO Science for Peace and Security Series C: Environmental Security, edited by: Linkov, I., Ferguson, E., Magar, V. S., Springer, Netherlands, 91–101, 2009.
Gaume, E., Bain, V., Bernardara, P., Newinger, O., Barbuc, M., Bateman, A., Blaˇskoviˇcov´a, L., Bl¨oschl, G., Borga, M., Du-mitrescu, A., Daliakopoulos, I., and Garcia, J.: A Compilation of Data on European Flash Floods, J. Hydrol., 367, 70–78, 2009. Gazs´o, A.: The Austrian Experience – project NanoTrust, Presen-tation given at the OECD Working Party on Nanotechnology Workshop on Public Engagement with Nanotechnology, Delft (The Netherlands), 30 and 31 October 2008.
Gierlach, E., Belsher, B. E., and Beutler, L. E.: Cross-Cultural Dif-ferences in Risk Perceptions of Disasters, Risk Anal., 30, 1539– 1549, 2010.
Hobfoll, S. E.: The Influence of Culture, Community, and the Nested-Self in the Stress Process: Advancing Conservation of Resources Theory, Appl. Psychol.-Int. Rev., 50, 337–421, 2001. Homan, J.: A Culturally Sensitive Approach to Risk? “Natural” Hazard Perception in Egypt and the UK, Australian Journal of Emergency Management, 16, 14–18, 2001.
Keiler, M., Knight, J., and Harrison, S.: Climate Change and Geo-morphological Hazards in the Eastern European Alps, Philos. T. R. Soc. A, 368, 2461–2479, 2010.
S. M. Ward and G. Paulus: Augmenting Austrian flood practices 1455
Kulmesch, S.: Evaluation of the HAZUS-MH Loss Estimation Methodology for a Natural Risk Management Case Study in Carinthia, Austria. Austrian Marshall Plan Foundation Scholar-ship Publications, available at: http://www.marshallplan.at, last access: July 2012, 2010.
Nachtnebel, H. P.: Revised Strategies for Flood Risk Management: Lessons from the 2002 Flood in Europe, in: Extreme Hydrolog-ical Events: New Concepts for Security, edited by: Vasiliev, O. F., van Gelder, P. H. A. J. M., Plate, E. J., and Bolgov, M. V., Springer, Netherlands, Extreme Hydrological Events: New Con-cepts for Security NATO Science Series, 78, 417–436, 2007. Paulus, G., B¨ak, R., Flaschberger, G., Gruber, K., Piechl, T.,
Sere-inig, N., and Seymann, C.: Interoperability and Geohazards: A Conceptual Framework for Natural Risk Management in Carinthia, Austria, in: e-Environment: Progress and Challenge, Research on Computing Science, edited by: Prastacos, P., Cortes, U., Diaz de Leon, J. L., and Murillo, M., 11, 219–226, 2004. Reid, S. G.: Perception and Communication of Risk, and the
Impor-tance of Dependability, Struct. Saf., 21, 373–384,1999. Renn, O.: The Role of Risk Perception for Risk Management,
Re-liab. Eng. Syst. Safe., 59, 49–62, 1998.
Schmidt, M.: Investigating Risk Perception: A Short Introduction, Chapter 3, in: Loss of Agro-Biodiversity in Vavilov Centers, with a Special Focus on the Risks of Genetically Modified Organ-isms (GMOs). Unpublished Dissertation. University of Natural Resources and Applied Life Sciences, Vienna, Austria, 2004. Sch¨onerklee, M.: Advances in Managing Austria’s Water
Re-sources, in: Sustainable Use and Development of Watersheds, edited by: G¨onenc¸, ˙I. E., Vadineanu, A., Wolflin, J. P., and Russo, R. C., NATO Science for Peace and Security Series C: Environ-mental Security, Springer, Netherlands, 21–49, 2008.
Staffler, H., Pollinger, R., Zischg, A., and Mani, P.: Spatial variabil-ity and potential impacts of climate change on flood and debris flow hazard zone mapping and implications for risk management, Nat. Hazards Earth Syst. Sci., 8, 539–558, doi:10.5194/nhess-8-539-2008, 2008.
Szab´o, J. A.: Decision Supporting Hydrological Model for River Basin Flood Control, in: Digital Terrain Modelling, Peckham, R. J. and Jordan, G., Springer, Berlin Heidelberg, Germany, 145– 182, 2007.
Thomas, K.: Comparative Risk Perception: How the Public Per-ceives the Risks and Benefits of Energy Systems, P. Roy. Soc. Lond. A Mat., 376, 35–50, 1981.
UN: Tsunami Recovery Status Report Summary, Document pre-pared for the United Nations Information Management Service and Reconstruction Agency for Aceh and Nias, 8–58, 2005. Url, T. and Sinabell, F.: Flood Risk Exposure in Austria – Options
for Bearing Risk Efficiently, Journal of applied social science studies, 128, 593-614, 2008.
Ward, S., Leitner, M., and Paulus, G.: Utilizing GIS Technology in Hazards Research: Applying a Spatial Recovery Index to Assess Vulnerability and Community Resilience in Carinthia, Austria, in: Geospatial Crossroads @ GI Forum ’09, edited by: Strobl, J., Blaschke, T., and Griesebner, G., Herbert Wichmann Verlag, Heidelberg, Germany, 2009.
Ward, S., Leitner, M., and Pine, J.: Investigating Recovery Pat-terns in Post Disaster Urban Settings: Utilizing Geotechnology to Understand Post-Hurricane Katrina Recovery in New Orleans, Louisiana, in: Geospatial Techniques in Urban Hazard and Dis-aster Analysis, edited by: Showalter, P. S. and Lu, Y., New York, NY: Springer Press, 355–372, 2010.
Zischg, A., Schober, S., Sereinig, N., Rauter, M., Seymann, C., Goldschmidt, F., B¨ak, R., and Schleicher, E.: Monitoring the Temporal Development of Natural Hazard Risks as a Basis In-dicator for Climate Change Adaptation, Springer, Netherlands, Nat. Hazards, 1–14, doi:10.1007/s11069-011-9927-0, 2011.