Reduction of Four Wave Mixing Effect in Hybrid Optical
CDMA/WDMA System-A Simulation Study
K.Suresh.
Assistant Professor, Department of Information Technology, Sri Venkateswara College of Engineering.
Abstract––Increase in the data rate of fiber optic communication system is limited due to the nonlinear effects like Self phase modulation (SPM) Cross phase modulation (CPM),Four wave mixing (FWM),Stimulated Raman Scattering(SRS) and Stimulated Brillion scattering (SBS). Many investigations are carried to mitigate these effects and in multi channel systems, four-wave mixing(FWM) in optical fibers[2]induces channel crosstalk and possibly degrades system performance .A technique to design the channel frequency allocation in order to minimize the crosstalk due to FWM is presented. By using suitable unequal channel spacing it can be found that no four-wave mixing product term is superimposed on any of the transmitted channels. This is obtained at the expense of some expansion of the system bandwidth.
Index Terms––Nonlinear effects, Four Wave Mixing (FWM), Crosstalk, Unequal channel spacing,
I.
INTRODUCTION
FWM is a nonlinear process in which three waves of frequencies fi,fj,fk(k i,j) interact through the third order
electric suspectability of the optical fiber to generate a wave of frequency [10]fijk = fi + fj – fk,Thus, three copropagating
waves give rise, by FWM, to nine new optical waves [4]. In a WDM system, this happens for every possible choice of three channel waves, therefore, even if the system has only ten channels, hundreds of new components are generated by FWM. In conventional WDM systems ,the channels are typically equally spaced in frequency .This choice substantially worsens the effects of FWM, since all the product terms generated by FWM in the bandwidth of the system fall precisely at the channel frequencies.This paper is subdivided into nine sections,where in Section2 discusses the study of FWM Effect. Section3 discusses the frequency allocation technique to reduce FWM effect. Section4 gives the system design of FBG based FFH-OCDMAsystem.Section5 gives the details of Fiber model. Section6 gives the details of the optical orthogonal codes for FFH-OCDMA systems.Section7 discusses the receiver model. The conclusion of this work is described in Section8.
II.
STUDY
OF
FWM
EFFECT
The simulation block diagram of Four wave mixing Effect is shown in the Figure1.
Fig.1 Four wave mixing effect system
2.1 Data Stream Block
Fig. 2 PRBS generation Simulink platform
2.2 ASK Modulation
The MZIM to generate ASK modulated signal is modeled as shown in Figure 3.
Out1 1
Zero -Order Hold 1 Sine Wave
PM Modulator Passband PM
Frame Status Conversion 1
To Frame
Frame Status Conversion
To Sample
Add In1
1
Fig. 3 SIMULINK Block diagram of the external MZIM
The ASK modulated output is viewed with the spectrum scope. The simulation is done in such a way that the output consist of twenty-nine scaled frequencies which lies in the range of 5.5 THz – 8.5 THz and represented as (λ0 λ1 λ2
……….. λ28). .Each User is assigned a particular frequency using a Bandpass Filter which allows only one particular
Frequency assigned to the user and filters remaining frequencies.
2.3 FWM Block
The Four Wave Mixing Block is modeled as shown in Figure 4.
In Four Wave Mixing block, three filtered frequencies are passed through the block generating Nine Frequencies which may be a new frequency or same as input frequency creating crosstalk[5] .
Fig. 4 Simulink Block Diagram of FWM Block
2.4 FWM Output
Fig. 5 Spectrum of FWM Effect Output
III.
FREQUENCY
ALLOCATION
TECHNIQUE
The channel allocation design can be reduced to an integer linear programming (ILP) problem, by dividing the available optical bandwidth into equal slots of bandwidth f large enough to avoid appreciable overlap between spectra in adjacent slots. Note that the bandwidth occupied by an FWM wave is only slightly larger than the bandwidth of a channel.Given an reference optical frequency fo, the ith slot is centered around the optical frequency fi=f0 +(ni-1) ∆f , where
ni is an integer that will be referred to as the slot number of the ith frequency slot. In terms of slot numbers,becomes
nijk=ni+nj-nk (k≠ i,j) .If nijk does not coincide with any of the channel slot numbers forany choice of i, j , k, no FWM wave
generated by the signals is created on any of the channel slots.In this paper, ten numbers of DWDM channels are taken and by using the Orthogonal coding technique the frequencies are allocated for the ten channels. The Optical orthogonal code applied in this paper for a 10-channel DWDM system[9] is
C = {1, 6, 16, 22, 30, 39, 50, 57, 69, 82 } with each slot of 25 Ghz wide and Tc=1ns,=4.0x10 -19
s2 where
= (distance between the codes)*Tc/(frequency separation)
The Unequal frequency Spacing allocated for the 10channel- DWDM is given by
{f1=191.9,f2=192.025,f3=192.275,f4=192.425,f5=192.625, f6=192.85, f7=193.125, f8=193.3, f9=193.6, f10=193.925}
IV.
SYSTEM
DESIGN
FOR
SINGLE
USER
In FFH-OCDMA systems the available bandwidth is subdivided into a large number of contiguous frequency slots. The transmitted signal occupies one frequency slot in each chip signaling interval (Tc).Frequency hopping is a method of
spreading a relatively low data rate digital signal over a large bandwidth where carrier frequency of transmitted signal is changed at regular intervals. In FFHSS technique the hop period (Thop) is selected to be less than the symbol period (T), so
that the same symbol is transmitted on multiple hop (Thop<T). The generalized structure for FBG based FFH-OCDMA
system with PIN photo diode detection in the optical domain is shown in Figure. 6.
Fig. 6 Block diagram of FBG based FFH-OCDMA system
At the receiver, a FBG decoder produces a peak in the correlation output for the intended user. Data bits are discriminated in the chip duration using a photodiode followed by a threshold process.
5.1 Modeling of fiber Bragg gratings using coupled-mode theory
A fiber Bragg grating is a short length of optical fiber that reflects particular wavelengths of light and transmits all others. This is achieved by periodically spaced zones in the fiber core are altered to have different refractive indexes slightly higher than the core. This structure selectively reflects a very narrow range of wavelengths. A fiber Bragg gratings reflector can therefore be used as an inline optical filter to block certain wavelengths or as a wavelength-specific reflector in a wave length division multiplexing (WDM) system and used to stabilize the output of a laser. The relation between the spectral dependence of a fiber grating and the corresponding grating structure is usually described by the coupled-mode theory. Coupled-mode theory is described in a number of texts; detailed analysis can be found in [8]. Throughout this analysis, we assume that the fiber is lossless and single mode in the wavelength range of interest. In other words, we consider only one forward and one backward propagating mode. A uniform grating has constant coupling coefficient over a limited
L
z
Equation
1
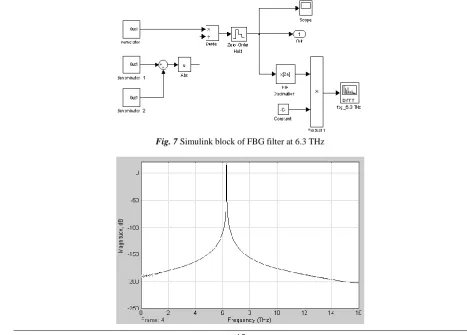
is derived from the coupled-mode theory, models the fiber Bragg grating as reflection filter. This is implemented in Simulink and incorporated into encoder/decoder part of FBG based OCDMA system. The Simulink block diagram of FBG filter for single downscaled frequency
6
.
3
THz
and the corresponding spectrum scope output is shown in Figure.7 and Figure.8 respectively.The conventional FFH-CDMA system requires the frequency synthesizer to select a frequency according to the output from the pseudo-random code generator at the transmitter part. At the same time, the synchronization block is required in the receiver to acquire and maintain synchronism between the code generator and the desired received signal. But the proposed encoder/decoder does not require the frequency synthesizer and hence the synchronization loops, particularly simplifying the decoding operation [1,8].
Fig. 9 Simulink block of FBG encoder
Out 1 fbg _8_4 Out1 fbg _8_1 Out1 fbg _7_9 Out1 fbg _7_5 Out1 fbg _7_3 Out1 fbg _7_0 Out1 fbg _6_8 Out1 fbg _6_7 Out1 fbg _6_3 Out1 fbg _6_2 Out1 fbg _5_8 Out1 fbg _5_7 Out1 Zero -Order Hold Product Gain K -FIR Decimation x[2n] FBG_Decoder B-FFT Digital Filter Design FDATool Constant 1/15 Add
Fig. 10 Simulink block of FBG decoder
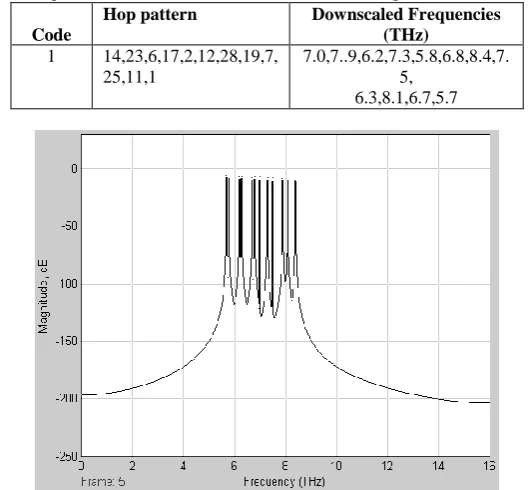
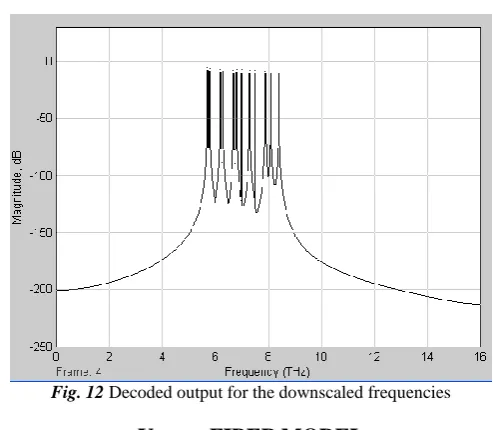
The spectrum of encoded and decoded outputs which consists of code sequences (λ14, λ23, λ6, λ 17 λ2, λ12, λ28, λ19,
λ7, λ25, λ11, λ1) for single user are shown in Figure.11 and Figure.12 respectively.
Tabel I: FREQUNCY ASSIGNMENT FOR THE CODE SEQUENCES OF USER ONE
Code
Hop pattern Downscaled Frequencies (THz)
1 14,23,6,17,2,12,28,19,7, 25,11,1
7.0,7..9,6.2,7.3,5.8,6.8,8.4,7. 5,
6.3,8.1,6.7,5.7
Fig. 12 Decoded output for the downscaled frequencies
V.
FIBER
MODEL
In this paper, we consider the Single mode fiber model (SMF)[6].Fiber allows digitized light signals to propagate for distances beyond 100 km spans with loss compensated by optical amplification. The fiber is assumed to be a low pass filter.
Fig. 13 Block diagram of the fiber model
The transfer function
H
f
of SMF can be expressed as,By taking the FFT of the input modulated signal in Simulink, then multiplying by
H
f
and finally taking the IFFT (inverse FFT), we can accurately represent fiber propagation with any additional chromatic dispersion, thus making themodel linear. For the standard SMF fiber model we use at
1550
nm
wavelength,km
L
1
with no optical amplifiers.VI.
OPTICAL
ORTHOGONAL
CODES
FOR
FFH-OCDMA
SYSTMS
High weight codes such as m-sequence codes, Walsh Hadamard codes are suitable for FFH-OCDMA scheme . In this work sub optimal code sequence is used. The
l
thchip pulse is modulated with frequency offsetf
l about the carrierfrequency
f
c.VII.
RECEIVER
MODEL
In order to detect the optical signal at the output of the fiber, FBG decoder and PIN photodiode are used in the receiver circuitry. The Simulink model for the receiver is given in the above figure. The value of the responsivity is assumed as 0.5 A/W.
Fig. 14 Simulink model of a receiver
The integrator is used to remove high frequency components. By setting the proper threshold levels, the RZ data is recovered at the output of the detector and converted to NRZ format. The following figure shows the transmitted data and the received data respectively for a single user.
Fig. 15 Transmitted data
Fig. 16 Received data
VIII.
RESULTS
In this project, Fiber Bragg grating based FFHOCDMA is combined with WDM and the performance is analyzed for 10-DWDM channels having unequal channel separations in order to reduce the crosstalk due to FWM effect. The individual users in the DWDM network are having their own optical orthogonal codes and the BER performance is carried out for 10 simultaneous users as shown in Figure.17.
Fig. 17 Performance of FBG/FFH-OCDMA system for 10 DWDM channels with unequal channel separations for 1km and 10km fiber
The BER performance analysis for the FBG based FFH OCDMA system is carried out by determining the Q factor from the eye diagram of the signal at the receiver output.
IX.
CONCLUSION
[2] G.P.Agarwal Fiber-optic Communication systems ,2 ed.N.Y.Academic Press,2002.
[3] Forgheri,R.W.Tackh,A.R.Chraplyvy,D.Marcuse, “Reduction of Four wave mixing Crosstalk in WDM systems using unequally spaced channels”.IEEE Photonics Technology letters Vol 6 No 6.June 1994.
[4] A.R. Chraplyvy, “Limitations on lightwave communications imposed by optical –fiber nonlinearities.”J. Lightwave Technol., vol. 8,pp.1548-1557.Oct. 1990
[5] Binh L.N., Gan I. and Tan W., „SIMULINK Model for Optically Amplified Transmission Systems: Part V‟, Linear and Nonlinear Fiber Propagation Models, Technical Report Monash University, M.E.- C.S.E March –2005.
[6] A.V.Ramprasad, M.Meenakshi, G.Geetha, R.Satheesh kumar “Suppression of Four Wave Mixing Crosstalk Components in DWDM Optical Systems”
[7] Rajiv Ramaswami and Kumar. N. Sivarajan, “Optical Networks”,pp.76-90, Morgan Kaufmann Publishers, Second Edition, 2004.
[8] Habib Fathallah, Leslie A. Rusch, Sophie LaRochelle, “ Passive Optical Fast Frequency-Hop CDMA Communication System”, Journal of Light wave Technology, Vol.17, No.3, March 1999.
[9] J. Salehi, V. K. Wei and F. R. K. Chung, “Optical Orthogonal Codes: Design, Analysis, and Applications”, IEEE Transactions on Information Theory, Vol. 35, no. 3, May 1989.