S.Afr.J .Libr.Inf.Sci., 1997,65(2) 85
Research project to determine the effect of free voluntary reading on comprehension
S.I.I. Olen* &
M.P. Machet
Department of Information Science, University of South Africa, P.O. Box 392, Pretoria, 0001 Republic of South Africa [email protected] &[email protected]
Received December 1996; accepted March 1997
The purpose of this research project was to determine the effect of free voluntary reading (FVR) by primary school pupils on their English second-language (ESL) comprehension. An experimental school was provided with a collection of specially selected books and a reading scheme. Then a FVR programme for ESL pupils in standards 2 to 5 was introduced. The control school continued to use only traditional methods of language teaching. Pupils in both schools were given reading comprehension tests at the start of the project and again eight months later. Different statistical tests were carried out on the data. It was found that standard 2, 3 and 4 pupils in the experimental school all made very good overall im-provement which was higher than that of the same standards in the control school. There was a significant difference in the improvement of the standard 2 and 4 pupils in the experimental school. Standard 5 pupils showed the least improvement in both schools. It appears that a FVR programme which is introduced early enough in the primary school does effect comprehension more than traditional language teaching methods, but because pupils had problems answering inferential questions, teacher mediation is also an important additional factor. Other findings and recommendations are discussed.
Die doel van hierdie navorsingsprojek was om die effek te bepaal van 'n vrywillige leesprogram op die begrip van laer-skoolleerlinge met Engels as tweedetaal. 'n Eksperimentele skool is voorsien van 'n versameling spesiaal uitgesoekte boeke en 'n leesskema. Daarna is 'n vrywillige leesprogram vir Engels-tweedetaalleerlinge in standerd 2 tot 5 ingebring. Die kontroleskool het voortgegaan om slegs tradisionele metodes van taalonderrig te gebruik. Leerlinge in beide skole het leesbegripstoetse gedoen aan die begin van die projek en weer agt maande later. Die data is aan verskeie statistiese toetse onderwerp. Daar is bevind dat standerds 2, 3 en 4 in die eksperimentele skool in al die toetse gesamentlik 'n goeie verbete-ring getoon het wat hoer was as die van leerlinge in die kontroleskool. Daar was 'n beduidende verskil in die verbetering van standerd 2- en standerd 4-leerlinge in die eksperimentele skool. Stapderd 5-1eerlinge in beide skole het die minste verbetering getoon. Dit kom voor asof die effek van 'n vrye keuse leesprogram wat vroeg genoeg in die laerskool in-gebring word leesbegrip meer bevorder as tradisionele taalonderrigmetodes, maar aangesien leerlinge probleme gehad het om afleibare vrae te beantwoord, is onderwyserbemiddeling ook 'n belangrike bykomende faktor. Ander bevindings en aanbevelings word bespreek.
*Author to whom correspondence should be addressed.
In 1995 the South African interim government announced
that South Africa would have 11 official languages, with English as the main language. The situation is that in many schools attended by African pupils mother-tongue instruction is given only during the first four years of schooling with English as the only medium of instruction from the fifth year (standard 3) on. Even though English appears fifth on the list of languages most spoken in this country (Zulu, Xhosa, Afrikaans and Tswana have more speakers), it is generally regarded as the language in which proficiency is required for academic and economic advancement. So when pupils enter school they have to master language, but specifically the English language.
Research (Cunningham &Stanovich 1991 :270;Elley 1989,
1991,1992; Elley & Mangubhai 1983; Krashen 1993)
sug-gests that one of the most successful and economic ways of achieving second-language acquisition and development is through free voluntary reading. In South African schools the teaching of reading has largely focussed on skills, strategies and the processes individual readers acquire and use as they interact with a piece of text. Emphasis is on decoding skills rather than deriving meaning from a piece of text or developing a love of reading. A reading programme based
only on skill acquisition can make reading meaningless, and
can prevent pupils from becoming proficient readers. Reading is more than an exact, sequential identification of sounds or words, it is a transaction between thought and language, and it is this transaction that leads to comprehension (Chang
&
Watson 1988:36). It is only when children realize that the written word contains meaning that it is possible for them to become readers (Vygotsky 1978:52-57).
School-based reading and language programmes provide little opportunity for pupils to read for pleasure or encounter real texts. In spite of teachers paying lip service to the importance of reading, middle to upper elementary school pupils spend little time at. home or school reading for pleasure.
86
abroad, but very little research in this field has been done in South Africa. The researchers thought it would be particularly
appropriate to do a research project of this nature at the
present time when the education system is being evaluated
and restructured. The aim of the research project was to
establish the effect of free voluntary reading of English books by pupils in primary school on their English second-language acquisition and comprehension.
Free voluntary reading
Theconcept/ree voluntary reading (FVR) is used by Krashen
(l993:x) to refer simply to 'reading because you want to'. As far as he is concerned FVR is one of the most powerful tools available in language education and is the most effective way
of achieving proficiency in a second language. Just as
spelling and vocabulary are developed in first languages by
reading, so too they are developed in second languages.
Furthermore, FVR is the most important determinant of
vocabulary development, writing and spelling competence
and the ability to comprehend and utilize advanced
grammatical structures. Other positive consequences of FVR
are that it provides much enjoyment, is an important source of
knowledge and aids one in defining one's paths in life
(Krashen 1995: 189).
The International Reading Association issued a statement
declaring that literature should be the foundation of the
language curriculum and that classroom teachers should be
presenting literature-based reading programmes. The belief is
that critical thinking skills are developed by considering real problems and issues and not by working through a series of
fragmented intellectual exercises (Harris &Baskin 1989:31).
The conscious learning of vocabulary and spelling involves
using mental faculties outside the language faculty, which
means that only a limited amount of language competence is
developed (Krashen 1989:454). Snow and Ninio (1986:121)
speak of a contract of literacy and say. that the rules of literacy cannot be taught.
'Reading and comprehending texts depend on many
tacit "contracts" and "metacontracts" between
liter-ate persons concerning the use of books and the
meaning of texts - contracts which have very little to do with the ability to decipher a written word' .
A study by Taylor, Frye and Maruyama (1990:360) revealed
that time spent reading in school contributed to growth in
students' reading achievement. However according to a study
by Fielding et al. (cited by Anderson, Wilson & Fielding
1985:77) reading from books occupies 1%, or less, of
children's free time. Simmons (1994: 18) maintains that
students are completing their schooling without being able to read and Harris and Baskin (1989:29) cite a National
Assess-ment of Educational Progress (NAEP) study which revealed
that less than 5% of 17-year-olds were functioning at the
highest of five possible levels of proficiency. During the last decade students had improved their performance with regard
to 'low level skills' like decoding, computing and
gram-matically correct writing but not with regard to advanced
S .Afr. Tydskr.Bibl.lnl igtingk., 1997,65(2)
tasks like analyzing, interpreting or assigning differential
meanings.
Project population
The research project was undertaken by a research team at the
beginning of 1995 and was completed in June 1996. It would
have been desirable to use a number of experimental and
control schools in both urban and rural areas, but because of the high costs which this would have involved and also as this
was really a pilot project it was decided to limit the scope of
the project to a control school and an experimental school in
an urban area. In the control school where the total number of pupils was 452 there were 319 ESL pupils. In the
experi-mental school the total number of ESL pupils was 220 out of a total of 1 004 pupils. As can be seen from Table I there were 139 pupils participating in the study in the experimental school and 105 pupils in the control school. These pupils were in standards 2, 3,4 and 5.
The children were all being taught in English even though this was not their home language. To ensure the validity of the
survey results it would have been desirable to have classes of equal size and with other variables as similar as possible, but
unfortunately this was not possible. For the children in the
experimental school it was their first year in an integrated
school, because previously they had attended schools in the
township which had been for African pupils only. Another
difference was that the classes in the control school were
smaller than those in the experimental school. There were two
classes per standard in the control school which is an English medium school. There was only one English medium class
per standard in the experimental school and all the pupils
participating in the experiment were in these classes. The
school is not a single medium school as there are also a large
number of Afrikaans-speaking children being taught through
the medium of Afrikaans. Conditions in the control school
appeared to be more favourable. However, the control school is in the inner city and on the whole these children are from
less advantageous socio-economic circumstances than those
from the experimental school where the children are bussed
in from a township. To obtain more information on the pupils' backgrounds and factors such as the parents' socio-economic
status, the availability of books, periodicals, newspapers, TV
et cetera in their homes would necessitate interviews with
parents and/or pupils (Machet &Olen 1997).
Table 1 Pupils participating in research experiment
Std 2 Std 3 Std 4 Std 5 Total
School N N N N N
Control school 27 24 26 28 105
Experimental school 39 40 36 24 139
S.AfrJ .Libr.Inf.Sci., 1997,65(2)
Research experiment
At the beginning of the experiment pupils in both control and
experimental schools were given reading tests to test their
comprehension. The tests had been specially developed for
ESL readers taking into account cultural variables (Bouwer 1991). The experiment ran for eight months and at the end of
this period their reading comprehension was tested again. To
allow for natural progression progress of the pupils in the
experimental school was measured against the control school which did not have free voluntary reading and had relied on
standard language-teaching methods only.
Motivation was an essential factor if the project was to
succeed because most of the children come from families that do not have a reading culture. In addition, the children are
required to read in a second language. The researchers
decided that the best way to motivate the children to read would be to run a competition and award book prizes and T-shirts to the five children in each class that read the most
books by the end of the' eight-month period; for the
re-searchers to periodically visit the school and read stories to
the pupils; and also to hold an interim competition with small prizes. There were no stipulations as to the level of the books
so that children who read at a lower level would not be
penalized. There was also no stipulation that the books had to come from the classroom collection and a pupil was free to read any book s/he liked as long as it was an English book.
The English teacher ensured that each child had actually read the books that s/he claimed to have read by providing a short form which the child had to complete after finishing each book. On the form the child had to give a brief summary
(one or two sentences) of the book and then indicate what
they particularly liked about the book.
Before starting the project a circular letter was sent to the parents of all the pupils in standards 2 to 5 (4th to 7th school
year) in the experimental school. This letter informed the
parents of the nature of the research project, explained the
purpose of the project and why the researchers and school
staff wanted to encourage reading. The assistance of the
parents was sought in motivating and encouraging their
children to read as much as possible during the year. Mention was also made of the prizes which would be presented at the end of the year to the pupils who had read the most books.
The schools had previously catered only for white pupils
so, although both the experimental and control schools had
school libraries, the books in these libraries had few
characters with which African ESL readers could identify.
Also they catered for children who were English
first-language speakers and did not have books that were suitable
for ESL readers. As the children participating in the project
were unlikely to have a strong motivation to read, it was
essential that the books be as accessible and attractive to these children as possible. It was therefore decided that a specially selected collection of books taking into account the children's
reading level, cultural background and interests, be provided
for these children. This collection was donated to the experi-mental school by READ (Read Educate and Develop, a
non-87
governmental organization working in the field of literacy
and teacher training). A similar collection was donated to the
control school after the project was completed. The
publish-ers, Shuter and Shooter, donated a reading scheme containing
cards with specially developed stories and questions to the
experimental school.
Three teachers in the experimental school worked with the
pupils. These pupils had eight periods per week for English of
which two were for reading, one for spelling, three for
grammar and two for oral work. During the reading periods
the teacher and pupils read aloud and discussed the stories. As
far as possible the teachers discussed the books with the
pupils that they had read at home, but obviously the size of
the classes and the limited time did not allow for much scope
in this regard. Pupils who had completed their written work
were allowed to either read books silently or the cards from
the reading scheme during the remainder of the period.
Obviously the fast workers were the ones who had the most
opportunity for silent reading in the classroom. However,
most of the pupils did have books which they took home to
read. Pupils in standards 3 and 4 were mostly shy to discuss
books with the teacher on an informal basis, but would do this
during the periods allocated for oral work when they were
given marks for their talks.
In standard 2 there were II periods scheduled for English
and so their teacher was able to spend two of the three
ad-ditional periods doing written work and the third period was
spent doing silent reading or reading poetry. Standard 2 pupils
enjoyed discussing books read at home and their teacher also used this as a theme for oral work.
The general consensus of the teachers was that the parents
were pleased with the interest their children had developed in
books and that they were satisfied that children were
spending some school time on the reading of books and
stories. All these teachers believe that reading is the most
important factor in second-language learning and
compre-hension, (one of the reasons that this school was selected to
be the experimental school), but a major problem experienced
is that the actual school time which could be spent on reading was very limited because the syllabus had to be followed.
Data collection
In each standard pupils answered four comprehension tests
(graded for the specific standard) which each had five
multiple-choice questions and five open questions which
required written responses. A pupil could score a possible 15
marks per test if all questions were correctly answered.
Therefore on four tests the maximum which a pupil could
score was 60 marks.
Pupils wrote the four tests in February/March of 1995 and
then wrote the same four tests eight months later at the
88 S .Afr. Tydskr.Bibl.Inligtingk .. 1997 .65(2)
Table 3 Overall difference in the mean scores obtained
between March and November
higher than in the control school. It should, however, be noted that for standard 3 there was considerable improvement in the mean score in both the experimental and the control schools.
T-tests
T-tests were conducted per standard to determine whether the
schools differed in terms of the differences for each of the
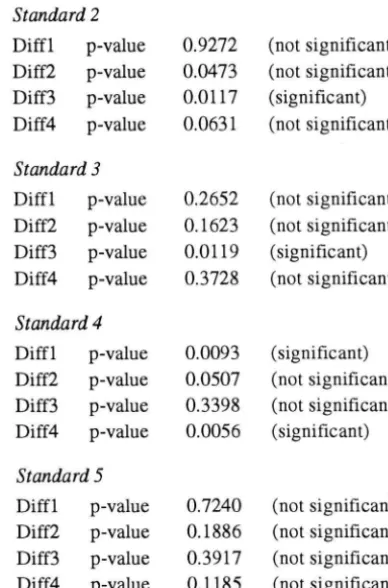
four tests. Because multiple t-tests were conducted a p-value
<
=0.0125 is considered significant (p-value of 0.05 must bedivided by 4 because there were 4 tests). The results of these Hests are given below:
Table 2 Numbers of pupils who improved and who did not
improve
Control Control Experimental Experimental
school school school school
Std N improve N not improve N improve N not improve
Std 2 19 (70%) 8 (30%) 35 (90%) 4 (10%)
Std 3 22 (92%) 2 (8%) 37 (92.5%) 3 (7.5%)
Std •• 17(65%) 9 (35%) 31 (86%) 5 (14%)
Std 5 18 (64%) 10 (36%) 19 (79%) 5 (21%)
5.25 2.82 Std 5
3.23
10.11 Std4
9.50 Std 3
14.65 5.78
Std 2
11.31
Mean score Mean score Mean score Mean score
Standard 2
Diffl p-value 0.9272 (not significant)
Diff2 p-value 0.0473 (not significant)
Diff3 p-value 0.0117 (significant)
Diff4 p-value 0.0631 (not significant)
Standard 3
Diffl p-value 0.2652 (not significant)
Diff2 p-value 0.1623 (not significant)
Diff3 p-value 0.0119 (significant)
Diff4 p-value 0.3728 (not significant)
Standard 4
Diffl p-value 0.0093 (significant)
Diff2 p-value 0.0507 (not significant)
Diff3 p-value 0.3398 (not significant)
Diff4 p-value 0.0056 (significant)
Standard 5
Diffl p-value 0.7240 (not significant)
Diff2 p-value 0.1886 (not significant)
Diff3 p-value 0.3917 (not significant)
Diff4 p-value 0.1185 (not significant)
Experimental school Control school School Data analysis
Tests were coded and several statistical analyses were carried
out to obtain different perspectives on the data available.
Schools were not comparable to start out with. This is
re-flected by the t-test (independent samples) with pupils from
the control and experimental school forming the two
in-dependent groups. It would have facilitated interpretation of
the results if the results obtained by pupils in both schools had been similar at the start of the project. Other variables may have played a role to 'hide' improvement: smaller classes in
control school, quality of teachers,
et cetera.
No backgroundvariables were available such as average for previous year, IQ and home language that could be incorporated in the analysis.
- All missing scores for questions were set to 0, reflecting
that the pupil did not answer those questions (correctly).
- For each pupil in each standard the following calculations
were made:
I. total scores for each test (totlma-tot4ma) in March
2. total scores for each test (totlno-tot4no) in November
3. total scores for all four tests (totma) in March 4. total scores for all four tests (totno) in November
A t-test: to determine if the average total scores differ
between the control and experimental school. (For each of the four tests for March as well as November and also for the overall score.)
5. difference between November and March scores (reflecting improvement or not)
that is diffl =totl no - totlma diff4 =tot4no - tot4ma
t-tests (ANOVA): do the schools differ in terms of the above differences of each of the four tests?
. multivariate analysis (MANOVA): given the differences
diffl ... diff4, is there a significant difference between the control and experimental schools?
- Based on differences a new variable was created (for each
test as well as the four tests combined):
If diffl >0 then 'improved'
If diffall <
=
then 'not improved'cross tabulations: do the schools differ in terms of
im-proved/not improved
- The programme was repeated for open questions
(questions 1, 2, 3,4 and 10 in each test) as well as for the
multiple-choice questions (questions 5, 6, 7, 8, 9 in each
test)
- Correspondence analysis: association between
improve-ment or not for all standards and both schools
After eight months schooling it is natural for pupils to make progress. From Table 2 it can be seen that most of the pupils in each standard improved, but the percentages of pupils in
the experimental school who improved were higher than the
percentages of pupils in the control school who improved. It was necessary, however, to determine whether there was
greater improvement overall in the experimental school than
in the control school. Table 3 shows that in both schools in all
standards there was an improvement in the mean scores
obtained overall for the four tests in November. It is also clear
S.AfrJ .Libr.Inf.Sci. ,1997,65(2) 89
90
Measures of association
Cramer's Y ranges from 0 to
+
1; the larger the value of Y, thegreater the association in the variables. Measures of
100
control
experimental
overa. test"
test3 lest 2
Figure 1 Improvement: Standard 2
80
The graphs in Figures I, 2, 3 and 4 show the improvement
of pupils in each school for each test and overall. Figure 1 shows the improvement for standard 2. For example, one sees that in standard 2 the pupils in the control school scored higher in Test 1 and slightly higher in Test 4, while the pupils
in the experimental school achieved higher scores in Tests 2
and 3 and a much higher overall improvement. Figure 2
shows that in standard 3 the experimental school scored much higher than the control school on Test 3. but the overall
difference was not very great. Figure 3 shows the scores on the four tests and overall for standard 4. In Figure 4 the scores on the four tests and overall for standard 5 can be seen.
'0
eft. 50
'''''''
"~
e .~ 70
i
Multivariate analysis (MANOVA)
MANOYA is a multivariate test to determine for each
standard: do the differences in the four tests (diffl ... diff4) differ overall? The dependent variables are
diffl
=
difference in test 1 results (totlno - totlma)diff2
=
difference in test 2 results (tot2no - tot2ma)diff3
=
difference in test 3 results (tot3no - tot3ma)diff4 difference in test 4 results (tot4no - tot4ma)
For standard 2 Wilks' Lambda
=
2.60481 with a p-value of0.0444 (a p-value
<
=
0.05 is considered significant).Overall there isa significant difference between control and
experimental schools in terms of the variables diffl, diff2,
diff3, diff4 (p-value =0.0444)
For standard 3 Wilks' Lambda
=
1.65784 with a p-value of0.1719.
Although there is a significant difference between the two
schools in terms of diff3 (third test) the two schools do not
differ overall (that is given the four tests diffl ... diff4).
For standard 4 Wilks' Lambda =3.8449 with a p-value of
0.0078.
Overall (that is given the four tests diffl ... diff4) there is a
significant difference between control and experimental
schools.
For standard 5 Wilks' Lambda
=
1.0235 with a p-value of0.4050.
Overall there isnot a significant difference between control
and experimental schools in terms of the four tests (that is
diffl ... diff4).
Figure 2 Improvement: Standard 3
Schools improved/not improved
Based on differences a new variable was created (for each test as well as the four tests combined):
- If diffl
>
0 then 'improved~- If diffall
<
=then 'not improved'Cross tabulations were made to determine whether the
variable diffall differs between the control and experimental
schools. Taking the variable diffall =(sum of totno - totma)
the following results were obtained:
For standard 2 - Diffall p-value of 0.0094
This indicates a significant difference between the two
schools in terms of improved/not improved (a p-value < =
0.05 is considered significant).
100
90
80
I
.~ 70
i
~ 60
Q. . ::J Q.
'0 'if. 50
testt. test 2
''''''.
CONTROL3 EXPERI3
overa_
90
For standard 3 - Diffall p-value of 0.0220
This indicates a significant difference between the two 80
schools in terms of improved/not improved.
70
Figure 3 Improvement: Standard 4
For standard 4 - Diffall p-value of 0.0008
This indicates a significant difference between the two
schools in terms of improved/not improved.
For standard
5 -
Diffall p-value of 0.1571This indicates no significant difference between the two
schools in terms of improved/not improved.
~
e
.~ 60
i
~ 50
Q.
::J
Q.
'0 'if. .0
test1 test2 test 3 .""'. overa.
CONTROL4
90
90
S.Afr. Tydskr.Bibl.Inligtingk., 1997,65(2)
Control:a C; Experimental:z: E:IMP'" Improved; NOT'" not improved
80
NOT.C std.
•
td2IMP-E
..
•
..
.-.--std3
•
sld5"~-C
•
70
1
.~ 60
j
~ 50
::l
C-'0
"if. 40
test 1 test 2 test 3 test4 overaU EXPERIS CONTROLS
,<
,3
,2
,1
,0 ',1 -,2 -,3
-,<
-,5
-1.5 -1,0 Dimension 1
Canonical normalization
-,5 0,0 ,5
•• COLUMN
• ROW 1,0
Figure 4 Improvement: Standard 5
association were made to determine whether the school had
an effect on the improvement made by the standard. The
results given below indicate a weak association between the
school and the overall improvement of standard 2 and
standard 4 pupils.
Cramer's V:
- for standard 2 diffall 0.247
- for standard 3 diffall 0.015
- for standard 4 diffall 0.245
- for standard 5 diffall 0.164
Open questions and multiple-choice questions
The data collected on scores for open questions (questions I, 2, 3, 4 and 10 in each test) as well as for the multiple-choice
questions (qu'estions 5, 6, 7, 8, 9 in each test) showed that there were no differences between overall results obtained for either type of questions. This was done to ensure that pupils
were not obtaining higher scores on either the one or the other type of questions.
Correspondence analysis: association between
im-provement or not for all standards and both schools
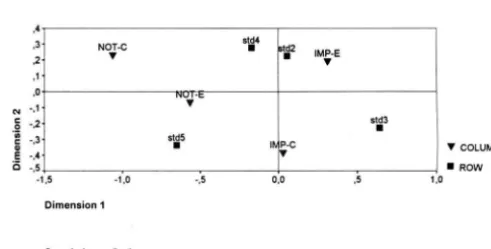
Correspondence analysis is a multivariate, descriptive method
for graphically displaying the rows and columns of a
categorical data matrix in a two dimensional space.
Cor-respondence analysis helps to show how variables are related,
not just that a relationship exists (Hernon 1994:198). In
Figure 5 the correspondence analysis is plotted. Improvement
is based on total improvement for all four tests. By projecting the points, standards (2, 3, 4, and 5) and categories (not
im-proved control school; improved control school; not
im-proved experimental school; and improved experimental
school) onto the horizontal axis, association is shown. Points which are close together are associated. If points are further apart there is less association. In Figure 5 it can be seen that
standard 5 is associated with 'not improved' in both control
and experimental schools. 'Improved' experimental school is
associated with standard 2 and standard 4 and to a certain
extent with standard 3. Standard 3 is also associated with
'improved' control school.
Figure 5 Correspondence analysis plot
Individual pupil scores
The scores obtained by pupils (identified by pupil number) in
the first set of tests (February/March) in each school and in
each standard were printed in rank order from top to lowest score. In the next column the scores obtained in the second
round of tests (November) were printed and in the last
column the difference between the second and first scores. The prize winners in each standard in the experimental school were checked against the results to determine whether there was any correlation between the pupils who read the most and the pupils whose scores improved the most.
All that could be deduced from the data obtained is that the pupils who read the most were either high scorers or made a good improvement, with the one exception in the standard 4 class. It is difficult to correlate the number of books read with individual improvement for a number of reasons. Firstly if a pupil scores high marks the first time then the scope for improvement is limited. Secondly the type of books read are also important. Pupils who read large numbers of books may
be concentrating on the easier, shorter books while pupils
who improved more are reading longer more challenging
books. A final point to bear in mind is that only the names and numbers of the five prize winners in each standard were kept, but many of the pupils who improved their marks substantial-ly may have also read large numbers of books.
Interpretation of the results
The duration of the project was limited to a period of eight
months - more follow-up tests would be required over a
longer period to obtain valid data. The fact that the results obtained by the pupils in the two schools differed at the outset
must also be taken into consideration. Nevertheless the
over-all gains made by the pupils in each standard in the experi-mental school were very good and there was a significant difference in the improvement of the standard 2 and 4 classes in the experimental school. For standards 2, 3 and 4 there was a significant difference between the two schools in terms of
the variable improved/not improved. The different tests
car-ried support one another and show that the pupils in the
experimental school did better than those in the control
school. Although one would expect all pupils to show some
S.AfrJ .Libr.Inf.Sci. ,1997 ,65(2)
without interviews and further research, to understand why
some did not improve and why a few actually scored less.
One explanation is that some pupils were guessing when it
came to multiple-choice questions.
The person responsible for developing the tests, suggests
that children need to have a critical level of skills before free voluntary reading will have an effect (Bouwer 1996). If the negative results are among the children of lower ability this could explain the apparent regression. Another factor is that the reading cards supplied by Shuter and Shooter provide reading and language support whereas the books from READ do not. Children who read more cards therefore might have
showed a greater improvement, but without careful
day-to-day monitoring of each pupil's reading it is not possible to
establish whether there was any correlation. Usually it is the more intelligent children who finish the written work first and these children had more opportunity to do additional reading during class time.
Younger children may be more easily motivated to do free voluntary reading and develop the reading habit - perhaps by standard 5 (or even standard 4) children may be less prepared to spend time on free voluntary reading (especially at home), because these habits have not been formed at an early age. This is probably why the pupils in standards 2 and 3 show the
greatest improvement in the mean scores obtained in
November.
Reading competitions and Readathons encourage children
to read a new book each time and do not encourage children to reread stories they have enjoyed or ensure understanding -in other words children will not necessarily hav~ sufficient
opportunity to internalize the structure of the story. Some
children may be reading a large number of books, but these may be all easy books and other pupils who do not read such large numbers of books may be reading longer more difficult ones.
It appears that pupils experienced fewer problems with the
literal questions than with inferential questions in the
comprehension tests. Other research has also established that
ESL pupils have experienced the greatest difficulty with
questions that required some inferences to be made (Pretorius 1995).
Recommendations
Larger numbers of pupils, at least 50 pupils per standard,
should participate so that more appropriate statistical tests can be made. Classes in both schools should not be significantly different at the outset of the project and it would be preferable if the project could be carried out over a longer period of time.
Letters were sent to parents at the start of the project rather
than requesting them to come to the school for a meeting.
Because of the distance they live from the school it was
anticipated that some of them may have had problems with
transport. However, it is probably better for researcher to
arrange a personal meeting with the parents and to obtain
their co-operation and support at the outset. It was difficult
91
for the researchers to control the project. Although the teach-ers were very co-operative and motivated there was definitely a need for a research assistant to visit the school on a regular basis to discuss pupils' reading with them as teachers do not have sufficient time for this activity. Full records of the differ-ent types of reading activities need to be kept as well as
monitoring what pupils read. It is possible that pupils who
made the most improvement read fewer, but more advanced
books, while those who won the competition were reading
many but easier works. ESL pupils' reading comprehension
cannot be expected to improve solely on the basis of
voluntary reading. Teachers will need to do shared and paired reading and spend more time mediating stories. They should ask questions which require pupils to predict events and
out-comes or make inferences so that they are better able to
understand causal relationships and narrative structures.
Teachers should also pay attention to the linking words which help to indicate relationships and cause and effect, words like
'because', 'however', 'therefore' and 'nevertheless'.
The materials donated by READ and Shuter and Shooter fulfilled the requirements of ESL pupils. However, there were only 2.4 books per pupil and one reading scheme which was used by two classes (standards 3 and 4). According to
Ver-meulen (1992: 115), who developed a quantitative model for
school libraries in South Africa, there should be 16.9 items
per pupil, with approximately 12 of these being books, in a
secondary school with 500+ pupils. No equivalent model has
been developed for primary schools in South Africa.
Informa-tion power (1988: 117-118), which provides guidelines for
primary schools in developed countries, indicates that libra-ries with high service in primary schools with fewer than 500 pupils have between 23 and 38 titles per pupil, while those with more than 500 pupils have between 15 and 27 book titles
per pupil. This means that primary schools with smaller
numbers of pupils actually need more book titles than those
with higher pupil enrolments. Likewise the guidelines for
Australian school libraries (Learning for the future 1993:23)
indicate 34 items per pupil for a school enrolment of 100
pupils, 24 for an enrolment of 400, 21 for 600 and so on. The statement is also made that no school, no matter how small, should have a stock of less than 1 000 items. These statistics give an indication of how completely inadequate the number
of books available for pupils in the experimental school was.
Also an appropriate reading scheme for each class is needed
because of the reading and language support provided on
each card. It is hoped that Shuter and Shooter will be able to develop a reading scheme for each standard.
In order for a free voluntary reading programme to be
successful the English teacher must accept the value of the programme and make time available, at least 10 to 15 minutes
per day, for free voluntary reading. This is especially
im-portant for those children who come from disadvantaged
92
support of the school principal and head of language teaching is also essential as time will need to be taken from language lessons for free voluntary reading and this may be difficult to
do without the principal's approval.
A free voluntary reading programme can be used whether reading is taught solely with children's literature or with basal
readers as the main source of reading instruction. The
voluntary reading programme may use books that children
have borrowed from the library, a classroom collection or
brought from home.
One of the greatest problems is that a research project of
this nature must be carried out within the established
educational system. Teachers are required to follow a definite syllabus and therefore time spent on reading activities are of necessity very limited. It is also difficult to involve teachers other than language teachers and ideally one would hope for reading activities to be integrated into all subject teaching. This is obviously also easier to achieve if there is a motivated
teacher-librarian in the school and if the education department
has a policy to encourage such activities.
Acknowledgement
The authors wish to acknowledge the assistance they received from Marie Kloppers in carrying out the research project.
References
Anderson, R.C., Wilson, PT. &Fielding, L.G. 1985.Becoming a narion of readers: rhe reporr ofrhe Commission on Reading. Washington, DC: National Institute of Education.
Bouwer, A.C. 1991. Content and reading levels for black pupils Std 2-5: guidelines for a reading development kit. Pretoria: Human Sciences Research Council. (Confidential unpublished report). Bouwer, A.C. 1996. Personal communication, Pretoria, June. Chang, Y.&Watson, 0 J. 1988. Adaptation of prediction strategies
and materials in a ChineselEnglish bilingual classroom. Reading reacher, 42( 1):36--44.
Cunningham, A.E. &Stanovich, K.E. 1991. Tracking the unique effects of print exposure in children: associations with vocabulary, general knowledge and spelling. Journal of educarional psychology, 83(2):264-274.
Elley, W.B. 1989. Vocabulary acquisition from listening to stories. Reading research quarterly, 24(2): 174-187.
Elley, W.B. 1991. Acquiring literacy in a second language: the effect of book-based programs. Language learning, 41(3):375-411. Elley, W.B. 1992. How in rhe world dDsrudenrs read?: lEA study of
reading lireracy. Hamburg: Griildeldruck GMBH.
S .Afr. Tydskr.Bibl. Inl igtingk., [997,65(2)
Elley, W.B.&Mangubhai, F. 1983. The impact of reading on second language learning. Reading research quarrerly, 19(1 ):53-67. Harris, K.&Baskin, B. 1989. Toward a culturally literate society.
School library journal, 35( 12):29-32.
Hernon, P. 1994.Srarisrics: a componenr ofrhe research process. Revised edition. Norwood, NJ.: Ablex.
Informarion power: guidelines for school library media programs. 1988. Chicago: American Association of School Librarians and Association for Educational Communications and Technology. Krashen, S. 1989. We acquire vocabulary and spelling by reading: additional evidence for the input hypothesis. Modern language journal, 73(4):440--464.
Krashen, S.D. 1993.The power of reading: ins ighrs from rhe research. Englewood: Librarie~ Unlimited.
Krashen, S.D. 1995. The reading hypothesis, the expanded reading hypothesis and the greatly expanded reading hypothesis. School library media quarterly, 23(3): 187-193.
Learning for rhejitture: developing information services in Ausrralian schools. 1993. Carlton, Vic.: Curriculum Corporation, Australian School Library Association and Australian Library and Information Association.
Machet, M.P.&Olen, S.1.1. 1997. Literacy environment of pupils in urban primary schools. Sourh African journal ofIibrary and information science, 65(2):77-84
Olen, S.I.I, Machet, M.P.&Kloppers, M. 1996. The effect of free voluntary reading by primary school pupils on their English second language. Pretoria: Centre for Library and Information Science, University of South Africa. (Unpublished report). Pretorius, EJ. 1995. Reading between the lines: causal connectivity,
inferences and implicitness in texts. Sourh African journal of linguisrics, suppl. 26:3-24.
Simmons, D. 1994. It takes more than a book talk: prereading strategies. Emergency librarian, 21 (5): 18-29.
Snow, C.E. &Ninio, A. 1986. The contracts of literacy: what children learn from learning to read books, inEmergenr literacy: wriring and reading. ed. W.H. Teale, E. Sulzby. Norwood, NJ: Ablex: 116-138.
Taylor, B.M., Frye, BJ. &Maruyama, G.M. 1990. Time spent reading and reading growth. American educational research journal, 27(2):351-362.
Vermeulen, W.M. 1992. Quantitative standards for school libraries in South African secondary schools. South African journal of library and informarion science, 60(2): 114-120.