3590
Big Data Classification Based On Forest Deep
Neural Network
Amsaveni M, Duraisamy S
Abstract: Big data analytics is the practice of analyzing vast quantities of data i.e., big data. The main intention of big data analytics is to discover new patterns which might be invisible and create new perspectives about the data. Data mining processes such as attribute reduction, clustering, and classification are widely used to find the hidden patterns in the big data. Parallel Rough set Theory-based Attribute Reduction (PRT-AR) method was proposed for big data attribute reduction by using rough set theory in MapReduce framework. Then, similar data were grouped by using Parallel Semi-supervised Multi-Imperialist Competitive Algorithm (PSMICA) which partitioned the big data. Finally, Random Forest (RF) was used to classify the big data. However, RF-based big data classification is not more efficient for imbalanced big data. So in this paper, Ensembling Random Forest (ERF) is proposed for big data classification to handle the imbalance problem in big data. It also improves the performance of RF classifier. In ERF, the clustered big data is split into a number of parts and then each part is sampled by the bootstrapping method. Then, the RF classifier is applied in each part of the data and its classification results are combined through the majority voting strategy. By sampling the data, the class imbalance problem in big data is reduced and it also improves the performance of big data classification. Moreover, Forest Deep Neural Network (FDNN) is proposed to improve the big data classification accuracy. In FDNN, ERF and Deep Neural Network (DNN) are combined for big data classification. The ERF is called as forest which detects the features in big data. The DNN is used to learn and classify the big data. By combining ERF and DNN, the classification accuracy of FDNN is improved.
Index Terms: Big data, Big data analytics, Big data classification, Deep Neural Network, Ensembling Random Forest, Forest Deep Neural Network, Random Forest.
—————————— ——————————
1.
INTRODUCTION
REVOLUTION in technological and scientific component has affected the size of data which increased on daily basis with an aim to improve profitable activities. As business and technology go hand-in-hand, their increasing dependence ensures that the data will continue to enlarge at a faster rate. Generally, big data [1] is defined as the amount of data that exceeds the capabilities of a given system to process the data in terms of time and memory consumption. Nowadays, big data is attracting much attention in a wide variety of fields such as financial business, social media, healthcare and network applications etc. This is because of gradually developing acquisition of a huge volume of data which becomes easily accessible and due to the availability of distributed platforms. With these facilities, new opportunities to discover new values from massive datasets can be sought, helping to gain an in-depth understanding of the hidden values in the data. In other words, it is the most important to efficiently learn from large scale in all kinds of real applications, such as attribute reduction, clustering and classification. The attribute reduction can minimize dimension of the data, unnecessary storage and irrelevant input. It significantly improves the efficiency of data processing. Clustering is the process of partitioning data objects into number of clusters based on the data similarity. The main advantage of clustering over classification is that, it is adaptable to changes and helps single out useful features that distinguish different clusters. Classification techniques [2,3] such as decision trees, Support Vector Machine (SVM), Naïve Bayes, neural network, and k nearest neighbors (kNN) over big data provide required data to the users from large datasets more simple way.
Parallel Rough set Theory based Attribute Reduction (PRT-AR) [4] was proposed for attribute reduction that reduces the attributes of big data using rough set theory in MapReduce framework. Then, the reduced data were processed by Parallel Semi-supervised Multi-Imperialist Competitive Algorithm (PSMICA) [5] to cluster the big data based on Multi-Imperialist Competitive Algorithm (MICA). The clustered data was classified by using Random Forest (RF) classifier. In this paper, the big data classification based on RF is improved by proposing Ensembling Random Forest (ERF) classifier. In ERF, bootstrapping is applied on the clustered big data which generates many sample datasets by repeatedly sampling from the existing data. Then the random forest is applied on the sampled data at several times to classify the data. Finally, majority voting is conducted to choose the best classification result. In order to improve the classification accuracy of big data, Forest Deep Neural Network (FDNN) is proposed which combines Deep Neural Network (DNN) architecture with RF classifier. The FDNN consists of two parts are forest (ERF) part and DNN part. The forest part acts as a feature detector which learns sparse representations from raw big data and the DNN part acts as a learned for big data classification. By combing the DNN with RF, the big data classification accuracy is improved.
2
RELATED
WORKS
Detailed López et al. [6] proposed a cost-sensitive linguistic fuzzy rule-based classification system under MapReduce framework for imbalanced big data classification. It was capable to deal with the uncertainty of data that was introduced in huge volumes of data. Moreover, this system doesn’t adjust the learning in the underrepresented class. It utilized a MapReduce framework to distribute the computational operations of the fuzzy model during it included cost sensitive learning design in its design to address the imbalance problem in the big data. However, the performance of this system is depends on the number of mappers in the MapReduce framework. Xin et al. [7] proposed an Elastic Extreme Learning Machine (E2LM) to classify big data based on MapReduce framework. E2LM handled the weak learning ————————————————
Amsaveni M is currently working as an Assistant Professor at AVP College of Arts and Science College, Tirupur Department of Computer Science. E-mail: [email protected]
Duraisamy S is currently working as an Associate Professor at PG &
Research Department of Computer Science, Chikkanna
3591 ability problem of ELM based big data classification. An
intermediate matrix multiplication of the updated training data subset was computed and it was updated by modifying the old matrix multiplications with intermediate ones. The corresponding new output weight vector along with centralized computing was obtained by using updated matrix multiplications. Hence, the efficient learning of rapidly updated massive training dataset was realized effectively. When the training data update ration increases, the running time of E2LM gets increased. Deng et al [8] proposed efficient k Nearest Neighbor (kNN) algorithm for big data classification. Initially, K-means clustering was applied in the big data to group the similar type of data as clusters. It separated the whole dataset into number of parts, each of which was then conducted kNN classification. It classified the clustered big data based k closest training examples in the feature space. However, it is not more suitable for big data. Chen et al. [9] proposed a MapReduce-Extreme Learning Machine (MR-ELM) method for big data classification. It was designed for real-world cloud environment where the huge volume of sample blocks were situated in different nodes of hadoop cluster and these were accessed by hadoop file system. With the aid of MR framework, training was moved to hadoop nodes which contributed to high parallelism and cost few I/O. The ELM sub models were trained parallel with the distributed data blocks on the cluster and integrated as a complete single hidden layer feed forward neural network. It returned the result of big data classification. However, optimization method will; be used for hidden node combination to achieve the highest generalization performance. Dagdia [10] proposed a scalable and distributed dendritic cell algorithm to classify the big data effectively. A bio-inspired algorithm i.e., dendtritic cell algorithm was improved by using it in MapReduce framework. The scalable and distributed dendritic cell algorithm was easily handled the high dimensional datasets it appeared mandatory to store all the data in a distributed environment and ensured the computation in a parallel way. Based on this assumption, the whole process of dendritic cell algorithm was partitioned into simple tasks and then subjected the intermediate results to finally obtain the better classification result which was the classes of the antigens. But, this algorithm was sensitive to the input class data order. Elkano et al. [11] proposed a new fuzzy rule based classification system named as CHI-BD for big data classification problems. A MapReduce framework was used in this system where a number of were used to used to execute the big data classification. A new rule for each input data was created that allowed one to make use of the full potential of MapReduce. Based on this, the learning process was split into different stages to distribute both the rule generation process and the computation of rule weights. But, the increase in the data size has a linear effect on the execution time of CHI-BD. Chen et al. [12] proposed a clustering based classification framework called K-means Bayes algorithm for big data classification. In K-means Bayes algorithm, K-means method was utilized to minimize the degree of imbalance without losing any information. The main intention of this method was clustering the majority into sub-classes, it helped minority to define the boundary. Finally, a MapReduce approach was introduced to implement the K-means Bayes algorithm for fault classification in the big data case. But, the k value of K-means Bayes algorithm greatly influences the classification accuracy.
3 MATERIALS
AND
METHODS
In this section, the proposed ERF and FDNN for big data classification are described in detail. Initially, the input big data is split into blocks which are loaded in the Mappers of MapReduce framework. Then, the dimensionality of the data in each mapper is reduced by applying the PRT-AR method. The reduced data are clustered by using PSMICA. Then the ERF and FDNN methods are processed for big data classification. The classification results of each mapper are combined in merge phase of MapReduce to get the final classification result.
3.1 Ensemble Random Forest based Big Data Classification
Detailed ERF is a machine learning technique where initially the big data is split into 𝑚 parts and then a set of training sets is generated by randomly sample with replacement of size 𝑁 (bootstrap) from the original training set. This process is repeated 𝐵 times to get 𝐵 bootstrap dataset. Then, for each new training set, a tree is constructed with random selection of features at each node of the tree. The node represents the features of big data. To build a tree, ERF first creates a root node containing bootstrap sample of the individuals. At each node, the ERF algorithm selects random subset of data to search over and subsequently determines the best split data based on a splitting criterion. Generally, a splitting criterion maximizes some measure of node purity, which means the degree to which individuals of a node belong to one class. Here, Gini index is used as a splitting criterion to choose the best split at each node. The Gini index measures how well a potential split of a node is in separating the individuals into two known classes. The Gini index at node 𝑛 is defined as follows: 𝐺𝑖𝑛𝑖(𝑛) = ∑ 𝑝̂ (1 − 𝑝̂ ) (1)
In Equation (1), 𝑝̂ = is the proportion of individuals that are of class 𝑐 at node 𝑛. The Gini index is minimized when all individuals in the node are of the same class, increasing as the individuals in the node are spread more evenly among different classes. The gain for splitting the node 𝑛 based on data 𝑥, 𝐺𝑎𝑖𝑛(𝑥, 𝑛) is defined as the difference between the impurity at node 𝑛 and the weighted average of impurities at each child node of 𝑛. The gain to split the node 𝑛 based on data 𝑥 is given as follows:
𝐺𝑎𝑖𝑛(𝑥, 𝑛) = 𝐺𝑖𝑛𝑖(𝑥, 𝑛) − 𝑤 𝐺𝑖𝑛𝑖(𝑥, 𝑛 ) − 𝑤 𝐺𝑖𝑛𝑖(𝑥, 𝑛 ) (2) In Equation (2), 𝑛 and 𝑛 are the right and left child nodes of the parent node 𝑛, respectively. 𝑤 and 𝑤 are the proportion of individuals assigned to the right and left child nodes. According to the gain value, the data 𝑥 with the lowest impurity is chosen to split individuals at node 𝑛. This process is continued until unpruned tree is formed. After the generation of tree for 𝑚 parts of big data, the classification result is obtained by aggregating the results of all trees of 𝑚 parts, with majority voting strategy.
The combination of PRT-AR, PSMICA and ERF based big data classification is named as PPERF.
PPERF based Big data classification Algorithm
Input: Training data 𝐷 = (𝑥 , 𝑦 ), (𝑥 , 𝑦), … (𝑥 , 𝑦 ), features 𝑓, 𝑛𝑢𝑚 , 𝑛
Output: 𝐶̂(𝑥) 1. begin
3592
4. for 𝑚𝑎𝑝𝑝𝑒𝑟𝑠 = 1: do
5. Reduce the attributes using PRT-AR method
5. Cluster the data in the mappers using PSMICA algorithm
6. Split the data 𝐷 in mappers into 𝑚 parts 7. for each data part in mappers do 8. for 𝑏 = 1: 𝑛𝑢𝑚 do
9. Draw a bootstrap sample of size 𝑁 from the training data 𝐷.
10. Built a tree 𝑇 using the bootstrapped sample 𝐿 by recursively repeating the following steps for each terminal node 𝑘 of the tree 𝑇 , until the minimum node size 𝑛 .
11. begin
12. Choose features at random from 𝐹
features
13. Find the best split 𝑆 among all possible splits for each of the sampled 𝑗th part (𝑗 = (1,2, … 𝑚))of the big data, based on the value of 𝐺𝑎𝑖𝑛 (𝑆, 𝑛) calculated using Equation (2), for each possible split 𝑠, where 𝑆 is the split with lowest impurity. 14. Choose the best split 𝑆 , among the best splits 𝑆, on which to split the node 𝑛.
15. Split the data on node 𝑛 by partitioning the individuals.
16. end
17. end for
18. end for
19. Get a random forest 𝑅𝐹 = *𝑇+ composed of 𝑛𝑢𝑚
20. Assume 𝐶̂(𝑥) is the class prediction of the 𝑏th random forest tree. Then
𝐶̂(𝑥) = 𝑚𝑎𝑗𝑜𝑟𝑖𝑡𝑦 𝑣𝑜𝑡𝑒{𝐶̂ (𝑥)} 21. end for
22. Combine the mapper result 𝐶̂(𝑥) in merger phase 23. end
The PPERF algorithm classified the big data effectively by using efficient attribute reduction, clustering and classification techniques in MapReduce framework.
3.2 Forest Deep Neural Network based Big Data Classification To improve the big data classification accuracy, FDNN is proposed for big data classification. FDNN is the combination of forest (ERF) and DNN parts where the forest part act as a feature descriptor and the DNN act as a learner. In the forest part of FDNN, forest is created using RF and it act as feature descriptor. In FDNN, a forest 𝐸𝑅𝐹 is a collection of decision trees which is denoted as,
𝐸𝑅𝐹(𝛩) = *𝒯(𝛩)+, 𝑡 = 1,2, … 𝑛𝑢𝑚
(3)
In Equation (3), 𝑛𝑢𝑚 denotes the total number of trees in
the forest, 𝛩 = *𝛩 , 𝛩, … 𝛩+ denotes the parameters in 𝐸𝑅𝐹. In 𝐸𝑅𝐹, 𝛩 has the splitting variables of big data and their splitting values. In the feature detection process, 𝐸𝑅𝐹 is fitted by the training data 𝐷 = (𝑥 , 𝑦), (𝑥 , 𝑦 ), … (𝑥 , 𝑦 ), where 𝑥 is the input data matrix with 𝑛 samples and 𝑓 features and 𝑦 is the outcome vector has classification labels. The classification of any data 𝑥 can be obtained from each tree 𝐸𝑅𝐹 through the fitted forest. It is expressed as follows:
𝑓(𝑥; 𝛩) = (𝑇(𝑥; 𝛩), 𝑇(𝑥; 𝛩 ), … 𝑇 (𝑥; 𝛩 )) (4)
In Equation (4), 𝑇 (𝑥; 𝛩 ) = 𝑦̂ is the binary
classification of data 𝑥 given by 𝒯 .
𝑓(𝑥; 𝛩) summarizing the signal detected from the forest and afterwards servers as the new input features to be given as
input to the DNN. The DNN consists of 𝑙 hidden layers which are described as follows:
𝐶𝑙𝑎𝑠𝑠(𝑦|𝐹, 𝜓) = 𝑔(𝑍 𝑊 + 𝑏 )
(5)
𝑍 = 𝜎(𝑍𝑊 + 𝑏)
(6)
𝑍 = 𝜎(𝑍 𝑊 + 𝑏 )
(7)
𝑍 = 𝜎(𝐹𝑊 + 𝑏 )
(8)
where, 𝐹 = (𝑓, … 𝑓 ) represents the forest matrix with 𝑛 samples and 𝑛𝑢𝑚 tree predictions, 𝑓 = 𝑓(𝑥; 𝛩), 𝑦 is the
class label, 𝜓 represents all the parameters in the DNN model, 𝑍 and 𝑍 , 𝑘 = 1,2, … 𝑙 − 1 are hidden neurons with
corresponding weight matrices 𝑊 , 𝑊 and bias vector 𝑏 ,
𝑏 . 𝜎(. ) is the activation function.
The dimension of 𝑍 and 𝑊 depend on the number of hidden neurons and , 𝑘 = 1,2, … 𝑙, as well as the number of
classes and the input dimension 𝑅. A softmax function
𝑔(. ) is used in the DNN which converts the values of the output layer into probability classification which is given as follows:
𝐶 = 𝑔(𝜇 ) =
(9)
In Equation (9),
𝐶 ≔ 𝐶𝑙𝑎𝑠𝑠(𝑦 = 1|𝑓) (10)
𝜇 ≔ [𝑧( )] 𝑤( )+ 𝑏( )
(11)
𝜇 ≔ [𝑧( )] 𝑤( )+ 𝑏( )
(12)
where, 𝑖 = 1,2, … 𝑛.
The weight and bias values in DNN model is trained using Stochastic Gradient Decent (SGD) [13] by minimizing the following the cross-entropy los function,
𝐿(𝜓) = ∑ {𝑦 𝑙𝑜𝑔(𝐶̂) + (1 − 𝑦) log(1 − 𝐶̂)}
(13)
In Equation (13), 𝐶̂ is the fitted value of 𝐶.
The combination of PRT-AR, PSMICA and FDNN based big data classification is named as PPFDNN.
PPFDNN based Big data classification
Input: Training data 𝐷 = (𝑥 , 𝑦 ), (𝑥 , 𝑦 ), … (𝑥 , 𝑦 ) Output: Class 𝐶
1. begin
2. Split the 𝐷 into blocks as 𝐷, 𝐷 , … 𝐷 3. Load the data 𝐷, 𝐷 , … 𝐷 in mappers
4. for 𝑚𝑎𝑝𝑝𝑒𝑟𝑠 = 1: do
5. Reduce the attributes using PRT-AR method
5. Cluster the data in the mappers using PSMICA algorithm
6. Split the data 𝐷 in mappers into 𝑚 parts 7. for each data part in mappers do
8. Apply forest on each part of data and get the new feature representation.
9. Select the best feature
representation by majority voting
10. end for
3593 using Equation (13).
14. end for
15. Combine the results of each mapper at the merger of MapReduce to get the final big data classification result 𝐶. 16. end
4 RESULT
AND
DISCUSSION
The performance of proposed big data classification based on PPERF and PPFDNN is analyzed and compared with PRT-PSMICA-RF in terms of accuracy, precision, recall and computation time. Amazon customer review dataset, REUTERS-21578 text dataset and International Cancer Genome Consortium (ICGC) on AWS datasets [4] are used to test the effectiveness of PPERF, PPFDNN and PRT-PSMICA-RF.
4.1 Accuracy
Generally, the accuracy metric measure the ratio of correct classification over the total number of instances evaluated. Accuracy is expressed as,
𝐴𝑐𝑐𝑢𝑟𝑎𝑐𝑦 = ( ) ( ) ( ) ( ) (14)
where, TP is the actual positive data which are exactly classified as positives, TN is the actual negative data which are classified exactly as negatives, FP is known negative data which are wrongly classified as positives and FP is known positive data which are wrongly classified as negatives. Fig.1 shows the accuracy of PPERF, PPFDNN and PRT-PSMICA-RF on three different datasets. The accuracy of PPFDNN is 6.71% greater than PRT-PSMICA-RF and 2.36% greater than PPERF based big data classification in ICGC on AWS dataset. From this analysis and from Fig.1, it is proved that the proposed PPFDNN has high accuracy than PPERF and PRT-PSMICA-RF based big data classification for three datasets.
4.2 Precision
Precision is used to measure the positive patterns that are correctly classified from the total classified patterns in a positive class. It is calculated as,
𝑃𝑟𝑒𝑐𝑖𝑠𝑖𝑜𝑛 =
(15)
Fig.2 shows the precision of PPERF, PPFDNN and PRT-PSMICA-RF on three different datasets. The precision of PPFDNN is 7.76% greater than PRT-PSMICA-RF and 2.92% greater than PPERF based big data classification in ICGC on AWS dataset. From this analysis and from Fig.2, it is proved that the proposed PPFDNN has high precision than PPERF and PRT-PSMICA-RF based big data classification for three datasets.
4.3 Recall
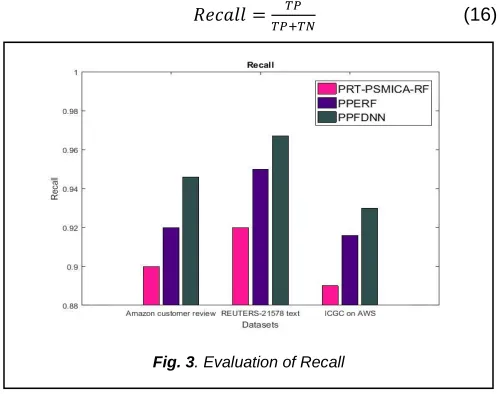
Recall is used to measure the fraction of positive patterns that are correctly classified. It is computed as,
𝑅𝑒𝑐𝑎𝑙𝑙 = (16)
Fig.3 shows the recall of PPERF, PPFDNN and PRT-PSMICA-RF on three different datasets. The recall of PPFDNN is 4.49% greater than PRT-PSMICA-RF and 1.53% greater than PPERF based big data classification in ICGC on AWS dataset. From this analysis and from Fig.3, it is proved that the proposed PPFDNN has high recall than PPERF and PRT-PSMICA-RF based big data classification for three datasets.
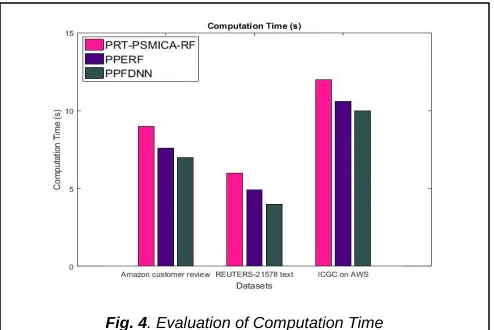
4.4 Computation Time
Computation time is the amount of time taken to classify the big data using PPERF and PPFDNN is analyzed and compared with PRT-PSMICA-RF.
Fig. 1. Evaluation of Accuracy.
Fig. 2. Evaluation of Precision
3594 Fig.4 shows the computation time of PPERF, PPFDNN and
PRT-PSMICA-RF on three different datasets. The computation time of PPFDNN is 16.67% less than PRT-PSMICA-RF and 5.66% less than PPERF based big data classification in ICGC on AWS dataset. From this analysis and from Figure 4.4, it is proved that the proposed PPFDNN has less computation time than PPERF and PRT-PSMICA-RF based big data classification for three datasets.
5 CONCLUSION
In this paper, ERF and FDNN are proposed for efficient big data classification. In ERF, the class imbalance problem in big data is handled by using bootstrapping process. In FDNN, ERF and DNN are combined together to classify the big data with high classification accuracy. Both ERF and FDNN are processed in MapReduce framework which reduces the computation time for big data classification. The experimental results prove that the proposed PPFDNN based big data classification has better accuracy, precision, recall and computation time than other big data classification methods for Amazon customer review dataset, REUTERS-21578 text dataset and International Cancer Genome Consortium (ICGC) on AWS datasets.
REFERENCES
[1] B.S. Gandhi and L. A. Deshpande, “The survey on approaches to efficient clustering and classification analysis of big data,” Int. Conf. Comput. Commun. Control
autom. (ICCUBEA), pp. 1-4, 2016, doi:
10.1109/ICCUBEA.2016.7859993.
[2] P. Koturwar, S. Girase, and D. Mukhopadhyay, “A survey of classification techniques in the area of big data,” arXiv preprint arXiv:1503.07477, vol. 1, no. 11, pp. 1-7, 2015. [3] N. Khan, M.S. Husain, and M.R. Beg, “Big Data
classification using evolutionary techniques: a survey,” Proc. IEEE Int. Conf. Eng. Technol. (ICETECH), pp. 234-247, 2015.
[4] M. Amsaveni and S. Duraisamy, “A Parallel Rough Set Theory for Nonlinear Dimension-Reduction in Big Data Analysis,” Int. J. Intell. Eng. Syst. (IJIES), vol. 12, no. 5, pp. 170-178, 2019, doi:10.22266/ijies2019.1031.17. [5] M. Amsaveni and S. Duraisamy, “Parallel semi-supervised
big data clustering based on Mapreduce technology,” Int. J. Recent Technol. Eng., vol. 8, no. 4. submitted for publication.
[6] V. López, S. del Río, J.M. Benítez, and F. Herrera,
“Cost-sensitive linguistic fuzzy rule based classification systems under the MapReduce framework for imbalanced big data,” Fuzzy Sets Syst., vol. 258, pp. 5-38, 2015, doi:10.1016/j.fss.2014.01.015.
[7] J. Xin, Z. Wang, L. Qu, and G. Wang, “Elastic extreme learning machine for big data classification,” Neurocomputing, vol. 149, pp. 464-471, 2015, doi:10.1016/j.neucom.2013.09.075.
[8] Z. Deng, X. Zhu, D. Cheng, M. Zong, and S. Zhang, “Efficient kNN classification algorithm for big data,” Neurocomputing, vol. 195, pp. 143-148, 2016, doi:10.1016/j.neucom.2015.08.112.
[9] J. Chen, H. Chen, X. Wan, and G. Zheng, “MR-ELM: a MapReduce-based framework for large-scale ELM training in big data era,” Neural Comput. Appl., vol. 27, no. 1, pp. 101-110, 2016, doi:10.1007/s00521-014-1559-3. [10]Z.C. Dagdia, “A scalable and distributd dendritic cell
algorithm for big data classification,” Swarm Evolut. Comput., vol. 50, 2018, doi:10.1016/j.swevo.2018.08.009. [11]M. Elkano, M. Galar, J. Sanz, and H. Bustince, “CHI-BD: A fuzzy rule-based classification system for Big Data classification problems,” Fuzzy Sets Syst., vol. 348, pp. 75-101, 2018, doi:10.1016/j.fss.2017.07.003.
[12]G. Chen, Y. Liu, and Z. Ge, “K-means Bayes algorithm for imbalanced fault classification and big data application,” J. Process Control, vol. 81, pp. 54-64, 2019, doi:10.1016/j.jprocont.2019.06.011.
[13]M. Zhu, M. Rhu, J. Clemons, S.W. Keckler, and Y. Xie, “Training Long Short-Term Memory with Sparsified Stochastic Gradient Descent,” ICLR Conf., 2017.