Patient Preference and Adherence
Dove
press
O r i g i n A l r e s e A r c h
open access to scientific and medical research
Open Access Full Text Article
reduction of exercise capacity in sarcoidosis in
relation to disease severity
Anastasios Kallianos1
Paul Zarogoulidis2
Fotini Ampatzoglou2
georgia Trakada2,3
elias gialafos4
georgia Pitsiou2
Athanasia Pataka2
lemonia Veletza2
Konstantinos Zarogoulidis2
Wolfgang hohenforst-schmidt5
Dimitris Petridis6
ioannis Kioumis2
Aggeliki rapti1
12nd Pulmonary Department, sotiria chest Diseases hospital, Athens, 2Pulmonary Department-Oncology Unit, “g Papanikolaou” general hospital, Aristotle University of Thessaloniki, Thessaloniki, 3Pulmonary laboratory, Therapeutic clinic Alexandra hospital, University of Athens, Athens, 4heart Diseases Department Aiginitio hospital, University of Athens, Athens, greece; 5Medical clinic i, “Fuerth” hospital, University of erlangen, Fuerth, germany; 6Department of Food Technology, school of Food Technology and nutrition, Alexander Technological educational institute, Thessaloniki, greece
Introduction: Pulmonary function tests (PFTs) do not always predict functional limitations during exercise in sarcoidosis. Cardiopulmonary exercise testing (CPET) may facilitate the recognition of exercise intolerance in these patients.
Aim: As relevant data in sarcoid patients are limited, the aim of the study reported here was to assess exercise capacity impairment during a maximal CPET and to evaluate potential cor-relations with PFT measurements and radiological stages of the disease.
Method: A total of 83 sarcoid patients consecutively referred for evaluation of exertional dyspnea over a 3-year period were studied retrospectively with PFTs, including spirometry, diffusing capacity of the lung for carbon monoxide (DLCO) and lung volumes, and CPET using standard protocol. Patients were grouped according to their radiological stages: Stage I (n=43), Stages II–III (n=31), and Stage IV (n=9).
Results: Forced expiratory volume in 1 second, forced vital capacity, and total lung capacity were mildly impaired only in Stage IV (means ± standard deviation: 72.44±28.00, 71.33±26.70, and 59.78±21.72, respectively), while DLCO was mildly and moderately reduced in Stages II–III and IV (72.68±14.13 and 51.22±18.50, respectively) and differed significantly between all stages (I vs II–III: P=0.003, I vs IV: P=0.003, and II–III vs IV: P=0.009). Exercise capacity (as expressed by peak oxygen consumption ,84% predicted) was decreased in 53% of patients (Stage I: 48%, Stages II–III: 52%, Stage IV: 78%); however, significant differences were noticed only between Stages I and IV (P=0.0025). Of note, significant correlations were found between peak oxygen consumption and DLCO (P=0.0083), minute ventilation (P,0.0001), oxygen pulse (P,0.0001), lactate threshold (P,0.0001), and peak ventilatory threshold (P,0.0001). Conclusion: CPET could be considered a useful tool in exercise intolerance evaluation in sar-coid patients with mild PFT abnormalities. Exercise limitation in sarsar-coidosis may be attributed to both ventilatory and cardiocirculatory impairment.
Keywords: cardiopulmonary exercise testing, pulmonary function tests, exercise
Introduction
Sarcoidosis is a heterogeneous multisystem granulomatous disease of unknown etiology, with variable clinical presentations depending on the organs affected.1,2
Pulmonary involvement is the most frequent manifestation and patients may often exhibit fatigue, dyspnea on exertion, and impaired exercise tolerance.3,4 Assessment
of functional impairment with pulmonary function tests (PFTs) typically reveals a restrictive pattern with a reduction in diffusing capacity for carbon monoxide (DLCO),5
while airflow limitation may be observed in a significant proportion of patients.6
Several studies, however, have shown inconsistencies between symptoms and abnormalities in PFTs in sarcoid patients, as normal spirometry and DLCO at rest do not categorically exclude functional limitations during exercise.7,8
Cardiopulmo-nary exercise testing (CPET), on the other hand, appears to be more useful in the correspondence: Paul Zarogoulidis
Pulmonary Department-Oncology Unit, “g Papanikolaou” general hospital, Aristotle University of Thessaloniki, 57010 Thessaloniki, greece Tel +30 697 727 1974 Fax +30 231 099 2424 email [email protected]
Journal name: Patient Preference and Adherence Article Designation: Original Research Year: 2015
Volume: 9
Running head verso: Kallianos et al
Running head recto: Relation of exercise capacity and disease severity in sarcoidosis DOI: http://dx.doi.org/10.2147/PPA.S86465
Patient Preference and Adherence downloaded from https://www.dovepress.com/ by 118.70.13.36 on 26-Aug-2020
For personal use only.
Number of times this article has been viewed
This article was published in the following Dove Press journal: Patient Preference and Adherence
Dovepress Kallianos et al
recognition of exercise intolerance, even in the early stages of the disease.9,10
Therefore, as relevant data in sarcoidosis are limited, the aim of the study presented here was to examine the possible added role of a maximal CPET, compared to PFT and DLCO measurements, in the evaluation of exercise capacity impair-ment in sarcoid patients with complaints of dyspnea and exercise limitation and to assess any potential correlations with PFT measurements and radiological stages of the disease.
Methods
subjects
Eighty-three Caucasian adult patients, who were con-secutively referred for evaluation of dyspnea and exercise limitation to a referral center for sarcoidosis over a 3-year period, were studied. The diagnosis of sarcoidosis was based on clinical features, radiological findings, and histological evidence of non-caseating granulomata, according to the World Association of Sarcoidosis and Other Granulomatous Disorders guidelines.1 Subjects’ chest radiographs were
examined by two radiologists blinded to the patient’s history and classified as: Stage 0: no radiographic abnormalities, Stage I: bilateral hilar adenopathy without parenchymal abnormalities, Stage II: bilateral hilar adenopathy with inter-stitial parenchymal infiltrates, Stage III: interinter-stitial paren-chymal infiltrates without hilar adenopathy, or Stage IV: evidence of pulmonary fibrosis with cicatricial changes, in accordance with the World Association of Sarcoidosis and Other Granulomatous Disorders guidelines.1
The reason for performing CPET was disabling symptoms of persistent dyspnea and exercise limitation at the time of diagnosis or during follow-up that could not be explained by the results of routine investigation, including lung function tests or chest radiographs. Patients suffering from anemia or significant comorbidities (eg, cardiac, other respiratory or neu-romuscular disorders) were excluded from the study. Clinical and laboratory data and PFT and CPET results were collected from medical records and studied retrospectively. The study was approved by the Investigational Review Board of the Therapeutic Clinic Alexandra Hospital, University of Athens, and informed consent was obtained from all the participants.
Dyspnea evaluation
Quantification of the perception of dyspnea was assessed at the time of evaluation via the modified British Medical Research Council (MRC) self-administered questionnaire.11
The MRC scale classifies subjects into one of five categories according to their degree of dyspnea when performing certain
activities; scores range from 0 to 4, with the higher scores indicating more severe dyspnea. Patients with MRC 0 were excluded from the study.
PFTs
Forced vital capacity (FVC), forced expiratory volume in 1 second (FEV1), the FEV1 to FVC ratio, mid-expiratory flow (forced expiratory flow 25%–75% [FEF25–75]), total lung capacity (TLC), residual volume (RV), and functional residual capacity (FRC) were measured by plethysmo-graphy with a Jaeger® Masterlab cabin. All the tests were
performed in sitting position and the best of three attempts was evaluated. The tests were compatible with the European Respiratory Society statement for Coal and Steel.12 DLCO
was measured using the single-breath method, after adjusting for hemoglobin concentration in g⋅dL-1, according to Cotes’
equation and predicted values were derived from standard equations.13
Maximal exercise capacity
CPET was performed using a standard protocol.14 All of the
patients underwent a symptom-limited incremental exercise test on an upright, electrically braked cycle ergometer (Viasys Oxycon Pro®) and were monitored during the testing, in
terms of electrocardiography (by 12-lead electrocardiogram), arterial pressure, and oxygen saturation (by pulse oximetry) every 2 minutes. The expired gases were analyzed with the ergospirometer following collection of 2 to 5 minutes of resting data, subjects pedaled at a rate of 50–60 rpm/min for 3 minutes without resistance, after which the work rate was incremented for 10–20 watts (W) each minute. The patients were encouraged to perform maximally for 8 to 12 minutes; otherwise, the test was terminated at the point of symptom limitation. Peak work rate (W), peak oxygen consumption (VO2 peak), peak carbon dioxide production (VCO2 peak), minute ventilation (VE), tidal volume (VT), heart rate (HR), breathing frequency, oxygen pulse and oxygen uptake/work rate ratio (ΔVO2/ΔWR) were recorded. Anaerobic threshold (AT) was determined by V-slope method and reported as the percentage of predicted VO2 peak. A result below 80% of the predicted values was assumed to indicate physical impairment, while maximum oxygen consumption (VO2 max) below 83% of the predicted value indicated impaired exercise intolerance.14
statistical analysis
All variables are expressed as means ± standard deviation and, when appropriate, in absolute numbers or percentages. The
Patient Preference and Adherence downloaded from https://www.dovepress.com/ by 118.70.13.36 on 26-Aug-2020
Dovepress relation of exercise capacity and disease severity in sarcoidosis
normal distribution of the variables was evaluated with the Kolmogorov–Smirnov analysis. PFT and CPET data, subdi-vided into groups according to the radiological stage of the disease, were compared using paired t-test or Mann–Whitney
U-test, as appropriate. Correlations between VO2 peak and
clinical, functional, and CPET variables were calculated using Spearman’s rank coefficient. A P-value of ,0.05 was con-sidered significant. Data were analyzed using SPSS software (v 18.0; IBM Corporation, Armonk, NY, USA).
Results
clinical characteristics and resting PFT
Eighty-three patients, 52 of whom were female, with a mean age 58.02±11.75 years (range 36–84 years) were included. The mean time from diagnosis was 13.27±6.6 years. Smoking history (current or ex-smokers) was recorded for 14 (17%) patients. Twenty-four patients (29%) had a score of 1 point on the MRC scale, while 37 (45%) and 22 (26%) patients had scores of 2 and 3 points, respectively. There were no Stage 0 patients and Stages I, II, III, and IV included 43 (52%), 25 (30%), six (7%), and nine (11%) patients, respectively. Since lung function indices were not statistically different between Stages II and III, patients were grouped according to their radiological stages as Group 1 (Stage I), Group 2 (Stages II and III), and Group 3 (Stage IV). There were no differ-ences between groups in regard to age and sex. Mean serum angiotensin-converting enzyme level was 43.04±19.89 and, although there was no significant difference between groups, higher levels of serum angiotensin-converting enzyme were measured in advanced stages.
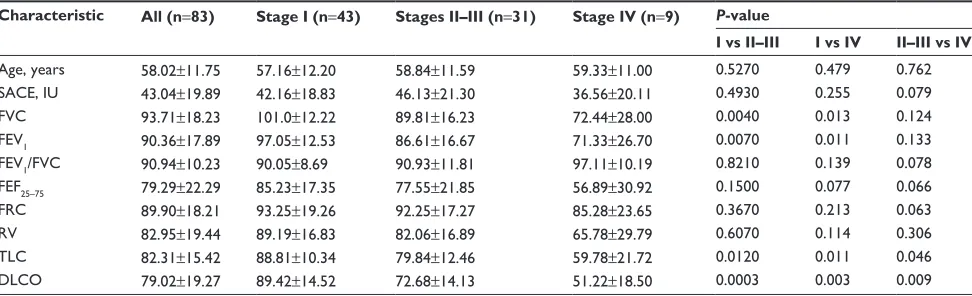
Clinical characteristics and resting PFT values are pre-sented in Table 1. FEV1, FVC, and TLC were significantly
reduced in Stage I patients compared to patients in Stages II–III and IV, however values indicative of clinical impairment (,80% of predicted values) were noticed only in Stage IV (72.44±28.00, 71.33±26.70, and 59.78±21.72, respectively). DLCO was found within normal limits in Stage I and mildly and moderately reduced in Stages II–III and IV (72.68±14.13 and 51.22±18.50, respectively) and differed significantly between all groups (Stage I vs Stages II–III, P=0.003; Stage I vs Stage IV, P=0.003; and Stages II–III vs Stage IV, P=0.009).
cPeT results
Peak HR $85% of the predicted value was achieved in 74% of the patients. According to the radiological stages, Stages I, II–III, and IV, the peak HR was achieved by 72%, 74%, and 68% of patients, respectively. With respect to AT, a maximal CPET was performed by 81% of patients. Leg fatigue alone was the cause of exercise intolerance in 46% of patients, while dyspnea was the main complaint in the remaining patients.
The CPET results in the studied population, subdivided in relation to disease stages, are summarized in Table 2. An abnormal CPET (VO2 peak ,83%) was exhibited by 53% of patients while, according to the radiological stages, VO2 peak was decreased in 48% of patients in Stage I and in 52% and 78% of patients in Stages II–III and IV, respec-tively. However, significant differences in exercise capac-ity were noticed only between Stages I and IV (P=0.003). VE/VCO2 was significantly increased in Stage IV compared to in Stage I patients (30.73±6.26 vs 25.58±4.05, P,0.001), while the other ventilatory (VE max, breathing frequency and VE/VO2) and cardiocirculatory parameters (HR peak,
Table 1 Clinical characteristics and pulmonary function tests in 83 patients with sarcoidosis classified according to radiological stage of the disease
Characteristic All (n=83) Stage I (n=43) Stages II–III (n=31) Stage IV (n=9) P-value
I vs II–III I vs IV II–III vs IV
Age, years 58.02±11.75 57.16±12.20 58.84±11.59 59.33±11.00 0.5270 0.479 0.762
sAce, iU 43.04±19.89 42.16±18.83 46.13±21.30 36.56±20.11 0.4930 0.255 0.079
FVc 93.71±18.23 101.0±12.22 89.81±16.23 72.44±28.00 0.0040 0.013 0.124
FeV1 90.36±17.89 97.05±12.53 86.61±16.67 71.33±26.70 0.0070 0.011 0.133
FeV1/FVc 90.94±10.23 90.05±8.69 90.93±11.81 97.11±10.19 0.8210 0.139 0.078
FeF25–75 79.29±22.29 85.23±17.35 77.55±21.85 56.89±30.92 0.1500 0.077 0.066
Frc 89.90±18.21 93.25±19.26 92.25±17.27 85.28±23.65 0.3670 0.213 0.063
rV 82.95±19.44 89.19±16.83 82.06±16.89 65.78±29.79 0.6070 0.114 0.306
Tlc 82.31±15.42 88.81±10.34 79.84±12.46 59.78±21.72 0.0120 0.011 0.046
DlcO 79.02±19.27 89.42±14.52 72.68±14.13 51.22±18.50 0.0003 0.003 0.009
Notes: All parameters are expressed as mean ± standard deviation. results of pulmonary function tests are expressed as percentages of predicted values.
Abbreviations: DlcO, diffusing capacity of the lung for carbon monoxide; FeF25–75, forced expiratory flow 25%–75%; FEV1, forced expiratory volume in 1 second; Frc,
functional residual capacity; FVc, forced vital capacity; rV, residual volume; sAce, serum angiotensin-converting enzyme; Tlc, total lung capacity.
Patient Preference and Adherence downloaded from https://www.dovepress.com/ by 118.70.13.36 on 26-Aug-2020
Dovepress Kallianos et al
O2 pulse, ΔHR/ΔVO2 and ΔVO2/ΔWR) did not differ among the three groups.
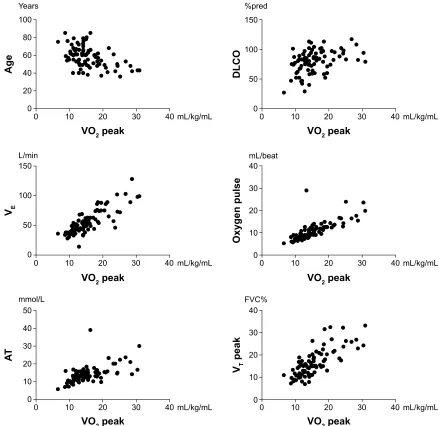
Among the whole population, significant correlations (P,0.001) were found between VO2 peak and age, DLCO, VE, oxygen pulse, lactate threshold, and VT peak (Figure 1). Correlations of VO2 peak in relation to the radiological stages of the disease are summarized in Table 3. Of note, both functional parameters (FEV1, FVC, FEF25–75) and HR peak were found to be significant predictors of exercise capacity only in Stages II+II, whereas exercise limitation in Stage IV was related mainly to physiological impairment due to ventilatory parameters.
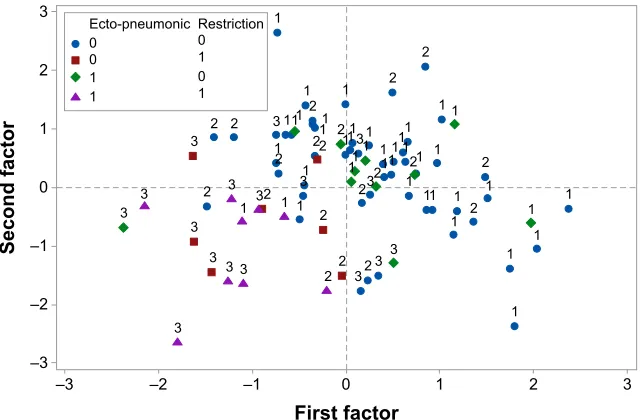
Moreover, the spirometric and ergospirometric variables, seen as two variable sets, were correlated with each other to produce the correlation matrix. Apparently, transfer factor for the lung for carbon monoxide (TLCO%) and diffusing capacity of the lung for carbon monoxide (DLCO%) cor-relate adequately with the spirometric percent forced expira-tory volume in 1 second (FEV1%) and percent forced vital capacity (FVC%), all in a positive direction. Loose correla-tions among other variables can also be viewed between the two sets of variables. Figures 2 and 3 show the arrangement of variables and patients (sample) in the space formed by the principal component analysis (PCA) major axes 1 and 2. Each quartile hosts particular variables and patients in the two graphs correspondingly, and thus it is directly informative for their behavior. The variables VO2 max toward VE, positioned on the lower right quartile (Figure 2), correlate strongly and positively with each other and explain patients who fulfill the conditions, the absence of extrapulmonary sarcoidic location,
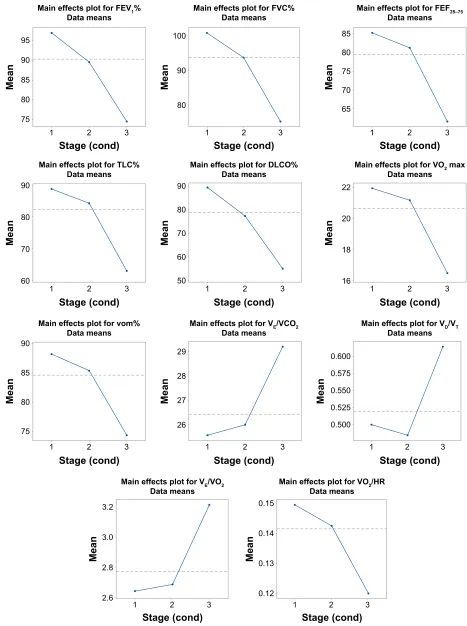
and the restriction rule at radiological Stage 1 (Figure 3). On the contrary, variables such as VE/VCO2, VE/VO2 peak, and deadspace/tidal volume ratio (VD/VT) cover the lower left quartile (Figure 1) indicate the worst radiological stage, present the extrapulmonary location, and illustrate the restriction rule (Figure 3). The variables and particularly the VE/VCO2 are negatively correlated with the variables possessing the upper right quartile, in which normal conditions prevail. The radio-logical stages exert statistically significant effects on some of the ergo-/spirometric variable spectrum. These effects are illustrated per variable in Figure 4 where two inverse trends are formed. A group of three variables (VE/VCO2, VD/VT, and VE/VO2) show an increasing response and more intensity at Stage III and a group of eight variables decline at increasing radiological levels and more profoundly at Stage III.
The restriction rule and radiological stages interact signifi-cantly (χ 2=18.39, P,001) resulting in a high present restriction
ruling effect at Stage III that is nearly absent at Stage I. DLCO, transformed to ordinal values of low, mild, and best conditions, appears to affect the VO2 peak behavior (F=5.90, P=0.004) in a manner whereby, at the best DLCO condition, the VO2 peak maximizes its performance (1,794.6, Figure 5).
Discussion
The major finding of this study was that cardiopulmonary exercise testing revealed limitations in exercise capacity to a similar extent regardless of the radiological stage in patients with sarcoidosis, although PFTs indicated clinical impairment only in patients with more advanced disease. To our knowledge, our retrospective study is the first to Table 2 Cardiopulmonary exercise test results in 83 patients with sarcoidosis classified according to radiological stage of the disease
Maximal exercise data All (n=83) Stage P-value
I (n=43) II–III (n=31) IV (n=9) I vs II–III I vs IV II–III vs IV
Workload, W 97.570±53.630 106.200±55.320 90.030±52.560 82.330±46.600 0.135 0.176 0.869
VO2 peak, %pred 84.600±15.310 88.280±14.360 82.650±15.120 73.780±15.560 0.166 0.003 0.365 VO2 peak, ml/kg/min 20.620±5.661 21.960±5.210 19.550±6.240 17.960±4.250 0.098 0.068 0.596 ΔVO2/ΔWR, mL/W 2.590±14.620 20.130±17.030 21.210±12.330 20.620±9.725 0.174 0.358 0.795
Ve, l/min 56.420±20.220 58.280±21.910 54.320±19.570 54.780±13.960 0.232 0.952 0.609
Ve/VO2, VT 23.800±4.190 23.020±3.650 23.770±3.970 24.640±4.270 0.345 0.134 0.367
Ve/VcO2, VT 26.450±4.660 25.580±4.050 26.410±4.410 30.730±6.260 0.232 ,0.001 0.006 BF max, min-1 39.200±12.000 35.700±10.000 37.800±11.000 42.900±10.000 0.356 0.561 0.563 VT peak, FVC% 52.300±25.000 51.340±32.000 51.200±45.000 54.010±56.000 0.508 0.163 0.124
hr peak 145.200±23.400 149.500±22.660 138.900±24.790 146.400±18.900 0.078 0.283 0.909
AT 16.110±18.500 18.620±25.220 13.630±4.820 12.620±3.310 0.245 0.296 0.687
Oxygen pulse peak 11.060±4.100 11.290±4.040 11.240±4.510 9.360±2.560 0.726 0.316 0.236
Δhr/ΔVO2 68.830±24.000 71.430±25.000 65.500±23.000 74.670±27.000 0.063 0.639 0.245
Note: results are expressed as mean ± standard deviation.
Abbreviations: FVC%, percent forced vital capacity; %pred, percent predicted; AT, anaerobic threshold; BF, breathing frequency; HR, heart rate; Ve, minute ventilation;
VcO2, carbon dioxide production; VO2, oxygen consumption; VT, tidal volume; VT, ventilatory threshold; Wr, workload.
Patient Preference and Adherence downloaded from https://www.dovepress.com/ by 118.70.13.36 on 26-Aug-2020
Dovepress relation of exercise capacity and disease severity in sarcoidosis
Figure 1 VO2 peak correlations with clinical, functional, and cardiopulmonary test parameters in 83 patients with sarcoidosis. Note: P,0.001 for all comparisons.
Abbreviations: FVC%, percent forced vital capacity; %pred, percent predicted; AT, anaerobic threshold; DLCO, diffusing capacity of the lung for carbon monoxide; Ve, minute ventilation; VO2 peak, peak oxygen consumption; VT, tidal volume.
<HDUV
P/NJP/
92SHDN
$JH
P/NJP/ SUHG
92SHDN
'/&2
/PLQ
P/NJP/
92SHDN
9(
92SHDN
P/NJP/ P/EHDW
2[\JHQSXOVH
P/NJP/ PPRO/
92SHDN
$7
P/NJP/ )9&
92SHDN
97
SHDN
Table 3 correlation of functional variables at rest with peak oxygen consumption (VO2 peak) in 83 patients with sarcoidosis according to radiological stages
Variable Stage I Stages II–III Stage IV
r P r P r P
FeV1 -0.147 0.346 0.395 0.028 -0.402 0.284
FVc -0.087 0.579 0.453 0.010 -0.368 0.330
FeV1/FVc 0.111 0.478 0.045 0.809 -0.561 0.117
FeF25–75 0.004 0.998 0.445 0.012 -0.207 0.594
Frc -0.653 0.423 0.647 0.422 -0.634 0.452
rV -0.017 0.910 0.072 0.698 -0.536 0.782
Tlc 0.088 0.574 0.319 0.080 -0.059 0.881
DlcO 0.397 0.008 0.412 0.021 0.160 0.681
Note: lung function parameters are expressed as percentage of the predicted values.
Abbreviations: DlcO, diffusing capacity of the lung for carbon monoxide; FeF25–75, forced expiratory flow 25%–75%; FEV1, forced expiratory volume in 1 second;
Frc, functional residual capacity; FVc, forced vital capacity; rV, residual volume; Tlc, total lung capacity.
Patient Preference and Adherence downloaded from https://www.dovepress.com/ by 118.70.13.36 on 26-Aug-2020
Dovepress Kallianos et al
± ± ± ± )LUVWIDFWRU 6HFRQGIDFWRU
92+5
9(92SHDN
9(92 9'97
+5SHDN
97SHDN
9( 9&2 :RUNORDG ([HUFLVH WLPH $7
9(9&2
92SHDN YRP
92PD[
'/&2 7/&
)()±
59
)(9)9&
)9& )(9
Figure 2 Biplot of correlation coefficients (loading factors) of ergo/spirometric variables with PCA axes 1 and 2. The longer the arrow the greater effect is produced by the variable. Variables forming oblique angles correlate positively with each other and negatively at arrows with obtuse angles. The lower oblique or wider obtuse aperture the higher the correlation coefficient.
Abbreviations: AT, anaerobic threshold; DlcO, diffusing capacity of the lung for carbon monoxide; FeF25–75, forced expiratory flow 25%–75%; FEV1, forced expiratory volume in
1 second; FVC, forced vital capacity; FVC%, percent forced vital capacity; HR, heart rate; PCA, principal component analysis; RV%, percent residual volume; TLC, total lung capacity; VcO2, carbon dioxide production; Ve, minute ventilation; VO2, oxygen consumption; VT, tidal volume; vom%, maximal aerobic capacity.
Figure 3 PcA scores and patients position as arranged by the two major axes according to radiological stages i–iii and the combined presence/absence of ecto-pneumonic location and restriction rules.
Abbreviation: PcA, principal component analysis.
± ± ± ± ± ± )LUVWIDFWRU 6HFRQGIDFWRU (FWRSQHXPRQLF 5HVWULFWLRQ
have evaluated exercise capacity in a Greek population of sarcoid patients by combined assessment of PFT and CPET measurements.
Our results are in agreement with the current pub-lished literature. Earlier studies reported that abnormal responses of oxygen uptake during exercise are common in sarcoidosis,7,10,15,16 even in those patients with only mild
disease. Akkoca et al17 in a small study of 29 sarcoid patients,
found that exercise capacity was the earliest impaired physio-logical parameter, even in patients with Stage I disease and completely normal spirometry. Similarly, in another small study of 32 patients with sarcoidosis and variable levels of DLCO, Karetzky and McDonough18 reported
signifi-cant exercise intolerance, with an up to 30% reduction in
Patient Preference and Adherence downloaded from https://www.dovepress.com/ by 118.70.13.36 on 26-Aug-2020
Dovepress relation of exercise capacity and disease severity in sarcoidosis
Figure 4 Mean changes of the significant ergo-/spirometric variables with the radiological conditions 1–3.
Abbreviations: DLCO%, percent diffusing capacity of the lung for carbon monoxide; FEV1%, percent forced expiratory volume in 1 second; FEF25–75, forced expiratory
flow 25%–75%; FVC%, percent forced vital capacity; TLC, total lung capacity; VCO2, carbon dioxide production; VO2, oxygen consumption; VO2 max, maximum oxygen
consumption; vom%, maximal aerobic capacity; VD, deadspace; Ve, minute ventilation; VT, tidal volume; vom%, maximal aerobic capacity; HR, heart rate.
6WDJHFRQG
0HDQ
6WDJHFRQG
0HDQ
0DLQHIIHFWVSORWIRU)(9
'DWDPHDQV
0DLQHIIHFWVSORWIRU7/& 'DWDPHDQV
6WDJHFRQG
0HDQ
0DLQHIIHFWVSORWIRUYRP 'DWDPHDQV
6WDJHFRQG
0HDQ
6WDJHFRQG
0HDQ
0DLQHIIHFWVSORWIRU)9& 'DWDPHDQV
0DLQHIIHFWVSORWIRU'/&2 'DWDPHDQV
6WDJHFRQG
0HDQ
0DLQHIIHFWVSORWIRU9(9&2
'DWDPHDQV
6WDJHFRQG
0HDQ
6WDJHFRQG
0HDQ
0DLQHIIHFWVSORWIRU)()±
'DWDPHDQV
0DLQHIIHFWVSORWIRU92PD[
'DWDPHDQV
6WDJHFRQG
0HDQ
0DLQHIIHFWVSORWIRU9'97 'DWDPHDQV
6WDJHFRQG
0HDQ
6WDJHFRQG
0HDQ
0DLQHIIHFWVSORWIRU9(92
'DWDPHDQV 0DLQHIIHFWVSORWIRU92'DWDPHDQV +5
Patient Preference and Adherence downloaded from https://www.dovepress.com/ by 118.70.13.36 on 26-Aug-2020
Dovepress Kallianos et al
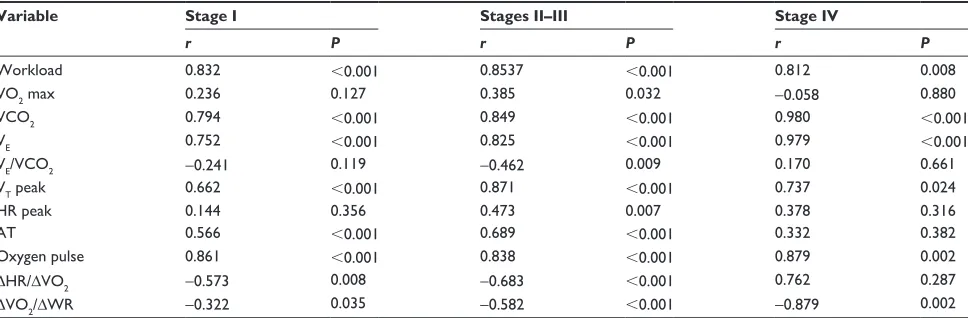
Table 4 correlation of cardiopulmonary test variables with VO2 peak in 83 patients with sarcoidosis according to radiological stages
Variable Stage I Stages II–III Stage IV
r P r P r P
Workload 0.832 ,0.001 0.8537 ,0.001 0.812 0.008
VO2 max 0.236 0.127 0.385 0.032 -0.058 0.880
VcO2 0.794 ,0.001 0.849 ,0.001 0.980 ,0.001
Ve 0.752 ,0.001 0.825 ,0.001 0.979 ,0.001
Ve/VcO2 -0.241 0.119 -0.462 0.009 0.170 0.661
VT peak 0.662 ,0.001 0.871 ,0.001 0.737 0.024
hr peak 0.144 0.356 0.473 0.007 0.378 0.316
AT 0.566 ,0.001 0.689 ,0.001 0.332 0.382
Oxygen pulse 0.861 ,0.001 0.838 ,0.001 0.879 0.002
Δhr/ΔVO2 -0.573 0.008 -0.683 ,0.001 0.762 0.287
ΔVO2/ΔWr -0.322 0.035 -0.582 ,0.001 -0.879 0.002
Note: cardiopulmonary test parameters are expressed as percentage of the predicted values.
Abbreviations: AT, anaerobic threshold; hr, heart rate; Ve, minute ventilation; Wr, workload; VcO2, carbon dioxide production; VO2, oxygen consumption; VO2 max,
maximum oxygen consumption; VT, tidal volume.
%HVW 0LOG
/RZ
92
SHDN
'/&2
Figure 5 Mean changes of VO2 peak along with the ordinal categories of diffusing
capacity of the lung for carbon monoxide (DlcO).
Notes: Vertical lines indicate the 95% confidence intervals of means calculated from the error mean square of analysis of variance. Means whose intervals do not overlap differ significantly.
maximal aerobic capacity compared to healthy age-matched controls.
In patients with more advanced disease, previous studies suggested that reduced exercise capacity may reflect limitations due to ventilatory mechanics impairment and gas exchange abnormalities.9,19,20 In our study, FEV
1, FVC, TLC,
and DLCO were significantly decreased in Stage IV patients, a finding that could probably explain the affected exercise performance, as expressed by the significant decrease in VO2 peak, in those patients. Our findings are in agreement with the results of Marcellis et al21 who reported, in their study
of 160 sarcoid patients, that DLCO%, FVC%, and advanced radiological stages (0–I vs II–IV) were significantly indepen-dent predictors of pulmonary gas exchange abnormalities. Additionally in our study we found that, in Stage IV patients, VE/VCO2 was significantly increased compared to Stage I, suggesting that hyperventilation may also play a role in
exercise limitation in more advanced disease. This increase in the ventilatory response in Stage IV may be attributed, at least in part, to inefficient gas exchange due to impairment of the diffusing capacity of the lungs21,22 or to increased
physiological dead space due to pulmonary hypertension.23
However, our study was not designed to assess this finding by arterial blood gas measurements or echocardiography.
On the other hand, in the early stages of sarcoidosis, with normal or only mildly impaired lung function, circulatory impairment and reduced heart response to exercise seem to contribute in exercise intolerance.9,20,24 In our study, while
DLCO and functional parameters were not affected in Stage I and were only mildly impaired in Stages II–III, 48% of Stage I and 52% of Stage II–III patients, presented an abnormal CPET response. Interestingly, in these patients, exercise capacity, as expressed by VO2 peak was found to correlate strongly with both ventilatory as well as cardiocirculatory parameters of CPET. Additionally, 26% of our patients did not reach the predicted maximum heart rate in spite of performing a maxi-mal CPET with respect to AT, a fact suggesting that the low HR peak was unlikely to be related to a submaximal study. It is worth noting that, in our study, a significant correlation (P=0.007) was noted between VO2 peak and HR peak and VO2 to HR ratio (or oxygen pulse) in Stages II–III, findings that may in part explain the exercise limitation (Table 4). Delobbe et al7 showed that a low peak heart rate at maximal
CPET was associated with reduced maximal exercise capacity in sarcoid patients with normal resting PFT and reductions in HR of similar extent were also reported by Karetzky and McDonough,18 although the authors did not explain this result.
Finally, cardiac dysfunction in sarcoidosis may be second-ary to subclinical left heart failure,25 myocardial conducting
Patient Preference and Adherence downloaded from https://www.dovepress.com/ by 118.70.13.36 on 26-Aug-2020
Dovepress relation of exercise capacity and disease severity in sarcoidosis
system infiltration with sarcoid granulomas,26 and
unrecog-nized pulmonary hypertension or cor pulmonale27 that may
all also significantly contribute to exercise intolerance. Nev-ertheless, our suggestions do not exclude the possibility that the observed oxygen pulse decrease might also be related to deconditioning, fatigue,4,28 or muscle involvement.29,30
The main limitation of our study was that the included data were insufficient to provide information about the exact mechanisms causing exercise intolerance in patients with sarcoidosis. Our study was not designed to demonstrate inefficiency of gas exchange during exercise by arterial gas measurements and potential cardiovascular dysfunction was not documented by echocardiography or other cardiac imaging techniques. Furthermore, confounding factors, such as treatment with corticosteroids, general fatigue, skeletal muscle weakness, and physical inactivity are also often present in sarcoid patients and may have influenced our findings. Moreover, sarcoidosis fatigue syndrome was not assessed by the treating physicians.
Finally, the findings of the present study need to be repro-duced prospectively in a larger sample, especially with more Stage IV patients, so that definite conclusions can be made.
Conclusion
The results of our study confirm the added value of cardio-pulmonary exercise testing in the evaluation of exercise intolerance in patients with sarcoidosis. The analysis of our data suggests that exercise capacity is the earliest impaired physiological parameter in sarcoid patients, as it was found to be reduced even in the early stages of the disease. The mechanisms responsible for exercise limitation in sarcoidosis have a multifactorial basis and seem to be correlated with the radiological extent of the disease. In more advanced stages, ventilatory and gas exchange abnormalities are probably primarily responsible for reduced exercise performance. However, in the earlier stages, cardiocirculatory factors – in particular, impaired HR response to exercise – were found to contribute to a significant degree to exercise intolerance, a fact that underlines the usefulness of CPET in determining the possible pathogenetic mechanisms. Prospective clinical studies with larger series of all stages are needed to define the mechanisms of exercise intolerance in sarcoidosis. It is the belief of the authors that cardiopulmonary exercise test-ing should be performed in every patient presenttest-ing with sarcoidosis and on follow-up, if available.
Disclosure
The authors declare no conflicts of interest in this work.
References
1. Statement on sarcoidosis. Joint Statement of the American Thoracic Society (ATS), the European Respiratory Society (ERS) and the World Association of Sarcoidosis and Other Granulomatous Disorders (WASOG) adopted by the ATS Board of Directors and by the ERS Execu-tive Committee, February 1999. Am J Respir Crit Care Med. 1999;160(2): 736–755.
2. Baughman RP, Culver DA, Judson MA. A concise review of pulmonary sarcoidosis. Am J Respir Crit Care Med. 2011;183(5):573–581. 3. Drent M, Lower EE, De Vries J. Sarcoidosis-associated fatigue. Eur
Respir J. 2012;40(1):255–263.
4. Marcellis RG, Lenssen AF, Elfferich MD, et al. Exercise capacity, muscle strength and fatigue in sarcoidosis. Eur Respir J. 2011;38(3): 628–634.
5. Winterbauer RH, Hutchinson JF. Use of pulmonary function tests in the management of sarcoidosis. Chest. 1980;78(4):640–647. 6. Levinson RS, Metzger LF, Stanley NN, et al. Airway function in
sar-coidosis. Am J Med. 1977;62(1):51–59.
7. Delobbe A, Perrault H, Maitre J, et al. Impaired exercise response in sarcoid patients with normal pulmonary functio. Sarcoidosis, vasculitis, and diffuse lung diseases: official journal of WASOG/World Associa-tion of Sarcoidosis and Other Granulomatous Disorders. 2002;19(2): 148–153.
8. Kollert F, Geck B, Suchy R, et al. The impact of gas exchange measure-ment during exercise in pulmonary sarcoidosis. Respir Med. 2011;105(1): 122–129.
9. Athos L, Mohler JG, Sharma OP. Exercise testing in the physiologic assessment of sarcoidosis. Ann N Y Acad Sci. 1986;465:491–501. 10. Miller A, Brown LK, Sloane MF, Bhuptani A, Teirstein AS.
Cardio-respiratory responses to incremental exercise in sarcoidosis patients with normal spirometry. Chest. 1995;107(2):323–329.
11. Cotes JE. Medical Research Council Questionnaire on Respiratory Symptoms (1986). Lancet. 1987;2(8566):1028.
12. Quanjer PH, Tammeling GJ, Cotes JE, Pedersen OF, Peslin R, Yernault JC. Lung volumes and forced ventilatory flows. Report Work-ing Party Standardization of Lung Function Tests, European Community for Steel and Coal. Official Statement of the European Respiratory Society. Eur Respir J Suppl. 1993;16:5–40.
13. Macintyre N, Crapo RO, Viegi G, et al. Standardisation of the single-breath determination of carbon monoxide uptake in the lung. Eur Respir J. 2005;26(4):720–735.
14. American Thoracic Society; American College of Chest Physicians. ATS/ACCP Statement on cardiopulmonary exercise testing. Am J Respir Crit Care Med. 2003;167(2):211–277.
15. Spiro SG, Dowdeswell IR, Clark TJ. An analysis of submaximal exercise responses in patients with sarcoidosis and fibrosing alveolitis. Br J Dis Chest. 1981;75(2):169–180.
16. Matthews JI, Hooper RG. Exercise testing in pulmonary sarcoidosis. Chest. 1983;83(1):75–81.
17. Akkoca O, Celik G, Ulger F, et al. Exercise capacity in sarcoidosis. Study of 29 patients. Med Clin (Barc). 2005;124(18):686–689. 18. Karetzky M, McDonough M. Exercise and resting pulmonary
func-tion in sarcoidosis. Sarcoidosis Vasc Diffuse Lung Dis. 1996;13(1): 43–49.
19. Wallaert B, Talleu C, Wemeau-Stervinou L, Duhamel A, Robin S, Aguilaniu B. Reduction of maximal oxygen uptake in sarcoidosis: relationship with disease severity. Respiration. 2011;82(6):501–508. 20. Barros WG, Neder JA, Pereira CA, Nery LE. Clinical, radiographic
and functional predictors of pulmonary gas exchange impairment at moderate exercise in patients with sarcoidosis. Respiration. 2004;71(4): 367–373.
21. Marcellis RG, Lenssen AF, de Vries GJ, et al. Is there an added value of car-diopulmonary exercise testing in sarcoidosis patients? Lung. 2013;191(1): 43–52.
22. Péronnet F, Aguilaniu B. Lactic acid buffering, nonmetabolic CO2 and exercise hyperventilation: a critical reappraisal. Respir Physiol Neurobiol. 2006;150(1):4–18.
Patient Preference and Adherence downloaded from https://www.dovepress.com/ by 118.70.13.36 on 26-Aug-2020
Patient Preference and Adherence
Publish your work in this journal
Submit your manuscript here: http://www.dovepress.com/patient-preference-and-adherence-journal
Patient Preference and Adherence is an international, peer-reviewed, open access journal that focuses on the growing importance of patient preference and adherence throughout the therapeutic continuum. Patient satisfaction, acceptability, quality of life, compliance, persistence and their role in developing new therapeutic modalities and compounds to optimize
clinical outcomes for existing disease states are major areas of interest for the journal. This journal has been accepted for indexing on PubMed Central. The manuscript management system is completely online and includes a very quick and fair peer-review system, which is all easy to use. Visit http://www. dovepress.com/testimonials.php to read real quotes from published authors.
Dovepress
Dove
press
Kallianos et al
23. Baughman RP, Engel PJ, Meyer CA, Barrett AB, Lower EE. Pulmonary hypertension in sarcoidosis. Sarcoidosis Vasc Diffuse Lung Dis. 2006;23(2): 108–116.
24. Medinger AE, Khouri S, Rohatgi PK. Sarcoidosis: the value of exercise testing. Chest. 2001;120(1):93–101.
25. Sietsema KE, Kraft M, Ginzton L, Sharma OP. Abnormal oxygen uptake responses to exercise in patients with mild pulmonary sarcoidosis. Chest. 1992;102(3):838–845.
26. Sharma OP, Maheshwari A, Thaker K. Myocardial sarcoidosis. Chest. 1993;103(1):253–258.
27. Lopes AJ, Menezes SL, Dias CM, Oliveira JF, Mainenti MR, Guimarães FS. Cardiopulmonary exercise testing variables as predictors of long-term outcome in thoracic sarcoidosis. Braz J Med Biol Res. 2012;45(3): 256–263.
28. Marcellis RG, Lenssen AF, Kleynen S, De Vries J, Drent M. Exercise capacity, muscle strength, and fatigue in sarcoidosis: a follow-up study. Lung. 2013;191(3):247–256.
29. Spruit MA, Thomeer MJ, Gosselink R, et al. Skeletal muscle weakness in patients with sarcoidosis and its relationship with exercise intolerance and reduced health status. Thorax. 2005;60(1):32–38.
30. Baydur A, Alsalek M, Louie SG, Sharma OP. Respiratory muscle strength, lung function, and dyspnea in patients with sarcoidosis. Chest. 2001;120(1): 102–108.
Patient Preference and Adherence downloaded from https://www.dovepress.com/ by 118.70.13.36 on 26-Aug-2020