Variations in Practice and Outcomes in the Canadian NICU Network:
1996 –1997
Shoo K. Lee, MBBS, FRCPC, PhD*‡; Douglas D. McMillan, MD, FRCPC§; Arne Ohlsson, MD, FRCPC, MSc储; Margaret Pendray, MBBS, FRCPC*;
Anne Synnes, MDCM, FRCPC, MHSc*¶; Robin Whyte, MBBS, FRCPC#; Li-Yin Chien, MPH, ScD*‡; Joanna Sale, MSc‡; and the Canadian NICU Network**
ABSTRACT. Background. Previous reports of varia-tions in outcomes among neonatal intensive care units (NICUs) examined only specific subpopulations of inter-est (eg, very low birth weight [VLBW] infants<1500 g of birth weight [BW]).
Objectives. We report on current practice and out-comes variations in a population-based national study of Canadian NICUs from January 8, 1996 to October 31, 1997.
Method. Information on 20 488 admissions to 17 ter-tiary level NICUs across Canada was prospectively col-lected by trained abstractors using a standard manual of operations and definitions. Data were verified and ana-lyzed in concert with a steering committee comprising experienced researchers and neonatologists. Patient in-formation included demographic inin-formation, antenatal history, mode of delivery, problems at delivery, status of infant and problems at birth, illness severity (Clinical Risk Index for Babies, Score for Neonatal Acute Physi-ology, Score for Neonatal Acute Physiology-Version II), therapeutic intensity (Neonatal Therapeutic Intensity Scoring System [NTISS]), selected NICU practices and procedures, use of technology and resources, and se-lected patient outcomes. Patients were tracked until death or discharge home.
Results. The mean number of annual admissions to an NICU was 657, with 26% outborn infants. Fifty-three percent were <2500 g BW, 20% were <1500 g BW (VLBW), and 65% were preterm (<38 weeks’ gestational age [GA]). Only 2% of mothers received no prenatal care. Antenatal steroids were given to 58%, but there was wide variation in use (23%–76%). Congenital anomalies were present in 14%, and 4% were small for GA (less than the
third percentile). Admission illness severity was lowest among infants 33 to 37 weeks of GA and correlated with risk of death. Ninety-six percent of patients survived until discharge, but fewer survived at lower GA. No infant<22 weeks’ GA survived. Seven percent of infants had at least 1 episode of infection, but 75% received antibiotics in the NICU. Forty-three percent received re-spiratory support, and 14% received surfactant. Nitric oxide was given to 150 term infants and to 102 preterm infants. Selected outcomes of VLBW infants were: sur-vival rate (87%); chronic lung disease (26%); >stage 3 retinopathy of prematurity (ROP; 11%); >grade 3 intra-ventricular hemorrhage (IVH; 10%); nosocomial infection (22%); necrotizing enterocolitis (NEC; 7%). Sixty-nine percent of VLBW infants survived without major mor-bidity (>grade 3 IVH, chronic lung disease, NEC,>grade 3 ROP). The mean duration of NICU stay was 19 days. Forty-seven percent of infants were discharged from the hospital, and 43% were retrotransferred to a community facility before discharge home. Significant variation in practices and outcomes were observed in all aspects of NICU care.
Conclusion. This study provides population-based information about NICU outcomes. Significant variation in NICU practices and outcomes was observed despite Canada’s universal health insurance system. This na-tional database provides valuable information for plan-ning research, allocating resources, desigplan-ning health and public policy, and serving as a basis for longitudinal studies of NICU care in Canada. Pediatrics 2000;106:1070 –1079; neonatal intensive care unit, varia-tions, practice, outcomes.
ABBREVIATIONS. NICU, neonatal intensive care unit; VLBW, very low birth weight; FTE, full-time equivalent; ECMO, extracor-poreal membrane oxygenation; CRIB, Clinical Risk Index for Ba-bies; SNAP, Score for Neonatal Acute Physiology; SNAP-II, Score for Neonatal Acute Physiology-Version II; NTISS, Neonatal Ther-apeutic Intensity Scoring System; GA, gestational age; SGA, small for gestational age; BW, birth weight; CLD, chronic lung disease; CGA, corrected gestational age; IVH, intraventricular hemor-rhage; NEC, necrotizing enterocolitis; ROP, retinopathy of prema-turity; CSF, cerebrospinal fluid; PDA, patent ductus arteriosus; NICHD, National Institute of Child Health and Development; VOTN, Vermont Oxford Trials Network; ANZNN, Australia-New Zealand Neonatal Network.
A
dvances in neonatal intensive care have sig-nificantly increased survival and decreased morbidity among infants admitted to neona-tal intensive care units (NICUs).1–5 There are,how-ever, significant variations in outcomes among
From the *Department of Pediatrics, University of British Columbia, British Columbia, Canada; ‡Centre for Community Health and Health Evaluation Research, British Columbia, Canada; §Department of Pediatrics, University of Calgary, Calgary, Alberta, Canada;储Department of Pediatrics, University of Toronto, Toronto, Ontario, Canada; ¶Department of Pediatrics, McGill University, Montre´al, Quebec, Canada; and the #Department of Pediatrics, Dalhousie University, Nova Scotia, Canada.
**Members of the Canadian NICU Network and Coordinating Center are listed in the “Appendix.”
Findings from this study were presented in part at the Annual Meeting of the American Pediatric Society/Society for Pediatric Research; May 1– 4, 1999; San Francisco, CA; and at the Annual Meeting of the Canadian Pediatric Society; June 22–27, 1999, Winnipeg, Manitoba, Canada. Received for publication Dec 2, 1999; accepted May 22, 2000.
Reprint requests to (S.K.L.) Canadian NICU Network Centre for Commu-nity Health and Health Evaluation Research, 4480 Oak St, Rm E-414, Van-couver, British Columbia, Canada V6H 3V4. E-mail: shool@interchange. ubc.ca
NICUs.6,7Unfortunately, most reports examine only
specific subpopulations of interest (eg, very low birth weight [VLBW] infants weighing ⱕ1500 g at birth) and are not population-based.2,3,6,7 The purpose of
this study was to create a national population-based database, which could be used to explore ways of improving quality of care in Canadian NICUs.
Canada has universal health insurance coverage, which may increase access to health care and de-crease variation in practices and outcomes. However, it also has a highly regionalized system of neonatal– perinatal care, which may increase variation in prac-tices and outcomes between regions. In 1995 the Canadian NICU Network was funded by the Medi-cal Research Council of Canada to establish a stan-dardized national database of practices and out-comes in tertiary level regional NICUs throughout all provinces in Canada, to examine variations in outcomes, and to explore potential ways of improv-ing efficiency and efficacy of treatment in Canadian NICUs. In 1996 Canada had a population of nearly 30 million people8and had over 357 000 births.9The 17
NICUs in the Canadian NICU Network include 75%
of all tertiary level NICU beds in Canada and serve a population of⬃22 million people. All NICUs, except one, were tertiary level regional NICUs. We report the patient characteristics and selected summary out-comes of admissions to 17 NICUs in Canada during a 21-month period from January 1996 to October 1997. This report profiles the current state of NICU outcomes and practices in Canada and serves as a reference for future reports, which will examine spe-cific outcomes in depth.
METHODS Participating Hospitals
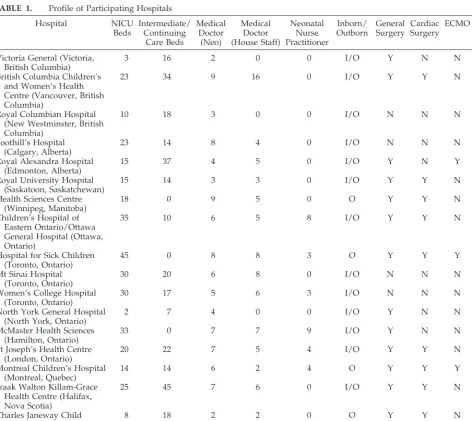
Participating hospitals (Table 1) represent all geographic re-gions of Canada. Children’s Hospital of Eastern Ontario and Ot-tawa General Hospital were considered as one collaborating cen-ter because they are an integrated neonatal–perinatal facility serving the same geographic region. During the study, the Chil-dren’s Hospital of British Columbia and the Women’s Hospital of British Columbia were merged into the Children’s and Women’s Health Center of British Columbia and were considered as an integrated neonatal–perinatal facility. There were 349 NICU beds (range: 2– 45) and 286 intermediate level and continuing care neonatal beds (range: 0 – 45) in the 17 NICUs. Medical staffing
TABLE 1. Profile of Participating Hospitals
Hospital NICU
Beds
Intermediate/ Continuing
Care Beds
Medical Doctor
(Neo)
Medical Doctor (House Staff)
Neonatal Nurse Practitioner
Inborn/ Outborn
General Surgery
Cardiac Surgery
ECMO Cryo/ Laser
Victoria General (Victoria, British Columbia)
3 16 2 0 0 I/O Y N N N
British Columbia Children’s and Women’s Health Centre (Vancouver, British Columbia)
23 34 9 16 0 I/O Y Y N Y
Royal Columbian Hospital (New Westminster, British Columbia)
10 18 3 0 0 I/O N N N N
Foothill’s Hospital (Calgary, Alberta)
23 14 8 4 0 I/O N N N N
Royal Alexandra Hospital (Edmonton, Alberta)
15 37 4 5 0 I/O Y N Y Y
Royal University Hospital (Saskatoon, Saskatchewan)
15 14 3 3 0 I/O Y Y N Y
Health Sciences Centre (Winnipeg, Manitoba)
18 0 9 5 0 O Y Y N Y
Children’s Hospital of Eastern Ontario/Ottawa General Hospital (Ottawa, Ontario)
35 10 6 5 8 I/O Y Y N Y
Hospital for Sick Children (Toronto, Ontario)
45 0 8 8 3 O Y Y Y Y
Mt Sinai Hospital (Toronto, Ontario)
30 20 6 8 0 I/O N N N N
Women’s College Hospital (Toronto, Ontario)
30 17 5 6 3 I/O N N N N
North York General Hospital (North York, Ontario)
2 7 4 0 0 I/O Y N N N
McMaster Health Sciences (Hamilton, Ontario)
33 0 7 7 9 I/O Y N N Y
St Joseph’s Health Centre (London, Ontario)
20 22 7 5 4 I/O Y Y N Y
Montreal Children’s Hospital (Montreal, Quebec)
14 14 6 2 4 O Y Y Y Y
Izaak Walton Killam-Grace Health Centre (Halifax, Nova Scotia)
25 45 7 6 0 I/O Y Y N Y
Charles Janeway Child Health Centre (St John’s, Newfoundland)
8 18 2 2 0 O Y Y N Y
included 96 full-time equivalent (FTE) neonatologists, 76 FTE housestaff (including clinical assistants, neonatal fellows, and pe-diatric residents), and 31 FTE neonatal nurse practitioners/clinical nurse specialists. Three NICUs did not employ housestaff, and only 6 NICUs used neonatal nurse practitioners/clinical nurse specialists. Four NICUs admitted only outborn infants. General surgery was available in 13 hospitals, cardiac surgery in 9 tals, extracorporeal membrane oxygenation (ECMO) in 3 hospi-tals, and cryotherapy/laser therapy in 11 hospitals. In some hos-pitals, infants needing general surgery and cardiac surgery were admitted to surgical or pediatric intensive care units instead of NICUs.
Study Population
The study population included 20 488 admissions to the 17 NICUs participating in the Canadian NICU Network during a 22-month period from January 8, 1996 to October 31, 1997 (Table 2). An admission was defined as stay in the NICU for at least 24 hours or death/transfer to another NICU within 24 hours. Eleven admissions were not included because the patients were not yet discharged from hospital at the time the database was closed on June 30, 1998. Readmissions and transfers were tracked as data from the same infant. After accounting for readmissions and trans-fers, there were 19 507 infants among the 20 488 admissions.
Data Abstraction
Trained research assistants abstracted patient information from the charts of the mothers and infants at each participating hospital on a daily basis. Data were directly entered into laptop computers at the bedside, using a customized data entry program with built-in error checking and a standard manual of operations and definitions. Data were electronically transmitted to the Center for Community Health and Health Evaluation Research, at the British Columbia Research Institute for Children’s and Women’s Health, for verification. Site research assistants rechecked potential data errors. Data management was conducted by the Center for Com-munity Health and Health Evaluation Research in concert with a steering committee comprising experienced researchers and neo-natologists representing each of the 5 geographic regions (British Columbia, Prairie provinces, Ontario, Quebec, and Atlantic prov-inces) in Canada, and with site investigators representing each of the 17 participating hospitals. Patient information was collected until death or discharge from the NICU. Patients transferred to another hospital were tracked until death or discharge home and outcome information was collected. Data analysis was performed using each infant rather than each admission.
Patient Information
Patient information included demographic information, ante-natal history, mode of delivery and problems at delivery, status of infant and problems at birth, illness severity (Clinical Risk Index for Babies [CRIB],10 Score for Neonatal Acute Physiology
[SNAP],11 and Score for Neonatal Acute Physiology-Version II
[SNAP-II]12), therapeutic intensity (Neonatal Therapeutic
Inten-sity Scoring System [NTISS]13), selected NICU practices and
pro-cedures, use of technology and resources, and selected patient outcomes. Information on outcomes of all live-born deliveries
from 22 to 25 weeks of gestational age (GA) was also obtained at participating hospitals. Transport teams were asked to complete the Alberta Neonatal Transport Score14when the transport team
first arrived at the transferring hospital and immediately after the transport team arrived at the destination hospital.
Variable Definitions
Study variables were defined according to the Canadian NICU Network SNAP Project Abstractor Manual. GA was defined as the best obstetric estimate based on early prenatal ultrasound, obstet-ric examination, and obstetobstet-ric history, unless the postnatal pedi-atric estimate of gestation differed from the obstetric estimate by ⬎2 weeks. In that case, the pediatric estimate of GA based on the Ballard Score15was used instead. An infant was defined as small
for GA (SGA) if the birth weight (BW) was less than the third percentile for GA according to the British Columbia provincial growth charts established by Whitfield16in 1992 for the Canadian
population. Prenatal care was defined as receipt of pregnancy-related care from a physician on at least one occasion (not pregnancy-related to a visit for diagnosis of pregnancy) during pregnancy. SNAP-II12
is a neonatal illness severity score calculated from 6 empirically weighted physiologic measurements made during the first 12 hours of admission to the NICU. NTISS13is a score of neonatal
therapeutic intensity calculated from a checklist of 63 NICU ther-apies used in a 24-hour period, weighted according to invasive-ness and cost. Chronic lung disease (CLD) was defined as oxygen dependency at 36 weeks’ corrected GA (CGA) for an infant who was born atⱕ32 weeks’ gestation.17Intraventricular hemorrhage
(IVH) was defined according to the criteria of Papile et al18from
head ultrasound performed before 14 days of life. Necrotizing enterocolitis (NEC) was defined according to the criteria of Bell et al19 (stage 2 or higher) and was classified as medical (clinical
symptoms and signs plus evidence of pneumatosis on abdominal radiographs) or surgical (histologic evidence of NEC on surgical specimen of intestine). Retinopathy of prematurity (ROP) was defined according to the International Classification for Retinop-athy of Prematurity20 and the Reese Classification of cicatrical
disease.21Nosocomial infection was defined using blood and
ce-rebrospinal fluid (CSF) culture results according to criteria by Freeman et al.22Patent ductus arteriosus (PDA) was defined as
clinical diagnosis plus treatment with indomethacin or surgical ligation or both. Seizures were defined as clinically significant episodes witnessed by a nurse or physician and for which anti-convulsant treatment was given. Congenital anomalies were clas-sified according to theInternational Classification of Diseases, Ninth Revisionof the World Health Organization.23
RESULTS Patient Profile
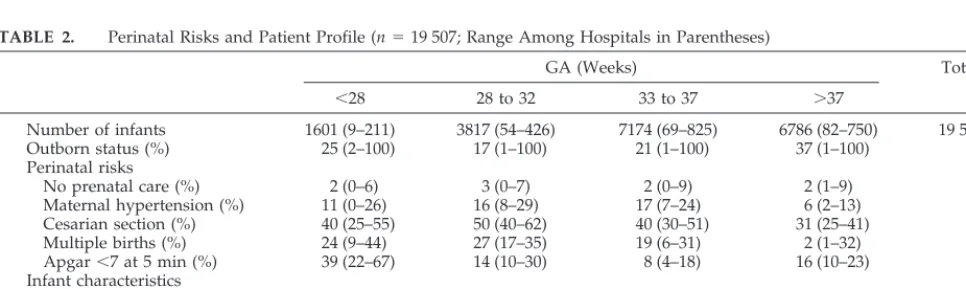
Table 2 shows the perinatal risks and patient char-acteristics of the study population. Missing data for each variable ranged from .6% to 2% (except for prenatal care [6%] and maternal hypertension [7%]). The mean number of annual admissions to a partic-ipating NICU was 657 (range: 133-1129). Overall,
TABLE 2. Perinatal Risks and Patient Profile (n⫽19 507; Range Among Hospitals in Parentheses)
GA (Weeks) Total
⬍28 28 to 32 33 to 37 ⬎37
Number of infants 1601 (9–211) 3817 (54–426) 7174 (69–825) 6786 (82–750) 19 507
Outborn status (%) 25 (2–100) 17 (1–100) 21 (1–100) 37 (1–100) 26
Perinatal risks
No prenatal care (%) 2 (0–6) 3 (0–7) 2 (0–9) 2 (1–9) 2
Maternal hypertension (%) 11 (0–26) 16 (8–29) 17 (7–24) 6 (2–13) 13
Cesarian section (%) 40 (25–55) 50 (40–62) 40 (30–51) 31 (25–41) 39
Multiple births (%) 24 (9–44) 27 (17–35) 19 (6–31) 2 (1–32) 15
Apgar⬍7 at 5 min (%) 39 (22–67) 14 (10–30) 8 (4–18) 16 (10–23) 15
Infant characteristics
Male (%) 54 (44–63) 57 (47–63) 56 (52–64) 59 (55–72) 58
SGA (%) 4 (0–9) 5 (0–10) 4.3 (2–8) 4 (3–6) 4
26% of infants admitted were outborn, with the high-est prevalence among term infants (37%).
BW Distribution
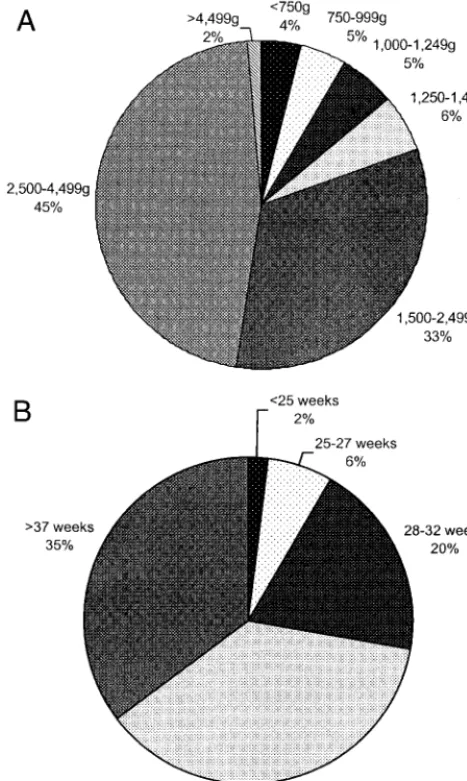
Figure 1A shows the distribution of all infants admitted by BW. Fifty-three percent (n⫽9361) were ⬍2500 g of BW (low BW) and 20% (n⫽ 3779) were ⬍1500 g of BW (VLBW).
GA Distribution
Figure 1B shows the distribution of all infants ad-mitted by GA. Sixty-five percent (n ⫽ 12 592) were preterm (⬍38 weeks’ GA) and 2% (n ⫽ 396) were ⱕ24 weeks’ GA.
Perinatal Risks Prenatal Care
Two percent (range: 1%– 8%) of mothers with in-fants admitted to the NICU received no prenatal care before delivery.
Maternal Hypertension/Preeclampsia
Maternal hypertension was reported in 13% of infants admitted to the NICU. The prevalence among
preterm infants was 2.5 times higher than among term infants.
Antenatal Steroids
Overall, 58% of infants ⱕ34 weeks’ GA received antenatal steroids. There was wide variation in ante-natal steroid use among participating centers (range: 23%–76%). Among those who received antenatal ste-roid treatment, 61% received a complete course of 2 doses before delivery.
Birth Presentation
The prevalence of breech presentation increased with decreasing GA (5% at⬎37 weeks’ GA, 16% at 33–37 weeks’ GA, 27% at 28 –32 weeks’ GA, and 34% at⬍28 weeks’ GA).
Mode of Delivery
The overall cesarean section rate was 39%. Deliv-ery by cesarean section was most prevalent among infants between 28 and 32 weeks’ GA (50%) and least prevalent among term infants (31%) and infantsⱕ24 weeks’ GA (21%).
Multiple Births
Multiple birth was most prevalent among infants ⬍33 weeks’ GA (26%) and least prevalent among term infants (1.7%).
Apgar Score Less Than Seven at Five Minutes
Fifteen percent of infants had Apgar scores⬍7 at 5 minutes. The prevalence was highest among infants ⬍28 weeks’ GA (39%) and⬎37 weeks’ GA (16%).
Infant Characteristics Sex
More males (58%) than females were admitted to an NICU.
SGA
Four percent of all admissions were SGA (weight less than the third percentile for GA). The prevalence was highest among infants at 28 to 32 weeks’ GA (5%).
Congenital Anomalies
Overall prevalence of congenital anomalies was 14%. The prevalence among term infants was 2.2 times that among infantsⱕ28 weeks’ GA.
Admission Illness Severity
Mean admission day SNAP-II12was 6.9 (Table 3).
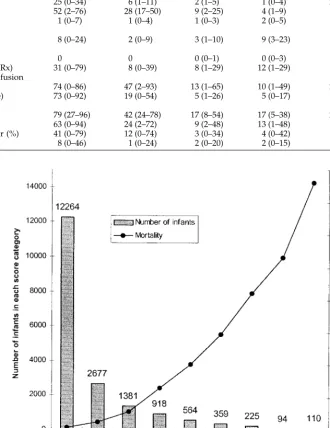
Mean admission day illness severity was lowest among infants at 33 to 37 weeks’ GA (SNAP-II: 4.2), but increased with higher (SNAP-II: 5.0 at ⬎37 weeks’ GA) and lower GA groups (SNAP-II: 21.5 at ⬍28 weeks’ GA). The mortality rate increased with increasing perinatal extension of SNAP-II12 (Fig 2).
Survival to Discharge From NICU
Overall, 96% (range: 89%–99%) of patients admit-ted to an NICU survived until discharge. Table 3 shows illness severity and selected practices and out-comes (by GA) for all NICU infants. The prevalence Fig 1. A, NICU population distribution by BW. B, NICU
of missing data for each variable ranged from .6% to 2%. Figure 3 shows survival of infants admitted to the NICU until discharge by GA of the infant. Of admissions to NICUs, there were no survivors (n ⫽
0/5) ⬍22 weeks’ GA. Intercenter variations in sur-vival rates were largest among infants ⱕ24 weeks’ GA (50% variation) and decreased with increasing GA.
Selected Outcomes and Practices
Bacterial Infection
Seven percent of all infants had at least one epi-sode of bacterial infection proven by positive blood or CSF culture (Table 3). Prevalence was highest among infants ⬍28 weeks’ GA (30%) and lowest among infants 33 to 37 weeks’ GA (3%). However, Fig 2. Mortality rate in the NICU
re-lated to admission day perinatal exten-sion of SNAP-II.
TABLE 3. Illness Severity: Selected Practices and Outcomes (n⫽19 507; Range Among Centers in Parentheses)
GA (Weeks) Total
⬍28 28 to 32 33 to 37 ⬎37
Illness severity and mortality
Mean admission SNAP-II 22 (8–32) 9 (5–13) 4 (1–8) 5 (2–9) 7
Mortality (%) 25 (14–44) 4 (1–12) 2 (0–9) 2 (0–9) 5
Bacterial infection/treatment
Infants with positive blood culture (%) 30 (0–81) 11 (1–50) 3 (1–20) 4 (0–13) 7
Infants with positive CSF culture (%) 4 (0–14) 1 (0–5) 0 (1–3) 0 (0–1) 1
Infection episodes/100 patient d 1 (0–5) 1 (0–1) 0 (0–1) 0 (0–1) 1
% treated at least once with antibiotic 89 (42–97) 87 (57–98) 67 (33–88) 74 (45–83) 75 Respiratory morbidity/support
Pneumothorax (%) 6 (0–19) 2 (0–6) 3 (0–9) 6 (2–13) 4
Assisted respiration (%) 94 (64–100) 69 (47–93) 32 (16–78) 28 (8–61) 43
Ventilated d (mean)/patient 25 (0–34) 6 (1–11) 2 (1–5) 1 (0–4) 21
Surfactant treatment (%) 52 (2–76) 28 (17–50) 9 (2–25) 4 (1–9) 14
Nitric oxide treatment (%) 1 (0–7) 1 (0–4) 1 (0–3) 2 (0–5) 1
Central nervous system
Seizures (%) 8 (0–24) 2 (0–9) 3 (1–10) 9 (3–23) 5
ECMO/surgery
ECMO treatment (%) 0 0 0 (0–1) 0 (0–3) 0
Surgery (%; excluding laser/cryo Rx) 31 (0–79) 8 (0–39) 8 (1–29) 12 (1–29) 11 Parenteral nutrition and blood transfusion
Parenteral nutrition (% infants) 74 (0–86) 47 (2–93) 13 (1–65) 10 (1–49) 24 Blood transfusion (% at least once) 73 (0–92) 19 (0–54) 5 (1–26) 5 (0–17) 13 Indwelling catheters
Arterial catheter (%) 79 (27–96) 42 (24–78) 17 (8–54) 17 (5–38) 27
Umbilical venous catheter (%) 63 (0–94) 24 (2–72) 9 (2–48) 13 (1–48) 18
Percutaneous long venous catheter (%) 41 (0–79) 12 (0–74) 3 (0–34) 4 (0–42) 8
adjustment for duration of hospitalization (ie, epi-sodes of infection per 100 NICU patient days) signif-icantly reduced the difference between the different GA groups. Only 25% of infants did not receive antibiotics at least once during their stay in the NICU.
Respiratory Support
Forty-three percent of all NICU infants received assisted respiratory support (including mechanical ventilation and continuous positive airway pres-sure). The mean duration of assisted respiratory sup-port increased with decreasing GA.
Surfactant Treatment
Surfactant use was most prevalent among the most preterm infants (52% at ⬍28 weeks’ GA) and de-creased with increasing GA (4% at term GA).
Nitric Oxide Treatment
Nitric oxide was given to 150 term infants (2%) and to 102 preterm infants (1%)⬍37 weeks’ GA.
Pneumothorax
Pneumothorax occurred in 4% of infants but was most prevalent among term infants (6%) and infants ⬍28 weeks’ GA (6%).
ECMO
ECMO was only used in infants over 32 weeks’ GA. Sixty-six percent of the infants who received ECMO were⬎37 weeks’ GA.
Surgery
Surgery (excluding therapy for ROP) was per-formed in 11% of NICU infants. Prevalence was highest among infants ⬍28 weeks’ GA (31%) and lowest among infants 28 to 37 weeks’ GA (8%).
Parenteral Nutrition
Parenteral nutrition was used in 24% of all NICU infants but use was most prevalent among infants ⬍28 weeks’ GA (74%).
Blood Transfusion
Thirteen percent of infants received at least 1 blood transfusion, with the prevalence rising from 5% in term infants to 73% in infants⬍28 weeks’ GA.
Indwelling Catheter Use
Arterial catheters were used in 27% of all infants in the NICU. Umbilical venous catheters were used in 18%, percutaneous long venous catheters in 8%, and surgically inserted central venous cathethers in 2% of NICU infants. Use of all types of catheters was more prevalent among infants of lower GA groups.
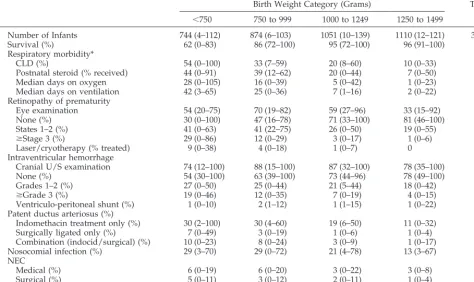
Selected Outcomes of VLBW (<1500 g of BW) Infants Table 4 shows selected practices and outcomes for NICU infants⬍1500 g of BW. Prevalence of missing data for each variable ranged from .05% to 2%.
Survival Rate
Survival rate for infants admitted to the NICU was 98% for infantsⱖ1500 g of BW, but 31% for infants ⬍500 g of BW.
CLD
Twenty-six percent of infants surviving to 36 weeks’ CGA had CLD. The prevalence was inversely related to BW. Twenty-five percent (range: 1%– 41%) of infants received postnatal steroids for CLD, and the prevalence increased with decreasing GA. Dura-tion (days) of assisted ventilaDura-tion increased with de-creasing BW. A similar pattern was noted with du-ration (days) of supplemental oxygen.
ROP
Fifty-three percent of infants⬍1500 g of BW had eye examinations for ROP before discharge or trans-fer from the NICU. Results of eye examinations con-ducted after retrotransfer to a community facility were not available. Of those with eye examination results available, 43% of infants⬍1500 g of BW de-veloped ROP, but only 11% were stage 3 or higher, and only 3% required treatment. The prevalence of ROP and treatment for ROP increased with decreas-ing GA.
IVH
Eighty-two percent of infants⬍1500 g of BW had cranial ultrasound examination before 14 days of life. Overall prevalence of IVH (any grade) was 32%. Grade 3 or higher IVH occurred in 10% and the prevalence increased with decreasing BW. Treatment with surgical shunts was required in 1%.
PDA
Twenty-eight percent of infants developed PDA requiring treatment. Seventy-five percent were
treated with indomethacin alone, 8% with surgical ligation alone, and 17% required both indomethacin and surgical ligation. Infants with lower BW were more likely to be treated surgically.
Nosocomial Infection
Twenty-two percent of infants had at least 1 epi-sode of nosocomial infection. The infection rate among infants ⬍1000 g of BW was 2.2 times that among infants 1250 to 1499 g of BW.
NEC
Four percent of infants developed medical NEC and 3% developed surgical NEC. The prevalence was higher in infants of lower GA.
Survival Without Major Morbidity (⬎Grade 3 IVH, CLD, NEC, or⬎Grade 3 ROP)
Sixty-nine percent of infants⬍1500 g of BW who survived until discharge did not have major morbid-ity. The prevalence was 37% at⬍750 g of BW, 56% at 750 to 999 g of BW, 75% at 1000 to 1249 g of BW, and 86% at 1250 to 1499 g of BW.
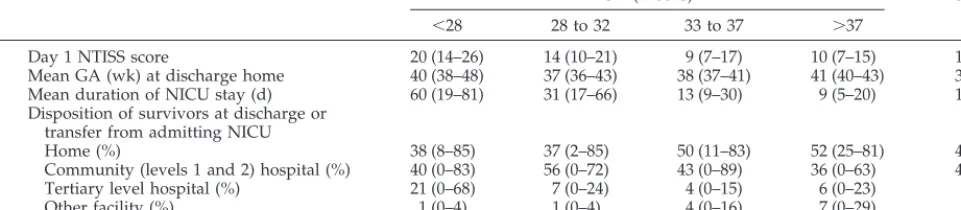
Resource Consumption and Discharge Disposition Table 5 shows resource consumption by GA group. Prevalence of missing data for each variable was⬍1%.
NTISS Score
The mean NTISS score was 10 for term infants and increased to 20 among infants ⬍28 weeks’ GA (see Table 5).
TABLE 4. Interventions and Outcomes of VLBW Infants (⬍1500 g BW;n⫽3779; Range Among Centers in Parentheses)
Birth Weight Category (Grams) Total
⬍750 750 to 999 1000 to 1249 1250 to 1499
Number of Infants 744 (4–112) 874 (6–103) 1051 (10–139) 1110 (12–121) 3779
Survival (%) 62 (0–83) 86 (72–100) 95 (72–100) 96 (91–100) 87
Respiratory morbidity*
CLD (%) 54 (0–100) 33 (7–59) 20 (8–60) 10 (0–33) 26
Postnatal steroid (% received) 44 (0–91) 39 (12–62) 20 (0–44) 7 (0–50) 25
Median days on oxygen 28 (0–105) 16 (0–39) 5 (0–42) 1 (0–23) 5
Median days on ventilation 42 (3–65) 25 (0–36) 7 (1–16) 2 (0–22) 7
Retinopathy of prematurity
Eye examination 54 (20–75) 70 (19–82) 59 (27–96) 33 (15–92) 53
None (%) 30 (0–100) 47 (16–78) 71 (33–100) 81 (46–100) 5
States 1–2 (%) 41 (0–63) 41 (22–75) 26 (0–50) 19 (0–55) 33
ⱖStage 3 (%) 29 (0–86) 12 (0–29) 3 (0–17) 1 (0–6) 11
Laser/cryotherapy (% treated) 9 (0–38) 4 (0–18) 1 (0–7) 0 3
Intraventricular hemorrhage
Cranial U/S examination 74 (12–100) 88 (15–100) 87 (32–100) 78 (35–100) 82
None (%) 54 (30–100) 63 (39–100) 73 (44–96) 78 (49–100) 68
Grades 1–2 (%) 27 (0–50) 25 (0–44) 21 (5–44) 18 (0–42) 22
ⱖGrade 3 (%) 19 (0–46) 12 (0–35) 7 (0–19) 4 (0–15) 10
Ventriculo-peritoneal shunt (%) 1 (0–10) 2 (1–12) 1 (1–15) 1 (0–22) 1
Patent ductus arteriosus (%)
Indomethacin treatment only (%) 30 (2–100) 30 (4–60) 19 (6–50) 11 (0–32) 21
Surgically ligated only (%) 7 (0–49) 3 (0–19) 1 (0–6) 1 (0–4) 2
Combination (indocid/surgical) (%) 10 (0–23) 8 (0–24) 3 (0–9) 1 (0–17) 5
Nosocomial infection (%) 29 (3–70) 29 (0–72) 21 (4–78) 13 (3–67) 22
NEC
Medical (%) 6 (0–19) 6 (0–20) 3 (0–22) 3 (0–8) 4
Surgical (%) 5 (0–11) 3 (0–12) 2 (0–11) 1 (0–4) 3
Survival without major morbidity† (%) 37 (0–71) 56 (39–80) 75 (38–92) 86 (58–100) 69
* CLD was defined as oxygen dependency at 36 weeks’ CGA for infants born atⱕ32 weeks’ GA (n⫽3494). Complete data were available for 3000 infants.
Mean Duration of NICU Stay
The mean duration of NICU stay until discharge home or transfer to a community hospital was 19 days (rising from 9 days for term infants to 60 days for infants⬍28 weeks’ GA).
Mean GA at Discharge
Mean GA at discharge was 39 weeks’ CGA. It was lowest (37 weeks’ CGA) for infants born at 29 to 36 weeks’ GA and increased with lower (42 weeks’ CGA for infantsⱕ24 weeks’ GA at birth) and higher (41 weeks’ CGA for infants born at term) GA.
Disposition at Discharge
Forty-seven percent of NICU infants were dis-charged from the hospital. Forty-three percent were transferred to a community hospital and 6% were transferred to another level 3 hospital.
Special Support at Discharge
At discharge home, 1% of infants were on some form of therapy with diuretics, methylxanthines, supplemental oxygen, or assisted respiration (contin-uous positive airway pressure or intermittent man-datory ventilation).
DISCUSSION
Canada has a highly regionalized system of neo-natal–perinatal care.24Tertiary level NICU and
peri-natal services are mostly located at university-affili-ated teaching hospitals in major cities and serve distinct geographic regions. Regional tertiary level institutions coordinate care with a network of pri-mary and secondary level facilities throughout each geographic region. Centralized transport systems are coordinated either by regional tertiary level institu-tions or through a single provincial transport coor-dinating service. Health services are provided through a tax-funded universal health insurance sys-tem. We found that 98% of all NICU admissions received prenatal care before delivery, nearly two thirds of NICU admissions (65%) were for preterm infants and nearly one half of NICU admissions (43%) were retrotransferred to a community facility before discharge home. These results suggest that Canadians generally have good access to a highly organized perinatal health care (including preven-tive prenatal care) system, referral NICU facilities seem to be appropriately used primarily for preterm or very sick infants requiring tertiary level care, and
community and tertiary level neonatal–perinatal fa-cilities seem to be well-coordinated in their referral and retrotransfer functions to provide as much care as possible closer to home.
The Canadian NICU Network includes 75% of tertiary level NICU beds in Canada, and the NICUs are organized in a highly regionalized geographic referral system. Our dataset is, therefore, unique in being able to yield population-based information about patient outcomes linked to clinical practice, individual patient risks, and illness severity. The de-mographic profile of patients admitted to Canadian NICUs reveals several points of interest. The pre-dominance of male infants (57.5%) admitted to Ca-nadian NICUs contrasts with previous reports by the National Institute of Child Health and Human
De-velopment (NICHD) Neonatal Network (49%
male)2,7 and the Vermont-Oxford Trials Network
(VOTN; 51% male).25 Because our data are
popula-tion-based (whereas the US reports are not), it is likely that they more accurately reflect the higher morbidity rates associated with male newborn in-fants.26Although 7 years separate the reports of the
Canadian NICU Network (1996/1997) and the NICHD Neonatal Network (1989/1990 and 1993/ 1994),2,7 the BW-specific distribution of infants
⬍1500 g of BW who were admitted to the NICU are strikingly similar (Canada vs NICHD 1989/1990 and 1993/1994, respectively, for ⬍750 g of BW: 19% vs 18%–21%; for 750 –999 g of BW: 23% vs 23%–23%; for 1000 –1249 g of BW: 28% vs 28%–25%; for 1250 –1499 g of BW: 29% vs 31%–30%), and suggests that our ability to delay preterm delivery has not changed much during this time. A large percentage (20%) of term infants treated in the NICU had major congen-ital anomalies, which represents a significant burden on NICU resources and utilization.
Outcomes of the Canadian NICU Network com-pare favorably with those previously published by the NICHD Neonatal Network,7the VOTN,6,25
and the Australia-New Zealand NICU Network (ANZNN).27 BW-specific survival of the Canadian
NICU Network and the ANZNN are similar and show significant improvement over those of the NICHD Neonatal Network2,7and VOTN.6,25
Mortal-ity of infants⬎32 weeks’ GA is very low (2%). Also striking are improvements in survival of the smallest infants⬍750 g of BW (survival rate 62% Canada vs 49% NICHD Neonatal Network). These differences are most likely the result of improvements in
neona-TABLE 5. Resource Use and Discharge Disposition (n⫽19 507)
GA (Weeks) Total
⬍28 28 to 32 33 to 37 ⬎37
Day 1 NTISS score 20 (14–26) 14 (10–21) 9 (7–17) 10 (7–15) 11
Mean GA (wk) at discharge home 40 (38–48) 37 (36–43) 38 (37–41) 41 (40–43) 39 Mean duration of NICU stay (d) 60 (19–81) 31 (17–66) 13 (9–30) 9 (5–20) 19 Disposition of survivors at discharge or
transfer from admitting NICU
Home (%) 38 (8–85) 37 (2–85) 50 (11–83) 52 (25–81) 47
Community (levels 1 and 2) hospital (%) 40 (0–83) 56 (0–72) 43 (0–89) 36 (0–63) 43
Tertiary level hospital (%) 21 (0–68) 7 (0–24) 4 (0–15) 6 (0–23) 6
tal care over time but may also be attributable to changes in organization, staffing, training, and atti-tudes toward active treatment of extremely low BW infants. Therefore, it is important to report trends over time. It is noteworthy that more recent reports from the Canadian NICU Network, ANZNN,27 and
NICHD Neonatal Network7 reported significantly
higher BW-specific prevalence of CLD than did ear-lier reports of the NICHD Neonatal Network2 and
VOTN.25 These difference are likely attributable to
improved survival of preterm infants but may also be attributable to differences in clinical practice over time (eg, higher threshold for discontinuing oxygen, surfactant, high-frequency ventilation, and postnatal steroid use). It is unclear whether, and how, inter-country differences in health care systems, socioeco-nomic status, cultural factors, and social income dis-parities impact on NICU outcomes.
Benchmarking using illness severity adjustment is critical for studying variations in outcomes. Residual variation, after adjusting both for individual patient risk factors and illness severity, may then be used to identify differences in care, which may increase costs but not improve outcomes. Clinical trials of efficacy can then be conducted to test these findings. Conse-quently, valid comparisons of outcomes can be used not only for audit of NICU care, but also for improv-ing patient outcomes and reducimprov-ing costs. SNAP-II measures illness severity of newborn infants admit-ted to the NICU and is highly predictive of NICU mortality and morbidity.12,28 It was derived using
the Canadian NICU Network cohort and validated in both the Canadian NICU Network cohort and in 2 separate NICU cohorts in the United States.12
SNAP-II is, therefore, highly suitable for benchmark-ing NICU outcomes. In future publications, we will adjust outcomes using individual patient risks and SNAP-II and examine risks associated with poor out-comes.
Although Canada has a universal health insurance system and a highly regionalized system of neona-tal–perinatal care, variations in patterns of NICU usage and of patient outcomes among Canadian NICUs seem to be as wide as those reported by the NICHD Neonatal Network2,7and VOTN.6,25For
in-stance, annual admissions to Canadian NICU Net-work units ranged from 134 to 1129 infants, and NICU survival varied between centers from 89% to 99%. This suggests that small area variations in the practices of groups of physicians persist even with universal health care access and a uniform health care financing system. Variations in NICUs are im-portant because they are natural experiments, reflect-ing the practice patterns of small groups of physi-cians. Wennberg et al29 showed that small area
variations can be used to study the relative effective-ness of differing medical practices and technologies. In future publications, we will examine the sources of variation in outcome among Canadian NICUs to gain insight into ways of improving care for NICU infants.
This study also demonstrates the impact of chang-ing technology on clinical practice and the need for evidence-based practice guidelines. Of interest nitric
oxide treatment was given to 150 term and 102 pre-term infants, although randomized, controlled trials have only demonstrated its safety and efficacy in term infants.30 In contrast, the use of antenatal
ste-roids in infants⬍34 weeks’ GA varied from 23% to 76% among participating NICUs, although its effi-cacy was unequivocally demonstrated over 25 years ago.31 Even established technologies (eg, cranial
ul-trasound screening) reveal large variations in usage patterns, which show the lack of uniform criteria for optimal use. Evidence-based practice guidelines (eg, criteria for cranial ultrasound screening) need to be articulated so that clinical practice can be made more coherent. Monitoring practice patterns longitudi-nally can provide important insights into identifying clinical practice trends that may be inconsistent with the existing evidence. Interventions can then be tar-geted to change practices that may not improve out-comes or reduce costs.
Longitudinal studies on a population basis act as sentinels to changes in disease and practice patterns. They provide an objective way of auditing care and outcomes on an ongoing basis and can provide im-portant insights into how to improve efficacy and efficiency of care. They provide useful information for planning research, allocating resources, and de-signing health and public policy. In this study, we successfully established a national NICU database and established population-based benchmarks for examining practice and outcome variation as well as the sources of variation. This database will also serve as a basis for longitudinal studies of NICU care in Canada for research, audit, and quality improve-ment. Using this database, we also previously devel-oped and validated SNAP-II12,28as a benchmarking
instrument for measuring illness severity in newborn infants.
APPENDIX
General Hospital, Ottawa, Ontario); and Robin Whyte, MBBS, FRCPC (Izaak Walton Killam-Grace Health Centre for Women, Children and Families, Halifax, Nova Scotia).
Coordinating Centre: Li-Yin Chien, MPH, ScD; Joanna Sale, MSc; Herbert Chan, MSc; and Shawn Stewart, BA.
ACKNOWLEDGMENTS
This study was supported by Grants 40503 and 00152 from the Medical Research Council of Canada.
Additional funding was provided by the Children’s Hospital Foundation of British Columbia; Calgary Regional Health Author-ity; Dalhousie University Neonatal-Perinatal Research Fund; Di-vision of Neonatology, Children’s Hospital of Eastern Ontario; Child Health Program, Health Care Corporation of St John’s; the Neonatology Program, Hospital for Sick Children; Lawson Re-search Institute; Midland Walwyn Capital Inc; Division of Neona-tology, Hamilton Health Sciences Corporation; Mount Sinai Hos-pital; North York General Hospital Foundation; Saint Joseph’s Health Center; University of Saskatchewan Neonatal Research Fund; University of Western Ontario; and Women’s College Hos-pital.
REFERENCES
1. Stahlman MT. Newborn intensive care: success or failure?J Pediatr. 1984;105:162–167
2. Hack M, Wright LL, Shankaran S, et al. Very low birth weight outcomes of the National Institute of Child Health and Human Development Neonatal Network, November 1989 to October 1990.Am J Obstet Gy-necol. 1995;172:457– 464
3. Horwood SP, Boyle MP, Torrance GW, Sinclair JC. Mortality and mor-bidity of 500 to 1,499 gram birth weight infants live-born to residents of a defined geographic region before and after neonatal intensive care. Pediatrics. 1982;69:613– 620
4. Lee KS, Paneth N, Gartner LM, Pearlman MA, Gruss L. Neonatal mortality: an analysis of the recent improvement in the United States. Am J Public Health. 1980;70:15–21
5. Williams RL, Chen PM. Identifying the sources of the recent decline in perinatal mortality rates in California.N Engl J Med. 1982;306:207–214 6. Horbar JD, Badger J, Lewit EM, Rogowski J, Shiono PH. Hospital and
patient characteristics associated with variation in 28-day mortality rates for very low birth weight infants.Pediatrics. 1997;99:149 –156 7. Stevenson DK, Wright LL, Lemons JA, et al. Very low birth weight
outcomes of the National Institute of Child Health and Human Devel-opment Neonatal Research Network, January 1993 through December 1994.Am J Obstet Gynecol. 1998;179:1632–1639
8. Available at: http://www.statcan.ca/english/Pgdb/People/population/ demo02.htm
9. Available at: http://www.statcan.ca/english/Pgdb/People/population/ demo04a.htm
10. Tarnow-Mordi WO, Parry G, Moore J, et al. The CRIB (Clinical Risk Index for Babies) score: a tool for assessing initial neonatal risk and comparing performance of neonatal intensive care units.Lancet. 1993; 342:193–198
11. Richardson DK, Gray JE, McCormick MC, Workman K, Goldman DA. Score for neonatal acute physiology: a physiologic severity index for neonatal intensive care.Pediatrics. 1993;91:617– 623
12. Richardson DK, Corcoran JD, Escobar GJ, Lee SK, for the Canadian NICU Network, the Kaiser Permanente Neonatal Minimum Data Set Wide Area Network, and the SNAP-II Study Group. SNAP-II and SNAPPE-II: simplified newborn illness severity and mortality risk scores.J Pediatr. 2000;137
13. Gray JE, Richardson DK, McCormick MC, Workman-Daniels K, Gold-man DA. Neonatal therapeutic intervention scoring system (NTISS): a therapy-based severity of illness assessment tool.Pediatrics. 1992;90: 561–567
14. Shorten D, Fox M, Molesky M. Validation of the Alberta Neonatal Transport Stabilization Score (ANTSS). Presented at the Western Peri-natal Research Meeting; February 16 –18, 1995; Banff, Alberta, Canada 15. Ballard JL, Novak KK, Driver M. A simplified assessment of fetal
maturation of newly born infants.J Pediatr. 1979;95:769 –774 16. Whitfield M. British Columbia Provincial Growth Chart. Vancouver,
Canada: British Columbia Children’s Hospital; 1992
17. Shennan AT, Dunn MS, Ohlsson A, Lennox K, Hoskins EM. Abnormal pulmonary outcomes in preterm infants: prediction from oxygen re-quirement in the neonatal period.Pediatrics. 1988;82:527–532 18. Papile LA, Munsick-Bruno G, Schaefer A. Relationship of cerebral
intra-ventricular hemorrhage and early childhood handicaps.J Pediatr. 1983; 103:272–277
19. Bell MJ, Ternberg JL, Feigin RD, et al. Neonatal necrotizing enterocolitis. therapeutic decisions based on clinical staging.Ann Surg. 1987;187:1–7 20. American Academy of Pediatrics. Committee members: an international classification of retinopathy of prematurity.Pediatrics. 1984;74:127–133 21. Reese AB, King MJ, Owens WC. A classification of retrolental
fibropla-sia.Am J Opthalmol. 1953;36:1333
22. Freeman J, Epstein MF, Smith NE, Platt R, Sidebottom DG, Goldman DA. Extra hospital stay and antibiotic usage with nocosomial coagulase negative staphylococcal bacteremia in two neonatal intensive care unit populations.Am J Dis Child. 1990;144:324 –329
23. World Health Organization.International Classification of Diseases, Ninth Revision. Geneva, Switzerland: World Health Organization; 1975 24. Ontario Perinatal Mortality Study Committee.Second Report of the
Peri-natal Mortality Study in Ten University Teaching Hospitals in Ontario, Canada. Ontario, Canada: Ontario Department of Health; 1967 25. The Investigators of the Vermont-Oxford Trials Network. Very low
birth weight outcomes for 1990.Pediatrics. 1993;91:540 –545
26. Miller HC, Futrakul P. Birth weight, gestational age and sex as deter-mining factors in the incidence of respiratory distress syndrome of prematurely born infants.J Pediatr. 1968;72:628 – 635
27. Donoghue D.AIHW National Perinatal Statistics Unit. Sydney, Australia: Australia and New Zealand Neonatal Network 1995, Neonatal Network Series 2; 1997. ISSN 1326-012X, AIHW catalogue PER 5
28. Chien LY, Lee SK, Thiessen P, Whyte R, the Canadian NICU Network. Validation of the SNAP and SNAP-II on morbidity of infants less than 33 weeks gestational age.Pediatr Res. 1999;45:240A
29. Wennberg JE, Blowers L, Parker R, Gittelsohn AM. Changes in tonsil-lectomy rates associated with feedback and review.Pediatrics. 1977;59: 821– 826
30. Neonatal Inhaled Nitric Oxide Study Group. Inhaled nitric oxide in full-term and nearly full-term infants with hypoxic respiratory failure. N Engl J Med. 1997;336:597– 604
31. Liggins GC, Howie RN. A controlled trial of antepartum glucocorticoid treatment for the prevention of respiratory distress syndrome in pre-mature infants.Pediatrics. 1972;50:515–525
VA PLANS NO-PENALTY MEDICAL ERROR REPORTING
In a groundbreaking program, the nation’s 172 veterans hospitals hired NASA to do for medical safety what it does for airline safety: set up a system where errors can be reported without fear of penalty and use the information to make everyone safer . . . “The idea is to install safeguards against mistakes instead of laying blame,” said Dr James Bagian.
New York Times.May 31, 2000
DOI: 10.1542/peds.106.5.1070
2000;106;1070
Pediatrics
Robin Whyte, Li-Yin Chien, Joanna Sale and the Canadian NICU Network
Shoo K. Lee, Douglas D. McMillan, Arne Ohlsson, Margaret Pendray, Anne Synnes,
1997
−
Variations in Practice and Outcomes in the Canadian NICU Network: 1996
Services
Updated Information &
http://pediatrics.aappublications.org/content/106/5/1070
including high resolution figures, can be found at:
References
http://pediatrics.aappublications.org/content/106/5/1070#BIBL
This article cites 23 articles, 9 of which you can access for free at:
Subspecialty Collections
sub
http://www.aappublications.org/cgi/collection/fetus:newborn_infant_
Fetus/Newborn Infant
http://www.aappublications.org/cgi/collection/agency_abcs
Agency ABC's
following collection(s):
This article, along with others on similar topics, appears in the
Permissions & Licensing
http://www.aappublications.org/site/misc/Permissions.xhtml
in its entirety can be found online at:
Information about reproducing this article in parts (figures, tables) or
Reprints
http://www.aappublications.org/site/misc/reprints.xhtml
DOI: 10.1542/peds.106.5.1070
2000;106;1070
Pediatrics
Robin Whyte, Li-Yin Chien, Joanna Sale and the Canadian NICU Network
Shoo K. Lee, Douglas D. McMillan, Arne Ohlsson, Margaret Pendray, Anne Synnes,
1997
−
Variations in Practice and Outcomes in the Canadian NICU Network: 1996
http://pediatrics.aappublications.org/content/106/5/1070
located on the World Wide Web at:
The online version of this article, along with updated information and services, is
by the American Academy of Pediatrics. All rights reserved. Print ISSN: 1073-0397.