RESEARCH
A metric of the difference
between perception of security
and victimisation rates
Rafael Prieto Curiel
*and Steven Richard Bishop
Abstract
A person’s perception of the level of security at a specific location depends on many factors, including past experi-ences in that location, the actual crime suffered by the population and more. Thus, when the individual perception that a location is insecure becomes the general rule is when the perception of security becomes an attribute of the region rather than the fears of some of its individuals, hence the relevance of aggregating individual perceptions of security into a single regional perception of security. Residents of two different regions, which have the same levels of crime, of a similar nature, may have different perceptions of the level of security. The perception of security associated with a particular place is relevant by itself but is much more useful when compared to the perception of other regions or when the perception changes over time and hence a ranking of the perception levels from different places would be a useful tool. A metric is suggested here to determine first the regional perception of security from a location and then to quantify its relationship with different victimisation rates. We quantify the relationship between the percep-tion of security and different victimisapercep-tion rates, based on data obtained from Mexico through victimisapercep-tion surveys.
Keywords: Security, Perception, Ranking, Correlation, Kendall’s tau coefficient, Mexico
© The Author(s) 2016. This article is distributed under the terms of the Creative Commons Attribution 4.0 International License (http://creativecommons.org/licenses/by/4.0/), which permits unrestricted use, distribution, and reproduction in any medium, provided you give appropriate credit to the original author(s) and the source, provide a link to the Creative Commons license, and indicate if changes were made.
Background
The perception of security or insecurity might cause peo-ple to change their behaviour, for instance, by avoiding unnecessary risk when commuting back home Jackson and Gray (2010). Today, in our cities and countryside, the perception of security has become a serious issue, perhaps particularly for urban populations Carro et al. (2010). If the perception of security in a particular region is deemed to be out of line with actual victimisation rates, then this raises the question of what our policy mak-ers can do to alter this perception to create vibrant, and economically successful regions. Falsely based percep-tions affect the efficiency of the security systems, since governments are encouraged to spend resources, such as an increased number of police officers, or even intro-duce urban interventions, in places where people are more concerned, but not necessarily where action is most
needed or where it could have the greatest impact Grog-ger and Weatherford (1995).
In a particular region, people’s perception of the level of crime is formed by a number of factors where the first and most clear one is whether they were personally the actual victims of a crime: past victimisation almost doubles the odds ratio of a person having fear of crime Tseloni (2007). However, past victimisation is not the only factor that contributes to a person fearing crime or perceiving a region as insecure and one of the main rea-sons is that, fortunately, crime is a rare event. For exam-ple, the International Crime Victims Survey shows that less than 3% of the population from the surveyed coun-tries experiences a theft from person during the period of 1 year Tseloni et al. (2010), and rates are similarly low for other types of crime. Hence, more frequently a person experiences indirect victimisation via interactions with friends, neighbours or through media rather than experi-encing actual crime Gilchrist et al. (1998).
There are many other reasons which affect whether a person feels secure in terms of crime or not. It was
Open Access
*Correspondence: [email protected]
shown, for example, that some area characteristics, such as the economic level or the amount of people of age between 16 and 24, might act as a better predictor of fear of crime, even better than the actual crime rates Kershaw and Tseloni (2005). Another relevant factor to consider is the role that media plays in the fear of crime and perhaps we should also now include social media. It is estimated Chadee and Ditton (2005) that less than 1% of the crime features in the newspapers and that crimes of a sexual or a violent nature have a much higher probability to appear on the news Ditton and Duffy (1983). In fact, even though murder is one of the least frequent crimes, it makes up of nearly one-third of the crime stories in the newspapers Liska and Baccaglini (1990). Thus, crimes with a sexual or violent component might be perceived as being much more frequent than they actually are and hence perhaps feared more than they actually should be.
The perception of security and the fear of crime have been studied from many angles: from its social and psy-chological construction Farrall et al. (2000); its relation with the environment Brunton-Smith and Sturgis (2011); the impact of past victimisation to the current perception Hale et al. (1994); to more methodological aspects such as how the fear of crime is measured Farrall et al. (1997). In order to build models, one of the most common tools to understand the interactions are victimisation ori-ented surveys, such as the Crime Survey for England and Wales Office for National Statistics (2016) or the National Crime Victimization Survey (NCVS) in the United States Bureau of Justice Statistics (2016), which allow agencies and governments to obtain precise information about the fear of crime. These surveys can also cover aspects such as unreported crime, and obtain information on differ-ent levels with specified geographic areas and compare this with the reported crime. Such surveys have been available for more than 40 years and are now conducted in many countries to understand the local crime levels. Many conclusions have been drawn from victimisation surveys, for example, it was shown that more than half of the population said that they had been worried about being the victim of a crime sometime in the past Farrall et al. (1997); an increased fear of suffering a burglary was in fact correlated with the risk of suffering one Borooah and Carcach (1997); and minorities tend to be more fear-ful Brunton-Smith and Sturgis (2011).
The study of the fear of crime and the perception of security has many issues, which begin with the concept itself. Fear of crime and perception of security repre-sent conceptually distinct constructs, although they have
some similarities Wilcox Rountree and Land (1996),
especially in the way both concepts have been studied Farrall et al. (1997). A person, for example, might per-ceive his or her own neighbourhood as being insecure,
but at the same time might not be afraid of crime since the person does not consider themselves to be a potential target or considers that they have taken sufficient precau-tions to avoid being the victim, however, this is not the most common scenario.
This study relies on data from a victimisation survey conducted in Mexico INEGI (2014). It is based on the question “In terms of crime, do you consider your region to be secure or insecure?”, which is not exactly the same as the fear of crime. Although two different respondents might interpret the question differently, these differ-ences should not be regional and so we can compare the answers provided by the survey respondents across Mex-ico. From here onwards we will use the term perception of security to refer to the answers provided in the surveys.
We develop a metric for the perception of security and then study its relationship with victimisation rates. The technique is not constrained to Mexico (or to surveys for that matter) and hence, the approach will have wider applications.
A measure of the perception of security
To understand the perception of security attached to a particular region, we focus on the number of people sur-veyed that consider the region to be either secure or inse-cure, where the term region here might be as specific as a park or as general as a state. Typically in crime surveys, an individual might be asked whether a region is secure or not, so a binary answer is usually recorded. Other stud-ies about the fear of crime or the perception of security have been conducted and the techniques used strongly depend on the type of data that is used. For example, the Crime Survey for England and Wales Office for National Statistics (2016) considers questions such as “How safe do you feel walking alone in this area after dark?”, and the respondent has four different options: 1-very safe, 2-fairly safe, 3-a bit unsafe, and 4-very unsafe; these responses provide an ordinal variable (where the order matters) and, in order to combine different questions and answers into a single number, a common technique is to assign a num-ber to each response and sum them into a single fear rate Kershaw and Tseloni (2005), which might then be used in a statistical model Tseloni (2007).
Expressing the number of people who consider a region to be insecure as a ratio to the total number of people, produces a number between 0 and 1, where a value close to 0 means that the region is considered to be secure, and a value of close to 1 means that the region is considered to be insecure. Dividing our space (urban or otherwise) into a number of non-overlapping regions R1,R2,. . .,Rn ,
population from a region and it provides an estimate of the probability that if we randomly select a person from the region Rk, then he or she considers that region to be insecure and, if enough surveys were conducted in the region Rk, then that number sk is a good estimate of that probability.
This is a simple way to quantify the perception of security of a region, however, this number sk, by itself,
is not particularly useful in isolation, since we do not know what the norm is, so for example, if a region gives us sk =0.4, is that considered to be high or low percep-tion of security? It is much better to compare this num-ber against the equivalent estimates in other regions or compare this regional measure over time to see the effect of either changing crime numbers or changing police strategies.
The fact that we can compare the perception of security between two different regions is the crucial point since it allows us to quantify the perception in a mathematical way which we may then use in a modelling context.
Given a method to establish the perception of security allows us to then rank all regions in our space. Assume for the moment that the perception of security from each region is different, and let Sk∈ {R1,R2,. . .Rn} be the
unique region which occupies the k-th position on the ranking of the perception of security, so Sk reflects the perception of security of that region when compared to the other n−1 regions. The region Rj such that S1=Rj is considered the most insecure, since it occupies the first place in the ranking, and the region Rl such that Sn=Rl is considered the most secure, and is positioned in the last place of the ranking. Let S=(S1,S2,. . .Sn) be the rank-ing obtained from the security perception, startrank-ing from the one considered to be the least secure up to the one considered the most secure. Now, if the survey considers a different type of question (or questions) to determine the perception of security from the survey respondent, it is also possible to either transform the response into a binary variable or to assign a number based on the order of the response Kershaw and Tseloni (2005). By either recoding the response or by considering the sum, we may obtain a similar ranking of the perception of security S.
We can now compare the perception of security between two different regions and state that, if in the ranking S, the region Rk is listed before Rj then this means that the region Rk is considered to be less secure than Rj , so sk>sj. Thus, if we are considering n regions, then there are n(n−1)/2 comparisons by taking each pair of regions and selecting which of the two is considered to be the most secure and which the least.
Suppose that now we can express the rate in which the region Rk is victimised as vk. This has many interpreta-tions and depends on the type of crime and the time
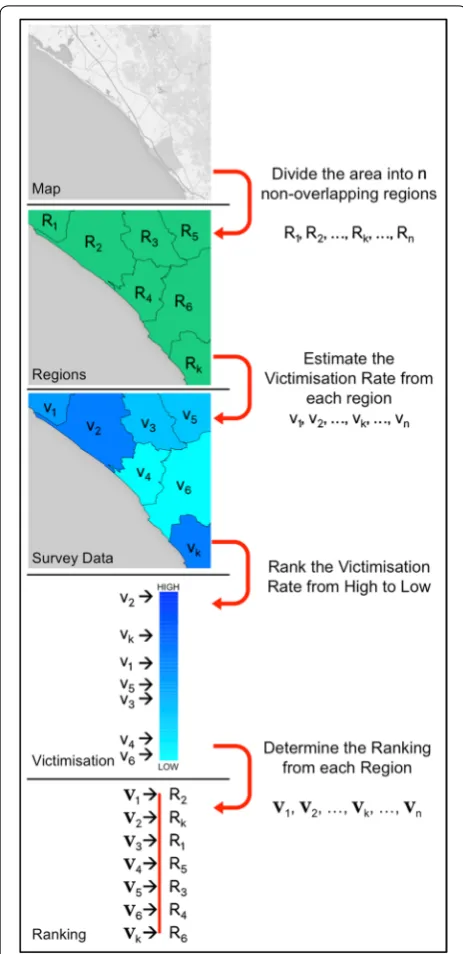
period considered, but let us suppose that vk represents the probability that a person suffers a particular type of crime, such as Robbery of a Person or Burglary, at least once, in a yearly period. Then vk provides information to compare two different regions and if vk >vj it means that the population in the region Rk suffers a higher prob-ability of being the victim of a crime than the region Rj for the type of crime considered. If we assume that the victimisation rate is different in every region, then it also provides a unique way to rank the n regions. Let Vk ∈ {R1,R2,. . .Rn} be the unique region which occupies the k-th position on the ranking of the victimisation rate. The region Rj such that V1=Rj has the highest victimi-sation rate and the region Rl such that Vn=Rl has the smallest victimisation rate. Let V =(V1,V2,. . .,Vn) be the ranking obtained from that victimisation rate, as an ordered list of the n regions, from the one with the high-est victimisation to the one with the lowhigh-est victimisa-tion rates. The process of dividing into non-overlapping regions, taking into account the victimisation rate from each region and then ranking these victimisation rates is schematically drawn in Fig. 1; the process is the same for the perception of security ranking.
We now consider the victimisation rate and the percep-tion of security as the ranking obtained when the regions are sorted from the one with the highest victimisation to the one with the lowest victimisation rate as V and from the one perceived as less secure to the one perceived as the most secure, as S. Our objective is to analyse the relationship between both rankings, so we need to con-sider all possible scenarios. For example, in the case of a tie, that is, if there are two regions such that sk =sj, then the ranking of the perception of security would not be unique, and a similar situation happens if there are two regions such that vk =vj. Since we are dealing with the mean perception of security and victimisation rates, ties are very unlikely to occur, but in order to avoid any inconsistencies, in the case in which sk =sj, then we use the index of the regions j and k, and if j<k then the Rj appears first in the ranking, and the same criteria is applied to the victimisation rate. The result is a unique ranking of the regions based on the perception of secu-rity and a unique ranking of the regions based on the vic-timisation rate.
rankings we consider a metric based on how far away is one ranking from the other, that is, how many move-ments would it take to go from one ranking to the other. More formally, we define a swap to be the permutation of any two neighbouring elements on the list, and a met-ric to compare S and V can be constructed by counting the minimal number of swaps required to go from one ranking to the other. For example, if the two rankings are
identical, then it means that no swap is needed; if only the first two elements of S and V are in reversed order, then only one swap is needed and so on. The maximum number of swaps would occur in the scenario where S and V provide the same order, but reversed, so that the first place of S is the last place of V and so on, and in that case we would require n(n−1)/2 swaps to go from one ranking to the other. If we define p as the minimal num-ber of swaps required to go from ranking S to ranking V, then we then define the Ranking Metric P(S, V) as
which measures the number of swaps required to go
from S into V and compares it against the maximum
number of swaps. Since p∈ {0, 1,. . .,n(n−1)/2}, then
P(S,V)∈[−1, 1]. Thus, when p=0 then P(S,V)=1
and it means that rankings S and V are identical; a small value of p means that it only requires a few swaps to go from one ranking to the other, and we get a value of P(S, V) close to one. When p is closer to n(n−1)/2 it means that it requires most of the possible permutations, so S and V also have a relationship, only they provide a reversed order, and in this case, P(S, V) is closer to −1. Finally, when the number of swaps required to go from one ranking to the other is closer to p=n(n−1)/4, which is the middle between the largest and the smallest amount of swaps, then P(S, V) is closer to 0.
A similar problem arises when trying to compare the ranking provided by two different search engines Kumar and Vassilvitskii (2010). This metric is also known as Kendall Tau Rank Distance Shieh (1998) or the Kendall Rank Correlation Coefficient.
An alternative way to interpret such a metric is based on the multiple comparisons which the rankings S and V allow. If we select a pair of regions, Rk and Rj and com-pare their position in both S and V, then there are two possible scenarios, either both regions have the same order in both rankings, which means that in that com-parison, the region with the highest victimisation rate is perceived as being less secure. The second scenario is that they do not preserve the same order, meaning that the region with more victims is considered to be more secure. The metric is defined as the number of times that a comparison preserves order in both of the rankings, S and V, against the total amount of comparisons that we can make by taking two different regions.
Data description
We use the national victimisation survey conducted in Mexico in four yearly periods from 2011 to 2014, INEGI (2011, 2012, 2013, 2014) in which they ask, amongst oth-ers, the following questions:
(1) P(S,V)= n(n−1)−4p
n(n−1) ,
• In terms of crime, do you consider your locality to be secure or insecure?
• In terms of crime, do you consider your county to be secure or insecure?
• In terms of crime, do you consider your state to be secure or insecure?
These questions help us understand the perception of security from people at three different geographic lev-els: locality, county and state, where the county is formed by a set of localities and a state is formed by a group of counties. The answers are binary, so the person being interviewed was only allowed to answer if he or she considered the region to be either secure or insecure in terms of crime.
Familiarity with the area reduces the worry about suf-fering a crime Gilchrist et al. (1998) which implies that smaller regions have a tendency of being perceived as more secure than larger regions, and so the state level is too general and gives non-comparable observations, if we take in account that there are some states (such as Chi-huahua) which are larger in area than England, but there are some states (such as Morelos) which are smaller in area than Cyprus. Hence, we dismiss the measurements at a state level. The level of locality is, on the other hand, perhaps too specific and it does not provide a clear dis-tinction in largely populated areas (such as Mexico City, which is divided into a few thousand localities). Hence, the region of measure of a county will be used in this study.
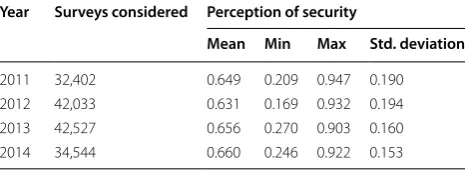
The way in which the survey was conducted considers the number of people from the population represented by each of the respondents based on their demograph-ics so that the data contains an expansion factor, which is interpreted as the number of people represented by each observation and it goes between a few dozen to a few thousand. To avoid considering observations with only a small amount of respondents to the surveys, only coun-ties with more than 300 people answering the survey in 2014 are considered, resulting in a total of 53 coun-ties. Summary statistics for the perception of security data obtained for the 4 years considered is displayed in Table 1.
The perception of security is a metric which allows us to differentiate counties based on the responses obtained from the survey. It shows, for example, that within the 4 years and in the 53 counties considered, the perception of security went as high as 0.947 (Ciudad Juárez in 2011), which can be interpreted as the probability that taking a person randomly from that county, he or she considered it to be insecure, with the answer being surprisingly high.
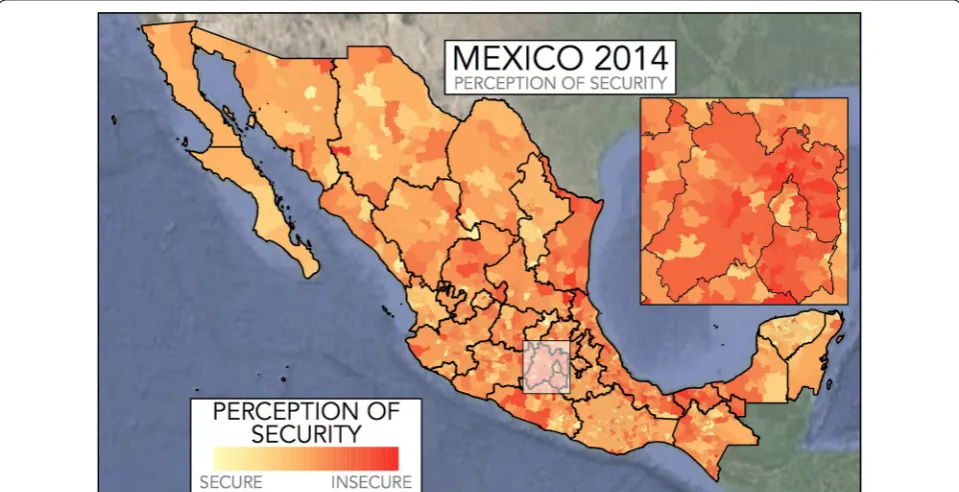
The lowest perception of security (which means that the majority of the county considered it to be secure) was 0.169 (Mérida in 2012), which is a region of the country considered traditionally as being the most secure. This perception of security works as a quantitative measure-ment for the way in which a county is perceived and is not based on a single individual, so it gives a robust esti-mate for the regional perception of security and so it helps differentiate counties which are generally perceived as being secure to those counties which tend to be per-ceived as insecure. Figure 2 represents the perception of security from each county in Mexico during 2014. The perception of security is reasonably homogeneous, in that a county which is perceived as secure has similarly perceived counties as neighbours.
Victimisation rates
Our interest is to relate the obtained metric for the per-ception of security to the victimisation rates. Here we measure the Ranking Metric P(S, V) based on the esti-mated perception of security and its relationship with self-reported crime. Eight different types of crime are considered:
(1) Robbery of a Person (2) Car Theft (CT) (3) Partial Car Theft (4) Burglary (5) Vandalism (6) Kidnap (7) Murder (8) Missing Person.
The same survey that was used to construct the meas-ure of the perception of security is used to estimate the victimisation rates. From the same survey, they ask, amongst others, the following questions:
Table 1 Number of surveys considered and summary sta-tistics for the perception of security, where a value closer to 0 means that in terms of crime people feel more secure and a value closer to 1 means that people tend to feel less secure
Year Surveys considered Perception of security
Mean Min Max Std. deviation
• During the previous year, did any member of this home, including yourself, suffered a type of crime being considered?
• How many times did you or any member of this home suffered a type of crime being considered during the previous year?
These two questions are asked for each type of crime and help us understand the different victimisation rates in each of the regions. In the case of Robbery of a Person the question does not include other members of the home, and in the case or Murder, Missing Person and Kidnap the question is asked only with regards to the members of the home. All cases are self-reported, so it depends on the ability of the survey respondents to recall their experi-ences in terms of crime Farrall et al. (1997) and so there may be sources of error, but nevertheless they lead to valu-able information. This part could be computed with police recorded crime data, however, in Mexico, less than 8% of the crimes gets recorded by the police INEGI (2014).
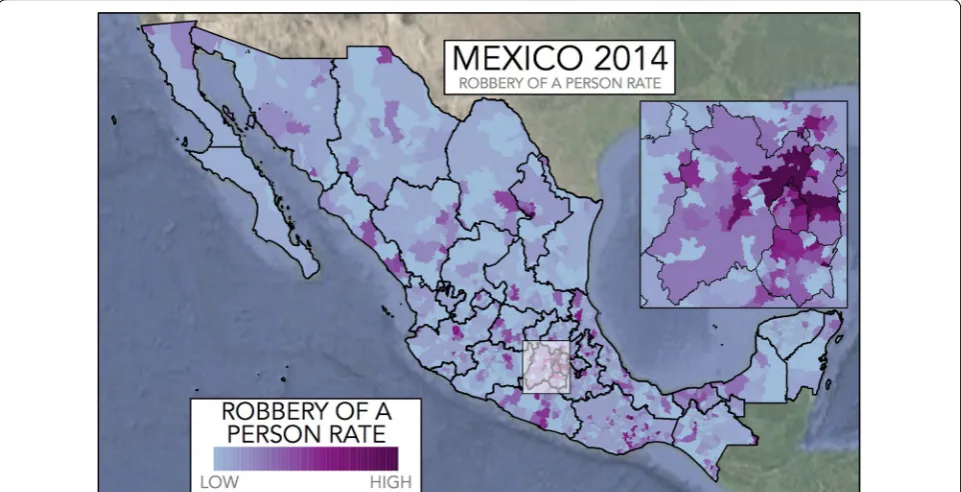
The victimisation rates are obtained from the sur-vey, and so for each county we obtain an estimate of the number of victims of each type of crime during a year, expressed as v(ki) for the i-th type of crime and for the k-th county. Reported victimisation rates for the eight types of crime considered are reported in Table 2 and the victimi-sation rates for the case of Robbery of a Person, v(k1), are displayed in Fig. 3.
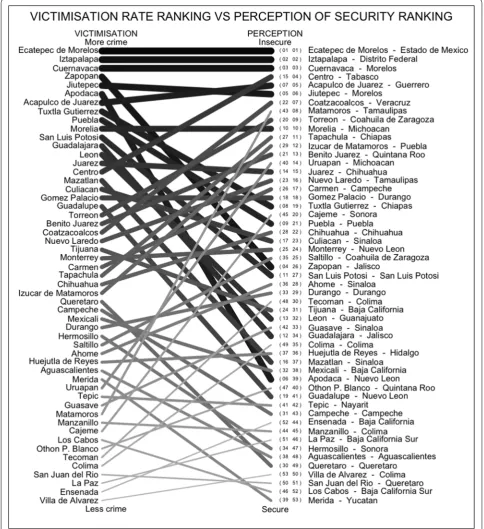
Perception of security and victimisation rates Robbery of a Person is used as an initial approach to the victimisation rates hence V(1) is the ranking from the 53 counties, from the one which suffers the highest amount of robbery of a person, to the one which suffers the low-est. The Ranking Metric based on the permutations is displayed in Fig. 4, where the first column is the victimi-sation rate ranking, V(1), with the counties that suffer the higher rates in the upper part, and the second column displays the perception of security ranking, S, with the counties perceived as the least secure in the upper part. A line is drawn between the same county in the two rank-ings. Hence, a horizontal line indicates that a county is Fig. 2 The perception of security in Mexico by counties. For counties with no information or small amount of survey respondents, the average perception of security, obtained as the average of the whole state is plotted, only for display purposes
Table 2 Victimisation rates, range and standard devia-tion for the eight types of crime considered in Mexico dur-ing 2014 (data obtained from the victimisation survey)
Crime Mean Min Max Std. deviation
Robbery of a person v(1) 0.091 0.007 0.45 0.066
Car Theft (CT) v(2) 0.030 0.002 0.096 0.019 Partial CT v(3) 0.125 0.025 0.250 0.054
Burglary v(4) 0.066 0.023 0.149 0.025
Vandalism v(5) 0.107 0.014 0.222 0.053
Kidnap v(6) 0.004 0 0.014 0.003 Murder v(7) 0.001 0 0.007 0.001
ranked in the same place in both V(1) and S, and intersec-tions between any two lines means that the correspond-ing counties are not in the same order in both rankcorrespond-ings. Perhaps as expected, in Fig. 4 we can identify that it is not usual for a county to have a high (low) victimisation rate and to be identified as secure (insecure).
Using the same data, both rankings V(1) and S might be displayed as an upper triangular matrix Tij, with each of the counties as the rows and columns of Tij and the result of the comparison between the i-th and the j-th county as the entry (i, j), where we assign a value of 1 if these two counties have a different order in both rankings and a value of 0 otherwise (so that Tij helps us identify every pair of counties in which the one with the smaller victimisation rates is perceived as being less secure). If we sum all the entries of Tij we obtain p, the number of swaps required to go from one of the rankings to the other. Using different colours to identify the entries of Tij which are either 1 or 0, the results of the comparison between each pair of counties is displayed in Fig. 5. The column on the right-hand side displays the percentage of counties which have a different order against the cor-responding county, and it reveals that the counties with the lowest number of differences are those in which their victimisation level is either so high or so low that they are easily identifiable as secure or insecure. However, the counties which have a higher number of differences are
the in which the victimisation does not correspond to the perception of security. Two examples are the counties of Apodaca and Guadalupe, both in the Nuevo León state, which have a high victimisation level but are perceived as relatively secure.
When investigating the relationship obtained between the perception of security and the victimisation rate, the value of the metric and its display might, statistically speaking, be the result of randomness. However, there is strong evidence to counteract this argument. We can consider a Null Hypothesis of no correlation between the rankings S and V(1), in which the metric P(S,V(1)) has an expected value of zero. For a very small number of elements in the rankings, it is possible to compute the exact distribution and obtain a confidence interval for the expected value of P(S,V(1)) under that hypothesis, whilst for a large amount of elements, the variance can be approximated Kendall (1948) by
However, we are considering 53 counties here, which is not small enough to compute the exact distribution, nor is it large enough to trust the approximated vari-ance. Instead, if we simulate two random variables with a length of 53 cases each and we focus on both rankings, the result is not usually an ordered structure, compared (2) Var(P)= 2(2n+5)
9n(n−1).
to the one observed in Fig. 4, but is more similar to a completely disordered graph, with tangled lines, as the one displayed on the left-hand side of Fig. 6.
perception of security ranking and the victimisation rate ranking are not related? A simulation of 2000 ran-dom rankings is useful to convince us that these vari-ables are indeed related, as displayed in Fig. 7. From the 2000 random rankings, 95% were found to have a
Ranking Metric that lies between −0.182 and 0.182,
where any value above that interval, as in the obser-vations from the counties in Mexico, is interpreted as a clear relationship between the two rankings.
Observed values below the (−0.182, 0.182) interval
obtained through the simulation are also considered as a clear relationship between the rankings, only hav-ing a reversed order, which is what we would obtain if instead of ranking counties from the one with the most victimisation we started from that one with the least
victimisation. The interval obtained through the sim-ulations is very close to the (−0.185, 0.185) which we would have obtained if we used the approximated value of the variance, from Eq. 2.
The Ranking Metric might also be used to track the changes of the perception of security over different time periods. If we let S2013 be the perception of security rank-ing for the year 2013 and S2014 for 2014, then we can measure P(S2013,S2014) which tells us how the Ranking Metric of the perception of security compares for the two consecutive years, and similarly if we take the Ranking Metric between two victimisation rate rankings. Results for the Ranking Metric between the perception of secu-rity and victimisation rates for different years is displayed in Table 3.
The perception of security ranking tends to be more closely related between any two consecutive years, as expressed in Table 3, but this is not always the case since
of time, and so a region that in the past was perceived as being secure (insecure) has a tendency of being perceived secure (insecure) in subsequent years. There is, after all, a memory in the system.
The victimisation rankings follow a different pattern, for example, the ranking of the year 2011 is more simi-lar to the 2014 ranking than to the 2013. This shows that there are some counties with low (high) tion rate in 2011 which had a higher (lower) victimisa-tion rate for the year 2013 but then went back in the year 2014.
The perception of security ranking has a small degree of variability between consecutive years, as displayed in Fig. 8, particularly for the counties which are consid-ered secure. Two relevant and interesting cases are Ciu-dad Juárez and Chihuahua, both located in the state of Chihuahua, which occupied the 1st and 8th place as the most insecure counties in 2011 and they are located in the 2014 survey in the 15th and 22nd place respectively. The perception of security from these two counties has improved considerably as compared to the rest of the counties considered.
Results
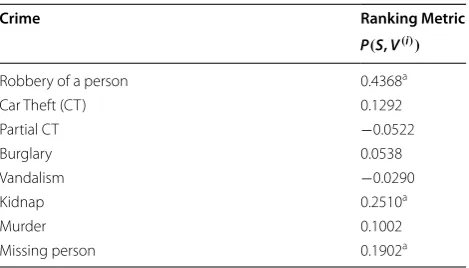
The Ranking Metric P(S,V(i)) can be computed using data for different types of crime and, since the ranking obtained by sorting the counties based on the victimisa-tion rate of Robbery of a Person is different to the rank-ing of the other types of crime, we obtain different results for the P(S,V(i)) metric. We compare the Ranking Met-ric P(S,V(i)) obtained by ranking the different types of crime alone and the results are displayed in Table 4.
At first glance, the results in Table 4 show that the ranking of most of the types of crime is statistically not related to the perception of security ranking, since again, most of them lie between the (−0.18, 0.18) rejection interval obtained through simulation. This means that, for example, if we rank the 53 counties which we consider here based on their Murder rates (from the ones with the highest rate to the ones with the smallest rate) and we compare that ranking to the perception of security ranking, they would display no relation. This result might seem surprising, but is a reflection that murder is a rare event, so the counties usually have a rate so close to zero that the murder ranking becomes almost irrelevant. Fig. 7 Histogram that shows the metric P(S, V) of 2000 simulated rankings and the value observed from data. The red area contains 95% of the simulations, obtained inside the (−0.182, 0.182) interval. The observed value of 0.44 is far away from any simulated result, meaning that we can reject that the rankings S and V are independent
Table 3 Ranking Metric between the perception of security on the left, and the victimisation rates on the right, between 2011 and 2014
A value closer to 1 means that the rankings have a higher degree of correlation, a value closer to 0 means no correlation between the rankings, and a value closer to
−1 means that the rankings provide a reverse order
Perception of security ranking S Victimisation ranking V
2012 2013 2014 2012 2013 2014
2011 0.6286 0.5604 0.5240 0.6604 0.5806 0.6546
2012 – 0.5720 0.5008 – 0.5864 0.6430
It is relevant to note that there are some counties, such as Uruapan and Matamoros, in which the perception of security does not match the victimisation rates, and they tend to be the ones with the highest number of compari-sons with different order between the victimisation rank-ing and the perception of security rankrank-ing, as displayed in Fig. 5. This means that these counties may have par-ticular situations, perhaps, such as organised crime, or a high victimisation background.
secure county in 2011 but in 2014 occupies the place 37th. It is possible that these highlighted cases might be counties where organised crime and other types of crime such as extortion have had an impact on the society and its perception of security, without crime itself being reflected in the eight victimisation rates considered in the model.
Conclusions and discussion
In this paper, the methodology presented constructs a regional metric for the perception of security which can be easily interpreted as the probability that a person per-ceives that region to be insecure. Even when the percep-tion of security is based on the impressions and fears from a surveyed population, with these feelings repre-senting a generalised behaviour in the population, the perception of security might be considered an attribute of the region rather than the impressions and fears of some of its individuals, hence the validity of a regional approach to the perception of security.
Quantitatively speaking, although the perception of security by itself does reveal a pattern of beliefs, the abso-lute measure is much more valuable when compared to other regions or over different time periods since the sig-nificance of the isolated number cannot be easily deter-mined. This regional perception of security allows us to compare and differentiate two regions based on their per-ceptions. Ranking the perception of security gives a valu-able insight of the feelings of the population in terms of crime and it allows us to compare many regions simul-taneously. This approach is not constrained to Mexico or to the geographic level of counties and thus more spe-cific regions could also be ranked by their perception of security.
Due to many reasons (such as the lack of information, the fact that crime is a rare event and the important role that the media plays) a person might not be able to cor-rectly predict their own chances of suffering a particular type of crime. The actual chance of being the victim of a crime may differ highly from how that person perceives insecurity where he or she lives. If a region is generally deemed as being insecure, regardless of its victimisa-tion rates, then its populavictimisa-tion reacts to that percepvictimisa-tion. A high level in the perception of insecurity may cause people to change their behaviour, for instance by chang-ing their shoppchang-ing or eatchang-ing trips to the neighbourhoods which are perceived to be insecure. In Ciudad Juárez, for example, 92% of the population considered their county to be insecure in 2011 and as a result of that climate of insecurity, some people actually moved cities when their small businesses became less profitable, half of them crossing the border into the United States Albuja, (2014). Between 2006 and 2011 nearly 1.7 million people were internally displaced in Mexico because of their perceived insecurity and the violent atmosphere Cantor (2014). The extreme perception of insecurity becomes as relevant a concern as crime itself.
The perception of security is affected by past circum-stances, which in terms of policy design shows that events, such as a kidnap or death of a child covered extensively in the media, for example, might have an immediate negative impact whose influence may extend for some time so that improvements in the perception of security tend to be quite slow. Therefore, even if a county is suddenly successful at reducing its victimisation rates, it might take a long time for the perception to recover. However, a decline in the perception of security might happen rapidly, as seen in the perceptions in Coatzacoal-cos, Veracruz from the 30th and 29th place in 2012 and 2013 to the 7th place of insecurity in 2014, which clearly indicates a new concern in that county. In Coatzacoal-cos, the perception of security went from 0.65 in 2013 to 0.80 in 2014 so that from 1 year to the next one, 15% of the population from that county changed their position and considering it to be insecure. Interestingly, between 2013 and 2014, most of the victimisation rates in Coat-zacoalcos actually decreased but the number of kidnaps more than doubled and so, which might indicate that the increased perception of insecurity is the result of the increase in the kidnap rate.
Tracing the changes in the victimisation rates for dif-ferent types of crime and for many counties is a multi-dimensional problem, but tracing any drastic changes in the perception of security, that is, simply ranking coun-ties over consecutive years, may reveal the emergence of a concern about crime in a particular region. It may Table 4 Ranking Metric between the perception of
secu-rity and the different types of crime
A value closer to 1 means that the rankings have a higher degree of correlation, and a value closer to 0 means no correlation
a Values that are statistically different to zero
Crime Ranking Metric
P(S,V(i))
Robbery of a person 0.4368a
Car Theft (CT) 0.1292
Partial CT −0.0522
Burglary 0.0538
Vandalism −0.0290
Kidnap 0.2510a
Murder 0.1002
be much simpler to identify the reasons that cause it, as for the case of the increase of the kidnap rates in Coatza-coalcos. If the population feels more insecure, something needs to be done. The measure of perception can thus be used alongside other indicators to try and identify shifts in social norms.
The perception of security has a high Ranking Met-ric with Robbery of a Person, meaning that counties in which Robbery of a Person is more frequent tend to be perceived as being less secure. Robbery of a Person is the second most frequent type of crime in Mexico and it is a type of crime in which the victim and the criminal have some form of contact, at least for a few seconds, and perhaps not surprisingly, this type of crime then has the highest ranking correlation. The other two types of crime with a high Ranking Metric are Missing Person and Kid-nap, but these two types of crime are relevant due to their high social impact rather than their frequency. In Mexico during 2014, for every 119 Robberies of a Person, there was a single Kidnap. The fact that Partial Car Theft and Vandalism have a low ranking correlation with the per-ception of security, taking into account that they are the first and third most frequent type of crime respectively, shows that low impact crime has, in fact, a low impact on the perception of security, especially if the population has more relevant (although perhaps much less frequent) crimes to worry about.
Results here highlight that efforts invested in reducing the levels of lower impact crimes (such as Vandalism or Partial Car Theft) might not actually improve the percep-tion of security, even when they are the most frequent types of crime. However, a policy oriented to reduce the levels of Robbery a Person might have much better results in terms of its effect on the perception of security since it has a strong impact on the perception of security accompanied with a relatively high frequency.
This research revealed that Ecatepec, Estado de Méx-ico, located in the metropolitan area of Mexico City, has been ranked as the most insecure county for the past 3 years. This is perhaps not surprising since between 2011 and 2014 the victimisation rates for Robbery of a Person and Car Theft have more than doubled. An intervention oriented to reduce its victimisation rates is clearly needed. It would then be interesting to also mon-itor its perception of security, particularly if this could be compared with a county where a different approach was taken.
Authors’ contributions
Both RPC and SB worked on the modelling part, the analysis and the interpretation of the results. Both authors worked on writing the manuscript. RPC worked on the data collection and manipulation. Both authors read and approved the final manuscript.
Authors’ information
RPC worked between 2010 and 2013 as a Director of Strategic Analysis in the Centro de Atención a Emergencias y Proteccióon Ciudadana de la Ciudad de Méexico, (Mexico City Emergency Attention Centre).
Acknowledgements
RPC is funded by the Mexican Government through a Conacyt Scholar. SRB acknowledges the support from the RCUK Digital Economy grant EP/ K039830/1 via the EPSRC as well as the support by the Cimplex project funded by the European Commission in the area “FET Proactive: Global Systems Sci-ence” (GSS), as a Research and Innovation Action, under the H2020 Framework programme, Grant agreement number 641191.
Competing interests
The authors declare that they have no competing interests.
Received: 12 November 2015 Accepted: 21 October 2016
References
Albuja, S. (2014). Criminal violence and displacement in Mexico. Forced Migra-tion Review, 45, 28.
Borooah, V. K., & Carcach, C. A. (1997). Crime and fear, evidence from Australia.
British Journal of Criminology, 37(4), 635–657.
Brunton-Smith, I., & Sturgis, P. (2011). Do neighborhoods generate fear of crime? an empirical test using the British Crime Survey. Criminology, 49(2), 331–369.
Bureau of Justice Statistics. (2016). National Crime Victimization Survey (NCVS).
http://bjs.ojp.usdoj.gov/index.cfm?ty=dcdetail&iid=245. Accessed May 2016.
Cantor, D. J. (2014). The new wave: forced displacement caused by organized crime in Central America and Mexico. Refugee Survey Quarterly, 33(3), 34–68. Carro, D., Valera, S., & Vidal, T. (2010). Perceived insecurity in the public space:
personal, social and environmental variables. Quality and Quantity, 44(2), 303–314.
Chadee, D., & Ditton, J. (2005). Fear of crime and the media: Assessing the lack of relationship. Crime Media Culture, 1(3), 322–332.
Ditton, J., & Duffy, J. (1983). Bias in the newspaper reporting of crime news.
British Journal of Criminology, 23, 159.
Farrall, S., Bannister, J., Ditton, J., & Gilchrist, E. (1997). Questioning the measure-ment of the fear of crime: Findings from a major methodological study.
British Journal of Criminology, 37(4), 658–679.
Farrall, S., Bannister, J., Ditton, J., & Gilchrist, E. (2000). Social psychology and the fear of crime. British Journal of Criminology, 40(3), 399–413.
Gilchrist, E., Bannister, J., Ditton, J., & Farrall, S. (1998). Women and the fear of crime challenging the accepted stereotype. British Journal of Criminology,
38(2), 283–298.
Grogger, J., & Weatherford, S. (1995). Crime, policing and the perception of neighborhood safety. Political Geography, 14(6/7), 521–541.
Hale, C., Pack, P., & Salked, J. (1994). The structural determinants of fear of crime: An analysis using census and crime survey data from England and Wales.
International Review of Victimology, 3(3), 211–233.
INEGI. (2011). Victimisation survey, 2011. http://www3.inegi.org.mx/sistemas/ microdatos/encuestas.aspx?c=28008&s=est. Accessed Aug 2015. INEGI. (2012). Victimisation survey, 2012. http://www3.inegi.org.mx/sistemas/
microdatos/encuestas.aspx?c=31913&s=est. Accessed Aug 2015. INEGI. (2013). Victimisation survey, 2013. http://www3.inegi.org.mx/sistemas/
microdatos/encuestas.aspx?c=34501&s=est. Accessed Aug 2015. INEGI. (2014). Victimisation survey, 2014. http://www3.inegi.org.mx/sistemas/
microdatos/encuestas.aspx?c=34517&s=est. Accessed Aug 2015. Jackson, J., & Gray, E. (2010). Functional fear and public insecurities about
crime. British Journal of Criminology, 50(1), 1–22.
Kendall, M. G. (1948). Rank correlation methods (1st ed.). London: C. Griffin. Kershaw, C., & Tseloni, A. (2005). Predicting crime rates, fear and disorder
based on area information: Evidence from the 2000 British Crime Survey.
Kumar, R., & Vassilvitskii, S. (2010). Generalized distances between rankings. In
International world wide web conference committee (IW3C2). New York city: ACM.
Liska, A. E., & Baccaglini, W. (1990). Feeling safe by comparison: Crime in the newspaper. Social Problems, 37, 360.
Office for National Statistics. (2016). Crime survey for England and Wales (CSEW). http://dx.doi.org/10.5255/UKDA-SN-7280-4. Accessed May 2016. Shieh, G. S. (1998). A weighted Kendall’s tau statistic. Statistics and Probability
Letters, 39(1), 17–24.
Tseloni, A. (2007). Fear of crime, perceived disorders and property crime: A multivariate analysis at the area level. Crime Prevention Studies, 21, 163–185.
Tseloni, A., Mailley, J., Farrell, G., & Tilley, N. (2010). Exploring the international decline in crime rates. European Journal of Criminology, 7(5), 375–394. Wilcox Rountree, P., & Land, K. (1996). Perceived risk versus fear of crime:
Empirical evidence of conceptually distinct reactions in survey data.