R E S E A R C H
Open Access
Multi-membership gene regulation in pathway
based microarray analysis
Stelios P Pavlidis
*, Annette M Payne and Stephen M Swift
Abstract
Background:Gene expression analysis has been intensively researched for more than a decade. Recently, there has been elevated interest in the integration of microarray data analysis with other types of biological knowledge in a holistic analytical approach. We propose a methodology that can be facilitated for pathway based microarray data analysis, based on the observation that a substantial proportion of genes present in biochemical pathway databases are members of a number of distinct pathways. Our methodology aims towards establishing the state of individual pathways, by identifying those truly affected by the experimental conditions based on the behaviour of such genes. For that purpose it considers all the pathways in which a gene participates and the general census of gene expression per pathway.
Results:We utilise hill climbing, simulated annealing and a genetic algorithm to analyse the consistency of the produced results, through the application of fuzzy adjusted rand indexes and hamming distance. All algorithms produce highly consistent genes to pathways allocations, revealing the contribution of genes to pathway functionality, in agreement with current pathway state visualisation techniques, with the simulated annealing search proving slightly superior in terms of efficiency.
Conclusions:We show that the expression values of genes, which are members of a number of biochemical pathways or modules, are the net effect of the contribution of each gene to these biochemical processes. We show that by manipulating the pathway and module contribution of such genes to follow underlying trends we can interpret microarray results centred on the behaviour of these genes.
Background
Pathway based microarray data analysis is an attempt to integrate microarray data analysis with biochemical pathway knowledge [1]. Rather than concentrating on the often subtle change occurring in the expression of individual genes, gene expression analysis is facilitated to identify coordinated changes occurring in the expres-sion of sets of genes, forming biochemical pathways [2]. The ultimate goal of this approach is to decipher the functional state of a cell at the level of the underlying biochemistry.
Biochemical pathway data is readily accessible in var-ious public databases, such as KEGG [3], Reactome [4], SABIO-RK [5], EcoCyc [6] and others, while tools devel-oped for visualisation of genes’ behaviour, based on microarray data, include Eu.Gene [2], GenMapp [7],
Cytoscape [8], Pathfinder [9], GeneNet [10] and GScope [11]. These software tools are based on superimposing a single microarray dataset on a biochemical pathway database, in order to visualise the expression of each individual gene per pathway and thus establish the state of individual pathways.
However, genes in a biochemical pathway often show quite variable behaviour in terms of RNA production and previous work in the field has already suggested that not all such genes are representative of the path-way’s behaviour [12]. To an extent this is a consequence of the fact that genes forming a pathway may encode proteins of very different functionality with some being transcription factors acting in the cell nucleus while others proteins residing on the cell membrane [13]. Additionally the existence of different levels of regula-tion, including translaregula-tion, protein maturation and degradation rate, may confer gene expression insuffi-cient evidence of gene functionality [14,15]. Notably, * Correspondence: [email protected]
School of Information Systems, Computing and Maths, Brunel University, Uxbridge, UB8 3PH, UK
microarray analysis itself is accompanied by limitations, as it involves numerous error-prone experimental steps and requires the physical disruption of cells to gain access to their gene expression patterns [16].
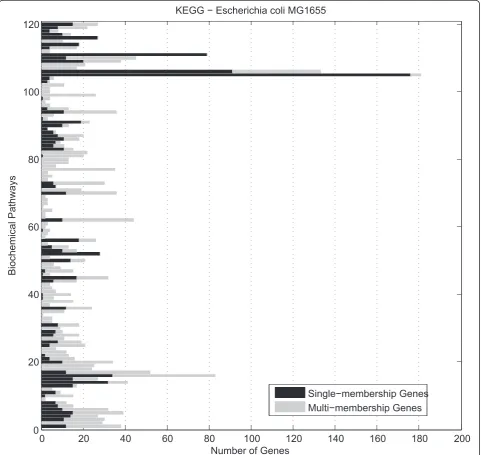
We however, have suggested an additional cause for observing variation in the expression of genes, forming a biochemical pathway. According to the Kyoto encyclo-paedia of genes and genomes database (KEGG), it is quite common for a gene to be a member of two or more biochemical pathways. We refer to such genes as multi-membership genes to distinct them from
single-membership genes that are members of one and only pathway. Figure 1 reveals the number of single and multi-membership genes forming each of the Escheri-chia coli K12 pathways, currently stored in KEGG database.
According to our hypothesis, differential expression of a multi-membership gene may be the effect of different regulation of that gene, by the biological system, at the level of transcription due to its involvement in the activ-ity of more than one biochemical pathways. Consequen-tially, the observed expression of any such gene
0 20 40 60 80 100 120 140 160 180 200
0 20 40 60 80 100 120
Number of Genes
Biochemical Pathways
KEGG − Escherichia coli MG1655
Single−membership Genes Multi−membership Genes
corresponds to the net effect of its regulation in order to contribute adequately to the activity of the biochemical pathways it is a member of. To our knowledge the multi-membership nature of genes and its impact on pathway based microarray analysis has not been exten-sively explored. This is an omission that can potentially lead to misleading conclusions, given that multi-mem-bership genes may mask the true behaviour of individual pathways.
We assume that an increase or a decrease in the activ-ity of a biochemical pathway is accompanied by a respective trend for increase or decrease in the function-ality of most of the genes forming the pathway, whose fluctuations in expression affect the given pathways’ state. Thus, to the extent that gene functionality is adjusted at the level of transcription, we expect genes to be regulated by the living system in a way that follows the trend of expression in a particular pathway and to generally show consistent behaviour, with only few exceptions, such as repressor genes and alternative isoenzymes.
We have proposed a methodology that takes into account the expression of all genes in a given organism, that are members of biochemical pathways, and the con-sensus of gene expression per pathway in order to iden-tify the underlying pathway expression changes caused by the biological system through regulation of the expression of their constituent genes [17]. Unlike other approaches where genes are treated as stable or differen-tially expressed, our methodology considers the up- or down-regulated state of each individual gene. We attempt to ascribe any observed inconsistencies in gene expression in a pathway, to the involvement of some of its genes in the activity of other pathways of which they are also members. We implemented a hill climbing search approach [18], which was able to produce consis-tent results, in agreement with the publications accom-panying the data in question.
Given the tendency of the hill climbing search to get trapped into local maxima, we proceeded further, applying a simulated annealing [19] and a genetic algo-rithm [20] search technique in order to explore the performance of each one on a set of microarray experi-ments. Since differences in the final fitness reached by each of these methods do not have a straightforward biological meaning we shifted our efforts towards exploring the similarity of the produced results, in conjunction with their corresponding fitness, by using two complimentary approaches. In particular, we developed a methodology for estimating the similarity of two gene allocations in terms of the probability of obtaining them purely by chance. Additionally, we adopted the fuzzy adjusted rand index metric, widely used measure of agreement for categorical data [21].
Interestingly, according to both measures the results produced by all methods are highly consistent, while the simulated annealing search appears to be only slightly more efficient than the hill climbing and genetic algorithm techniques.
In addition, we further developed the simulated annealing approach to work with modules, that is, shorter chains of biochemical events, which form part of KEGG pathways, applying the methodology to a number of microarray experiments.
Methods
Microarray datasets are trimmed to only include genes present in KEGG pathways. For example, KEGG con-tains 1384 Escherichia coligenes out of a total of 4288 protein-coding genes, for the harmless laboratory strain K12 [22]. We apply discretisation of genes into three categories, namely up-, down-regulated and stable, based on an adequately chosen threshold and apply a hill climbing, a simulated annealing and a genetic algo-rithm, to alter the possible allocation of multi-member-ship genes to their constituent pathways.
We assume that a differentially expressed gene is regulated by the biological system to contribute to the activity of at least one of the pathways it is a member of. Thus, any configuration that satisfies this criterion is considered valid, while an allocation where a multi-membership gene has not been assigned to any of its pathways is rejected. We attempt to identify for each multi-membership gene the pathways whose activity requires the contribution of that gene and the direction of regulation required by each one those pathways. Allo-cation of a gene to one of its constituent pathways sug-gests that the biological system has adjusted the expression of that gene in the given manner to satisfy the activity of that pathway. Naturally, not allocating a gene to a pathway suggests its expression is not related to its involvement in the activity of this particular pathway.
Given that KEGG pathways contain collections of genes involved in extensive biochemical processes, we further proceed to work with KEGG modules, following a similar rationale to the one applied in the case of pathways.
Notation
We use the following mathematical notation in our methods and results. LetP be an Nrow byM column binary matrix,PÎ {0,1}N×M, wherepij(the element in the
ith row and jth column of matrix P) is equal to 1 if gene iis a member of pathway j, and pij = 0 if geneiis
LetAÎ {0,1}N×Mbe a binary matrix such that P-AÎ
{0,1}N×M, where A represents a potential allocation of genes to pathways that we use in our methods. Hereaij =1 if geneiis allocated to pathwayjand aij= 0 if gene
i is not allocated to pathway j. The restriction P-AÎ
{0,1}N×Mmeans thatAcan define pathways to have less genes than originally inP, but can never have genes that contradictP, i.e. we do not allow allocations that would be contrary to the allocations in KEGG.
Fitness Function
Hill climbing, simulated annealing and genetic algo-rithms are heuristic search methods and as such require a fitness function to be defined, which the algorithm attempts to maximise or minimise, depending on the type of the problem in hand [23]. A fitness function evaluates the worth of the current solution being con-sidered by a method. The fitness function we implement evaluates the worth of an allocation of multi-member-ship genes to the pathways they are members of, and is used by all three heuristic search methods.
Let us assume that we have a single set of gene expression data (one experiment) for the N genes called G. We score an allocation on how much each pathway is down- or up-regulated according to equa-tions (1) to (3). Note that the constantc is a threshold parameter defining the state of a gene in terms of up-and down-regulation. In particular, X(i) has a value of +1, -1 or 0 if gene i is up-, down-regulated or stable respectively.
X(i) = ⎧ ⎨ ⎩ +1 −1 0
,ifG(i) > c , ifG(i) < - c ,otherwise
(1)
F(A) =
M j=1 N i=1 Haij
(2)
H(aij) = X(i)
0
,ifaij = 1
, otherwise (3)
F(A) is the fitness function, which we aim to maximise by changing the allocation of multi-membership genes to their corresponding pathways. We use equation (3) to define if genei is a member of pathwayj, which is true if aij= 1, and if that is the case to define if the gene is
up-, down-regulated or stable. Function N
i=1
H(aij)reveals
the difference between the numbers of up- and down-regulated genes in pathwayj. Thus, the more genes of similar expression are allocated to pathwayjthe greater
N
i=1 Haij
becomes for that pathway, leading to an increase of the value ofF(A).
Hill Climbing
Algorithm 1, Hill Climbing Search Algorithm
1. INPUT:a = list of gene IDs coupled with their pathway IDs,b = expression vector of log2 ratios,c
= threshold for up-/down-regulated genes 2. Remove all genes between +cand -c
3. Randomly allocate each expressed gene to its member pathways (createA)
4. Get fitnessF(A), setF_old=F(A) 5. Forj= 1: number of iterations 6. Save gene configuration
7. UsePto randomly choose a gene (i) with multiple membership and randomly
choose one of the pathways(j) it belongs to 8. If according toAgene (i) is already present in the pathway (j) Then
9. Remove the gene, i.e. setaij= 0
10. Else
11. If not present then place it in the pathway, i.e. setaij= 1
12. End if
13. If the gene is not assigned to at least one path-way then randomly choose a pathpath-way and assign it to it
14. Estimate fitnessF(A) 15. IfF(A) >F_oldthen 16. SetF_old=F(A) 17. Else
18. ifF(A) <F_oldthen Restore gene configuration (step (6))
19. End if 20. End for 21. OUTPUT:A
Simulated Annealing
In contrast to hill climbing, simulated annealing may accept a solution of lower fitness, depending on a prob-ability which is defined by gradually decreasing
para-meter T, termed temperature. We have chosen a
Pt=e
−F
Tt (4)
Tt=Tt−1λ (5)
λ=e
log(TFINAL)−log(T0)
I (6)
WherePtis the probability of accepting an allocation
of lower fitness at the current iteration t, -ΔFis the dif-ference between the current fitness and the one of the allocation at the previous iteration, Ttis the current
temperature andTFINALthe temperature at the last
itera-tion, lis a constant andIthe number of iterations for the search to complete.
Genetic Algorithm
The genetic algorithm simulates evolution, where the fittest individuals are more likely to survive. At each generation we apply crossovers and mutations, changing the allocation of multi-membership genes to their mem-ber pathways. Algorithm 2 represents the main body of the genetic algorithm.
Algorithm 2, Genetic Algorithm
1. INPUT: a = list of gene IDs coupled with their pathway IDs, b = expression vector of log2 ratios,c
= threshold for up-/down-regulated genes 2. Remove all genes between +cand -c
3. Create 100 random Parent chromosomes 4. Get fitnessFof each Parent chromosome 5. Fori = 1: number of generations
6. Forj= 1:number of individuals in Parent 7. Call mutation Algorithm with input Parentj
8. End for
9. Create a random list List of (number of Mutated)/ 2
10. For j= 1:(number of Mutated)/2
11. Call crossover Algorithm with input Mutated (List(j)), Mutated(List(j+1))
12. End for
13. Get fitness of each Mutated and Crossover chromosome
14. Concatenate Parent, Mutated and Crossover chromosomes and their corresponding fitness 15. Sort the resulting chromosomes and fitness according to the later.
16. Set Parent = first 100 chromosomes and Fitness = first 100 fitness values
17. End for
18. OUTPUT: Best Individual and Fitness
Algorithm 3 describes the crossover process, while
algorithm 4 the mutation process, called at steps 7 and 11 of the main genetic algorithm script, respectively. Within Algorithm 3 the operator C = [A1,A2,...,Ax,Bx+1,
Bx+2,...BN] concatenates the lists A and B preserving
order and sets C to be the result.
Algorithm 3, Crossover Algorithm
1. INPUT: Parent A and Parent B
2. Choose a random numberxbetween 1 and length of Parent A
3. Set Crossover A = [A1,A2,...,Ax,Bx+1,Bx+2,...BN]
4. Set Crossover B = [B1,B2,...,Bx,Ax+1,Ax+2,...AN]
5. OUTPUT: Crossover A, Crossover B
Algorithm 4, Mutation Algorithm
1. INPUT: Parenti
2. Set Mutated = Parenti
3. Fork= 1:length of Mutatedi
4. Produce a random numberabetween 0 and 1 5. Ifa< 1/length(Mutatedi) randomly choose a
posi-tionxin Mutatedi{k}
6. If Mutatedi{k}(x) = = 1, Then Set Mutated{k}(x) =
0 7. Else
8. If Mutatedi{k}(x) = = 0, Then Set Mutated {k}(x)
= 1
9. While sum of Mutated{k} = = 0, go to 4 10. End if
11. End for
12. OUTPUT: Mutated
A generation consisting of a hundred individuals proved sufficient to reach the expected fitness over about four hundred generations.
Hamming Distance
The Hamming Distance (Hammbelow) measure reveals the similarity between two binary strings of the same length [24]. Thus, it was a natural choice of method to evaluate the consistency of genes to pathways allocations.
Let D,E Î BN×M be gene to pathway allocations, as described in the Notation section, such that P-D Î BN×M and P-E Î BN×M, i.e. Dand Eare allocations of genes. Let the similarity betweenDand Ebe:
S(D,E) = 1
NM N
i=1
(M−Hamm(Di,Ei)) (7)
Hamm(Di,Ei) = 1
0
,Di=Ei
whereDiis the ith row ofD.
To obtain a meaningful interpretation of the observed hamming distances, we developed a methodology to estimate the probability of obtaining any hamming dis-tance between two allocations produced by our meth-ods, purely by chance. Firstly, for any given multi-membership gene, we estimate the probability of obser-ving each possible hamming distance between pairs of allocations. The method is based on estimating the number of possible valid binary strings representing the allocation of a multi-membership gene to the pathways it is a member of, according to KEGG database.
In the simplest case of a gene that is a member of two pathways, its allocation is represented by a string of two binary digits. As already mentioned, only solutions where the gene has been allocated to at least one of the pathways it belongs to are considered valid. Therefore, a string consisting solely of zeros is not accepted as a valid allocation. Consequentially, the square matrix on Table 1 represents all valid combinations of allocations, for a gene that is a member of two distinct biochemical pathways, giving rise to all possible hamming distances.
The probability of observing any of the hamming dis-tances on Table 1 is equal to the number of combina-tions producing each of the possible hamming distances, namely 0, 1 and 2, divided by the overall number of possible combinations.
Again in the simplest case of a gene member of two pathways we obtain the probabilities shown on Table 2. For a gene that is a member of any number of pathways, the number of such combinations for any given ham-ming distance between 0 andrcan be estimated accord-ing Table 3.
Herenis the number of pathways the gene is a mem-ber of and r is the hamming distance. Equation (9) demonstrates that if we summate from 1 to n, we get the number of possible combinations corresponding to all possible hamming distances.
2n−1
Table 1, hamm=0
+ n r=1 n r 2
n−2
Table 1, hamm=1,...,n
= 2n−1 +2n−2
n r=1 n r
=2n−1
= 2n−1 +2n−2 2n−1
= 2n−1 +2n−1 2n−1−2n+ 1 =2n−1 2n−1
(9)
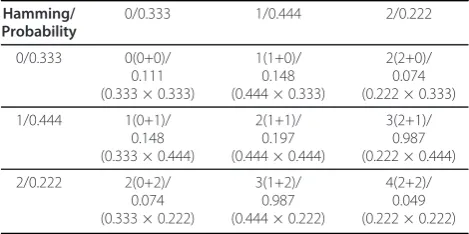
In the context of this text, we work with allocations of more than one expressed multi-membership genes to their pathways. This however, is still possible following the above rationale. Again in the simplest case of two genes, members of two pathways each, we can estimate the probability of obtaining all possible hamming dis-tances using Table 2 and applying simple addition and multiplication of the values as shown on Table 4. Each pair of hamming distances is added to obtain the com-bined hamming distance, while each pairs’ correspond-ing probability is multiplied to obtain the probability of observing the combined hamming distance in question.
For any number ofNgenes we can obtain the corre-sponding values using an N dimensional matrix like
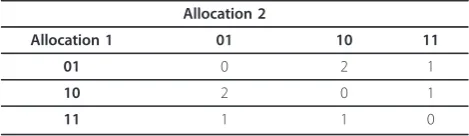
Table 1 Hamming Distances between two allocations of a gene member of two biochemical pathways
Allocation 2
Allocation 1 01 10 11
01 0 2 1
10 2 0 1
11 1 1 0
The table reveals all possible combinations of two allocations for a multi-membership gene, participating in two distinct biochemical pathways, with the corresponding hamming distance between the binary strings representing these allocations. A string of zeros is considered invalid allocation, as we assume that a differentially expressed gene is contributing to the activity of at least one of its member pathways.
Table 2 Probability of obtaining any hamming distance between two allocations of a gene member of two pathways
Hamming Dist. 0 1 2
Probability 0.333 (3/9) 0.444 (4/9) 0.222 (2/9) Given the number of possible combinations (Table 1) of allocations for a gene member of two pathways, and the hamming distance between them, Table 2 shows the probability of obtaining each possible hamming distance, purely by chance.
Table 3 Number of combinations of pairs allocations of
hamming distance from 0 tor
Hamming Dist. Number of possible occurrences
0: 2n- 1
1: (2n- 1 -n)n+n(n-1) = (2n-2)n
2:
2n−1−
n 2 n 2 + n 2 n 2 −1 = = n 2 2
n−2
r:
2n−1−
n r n r + n r n r −1 = = n r 2
n−2
the above. As the number of genes grows this becomes computationally expensive, however the problem is cir-cumvented, as each gene can be added at a sequential step, through a process of merging and expanding the matrix. For example merging the data for the two genes represented on Table 4 gives rise to the matrix on Table 5.
Fuzzy Adjusted Rand Index
The adjusted rand index (ARI) is a common measure of crisp cluster similarity, which has been extended to fuzzy clustering giving the fuzzy adjusted rand index (FARI) [21]. For each pair of elements FARI examines if both clustering arrangements have placed the pair in the same or different clusters. We have adopted FARI to compare allocations of multi-membership genes pro-duced by separate runs of our algorithms on the same microarray dataset, given that each arrangement may place a gene in one or more pathways. For our purposes clusters correspond to pathways, assuming equal weights for the contribution of a gene to all its member pathways.
While the hamming distance between two multi-membership gene allocations reveals biological similar-ity, answering the question of how similar two alloca-tions are the fuzzy adjusted rand index examines if each pair of genes is placed together or in different pathways by subsequent runs of our algorithms.
We use both methods as two allocations may have the same fitness but different hamming distance. This can occur in cases where groups of genes are placed together but in different pathways by separate runs of our scripts. In particular for allocations of the same or very similar fitness, accompanied by significant ham-ming distance, high FARI value can reveal the occur-rence of the above described phenomenon.
Results and Discussion
Hypothesis Validation
While single-membership genes through their products are solely contributing to the function of a particular pathway, multi-membership genes can participate in the functionality of any combination of the pathways they are members of, at any particular time. Thus, unlike sin-gle-membership genes, multi-membership genes’ inten-sity values, as extracted from a microarray slide, represent a net effect. The biological system may require activation of certain pathways and regulate the produc-tion of a protein part of their network in a way that its quantity increases. At the same time it may require deactivation of other pathways in which the same pro-tein participates. The resulting balance may affect the expression observed on the microarray leading to less consistent readings for groups of proteins part of a bio-chemical pathway, encoded by multi-membership genes, when each pathway is examined in isolation from the rest.
To examine this we have identified 19 experiments (GSM99081 to 83, GSM99108 to 112, and GSM99171 and GSM99172) on Escherichia coli, from microarray data available at Gene Expression omnibus (GEO) [25], platform GPL3503 [26], that contain a large number of expressed Urea Cycle genes. KEGG Urea Cycle pathway consists of 16 single-membership and 12 multi-member-ship genes. We divide the intensities, separately for the group of single- and the group of multi-membership genes, per experiment by their sum, to obtain a measure of the contribution of each gene to the behaviour of the pathway. We then compare the correlation between the obtained contribution values of the 12 multi-member-ship genes and the 16 single-membermulti-member-ship genes, throughout the 19 experiments. For both cases we acquire a set of 171 correlation values, and perform a two sample t-test which reveals that the values are sig-nificantly different with a p-value of 1.3251 × 10⁻¹². Furthermore, in the case of single-membership genes the correlation values are higher with 86.5% of the values being above the level of significant correlation at
p = 1%. In contrast, for the multi-membership genes only 41.5% of the values exceed the threshold of signifi-cance at 1%. The assumption that multi-membership genes expression is the net effect of their contribution Table 4 Combined Hamming distance and probability for
a pair of genes, members of two pathways
Hamming/ Probability
0/0.333 1/0.444 2/0.222
0/0.333 0(0+0)/ 0.111 (0.333 × 0.333)
1(1+0)/ 0.148 (0.444 × 0.333)
2(2+0)/ 0.074 (0.222 × 0.333)
1/0.444 1(0+1)/ 0.148 (0.333 × 0.444)
2(1+1)/ 0.197 (0.444 × 0.444)
3(2+1)/ 0.987 (0.222 × 0.444)
2/0.222 2(0+2)/ 0.074 (0.333 × 0.222)
3(1+2)/ 0.987 (0.444 × 0.222)
4(2+2)/ 0.049 (0.222 × 0.222)
Table 4 exemplifies how to estimate the combined hamming distance for two multi-membership genes, members of two distinct biochemical pathways each, along with the respective combined probability. Here again, we assume that any configuration, where each gene is allocated to at least one pathway is valid and that each one is equally likely to occur by chance.
Table 5 Compact Hamming distance and probability for two genes, members of two pathways each
Hamming Distance 0 1 2 3 4
to their constituent pathways is in agreement with our findings. Single membership genes apparently show more consistent behaviour as they only contribute to the functionality of one pathway.
Data processing with Hill climbing
In this section we perform a more detailed biological validation of some of the results produced by the hill climbing method. As the next section will show we do not to repeat this analysis using the simulated or genetic algorithm methods, as the results are virtually identical.
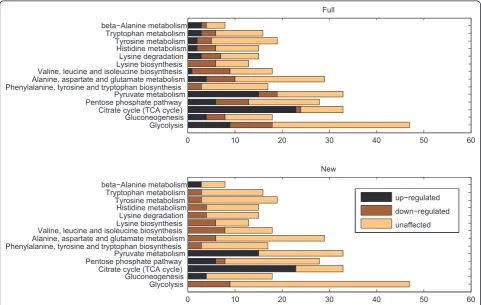
Figure 2 represents the result of applying the hill climbing search to process a popular dataset from dia-uxic shift experiments onSaccharomyces cerevisiae[27], for a set of biochemical pathways. Yeast cells inoculated in glucose rich medium turn to aerobic utilization of ethanol produced during fermentation, upon exhaustion of the available sugar. It is worth noting that KEGG includes both glycolysis and gluconeogenesis in one sin-gle pathway, as they share a number of common genes and a substantial part of each process is effectively a reversal of the other. Nevertheless, some genes are unique to glycolysis while others to gluconeogenesis and
the two are never functional simultaneously, thus the two pathways have been separated to improve the effi-ciency of our analysis.
The first allocation on Figure 2 (top) corresponds to changes occurring in the expression of genes following the diauxic shift and represents the pathway state observed when all multi-membership genes are consid-ered active in all pathways they participate in, according to commonly used visualisation approaches. Evidently, most pathways contain both up- and down-regulated genes. Pathways including Glycolysis, Gluconeogenesis, the Pentose phosphate pathway and Pyruvate metabo-lism contain similar numbers of both up- and down-regulated genes, which makes it difficult to infer their state.
As the second allocation on Figure 2 (bottom) reveals, processing of the data with our hill climbing method changes the picture substantially. As expected, upon depletion of glucose the glycolysis pathway is suppressed while expression is shifted in favour of gluconeogenesis. Rather than towards Pyruvate, reactions flow towards the biosynthetic precursor glucose-6-biphosphate which is channelled accordingly to supply the TCA cycle and
0 10 20 30 40 50 60
Glycolysis Gluconeogenesis Citrate cycle (TCA cycle) Pentose phosphate pathwayPyruvate metabolism Phenylalanine, tyrosine and tryptophan biosynthesisAlanine, aspartate and glutamate metabolism Valine, leucine and isoleucine biosynthesisLysine biosynthesis
Lysine degradation Histidine metabolism Tyrosine metabolism Tryptophan metabolism beta−Alanine metabolism
Full
0 10 20 30 40 50 60
Glycolysis Gluconeogenesis Citrate cycle (TCA cycle) Pentose phosphate pathwayPyruvate metabolism Phenylalanine, tyrosine and tryptophan biosynthesisAlanine, aspartate and glutamate metabolism Valine, leucine and isoleucine biosynthesisLysine biosynthesis
Lysine degradation Histidine metabolism Tyrosine metabolism Tryptophan metabolism beta−Alanine metabolism
New
up−regulated down−regulated unaffected
gluconeogenesis. The Pyruvate metabolism pathway contains only up-regulated genes, while amino acid metabolic pathways such as the valine, leucine, isoleu-cine and methionine biosynthetic pathways are clearly repressed, in agreement with [28]. This is to be expected given the caloric restriction as the production of methionine is costly from a metabolic point of view, while valine, leucine and isoleucine are the most abun-dant amino acids in the cell.
The unique up-regulated gene in the valine, leucine and isoleucine biosynthetic pathways, LEU4, has been reallocated to the Pyruvate metabolism of which it is also a member, a pathway positively affected during the diauxic shift in agreement with [27] and [28]. All down-regulated genes in gluconeogenesis have been allocated to glycolysis where they also participate. For the unique down-regulated gene ALD6 in the beta-alanine pathway, which the authors in [28] consider one of the 15 most positively affected pathways by the diauxic shift, our method implies that the observed down-regulation may well be due to involvement of the gene in other path-ways. This may be due to the involvement of ALD6 in glycolysis, phenylalanine, tyrosine, tryptophan biosynth-esis and other pathways exhibiting decreased activity.
Overall, the algorithm has been able to allocate genes to pathways in a way that allows us to infer the state of individual pathways with increased certainty removing contradictions from the final results. Pathways are now mostly filled with genes of similar expression, which we consider to be the most indicative of a pathway’s state.
To further investigate the results of data processing with our methodology we have applied it toEscherichia coli K-12 data from [29], available as experiment GSM513 at GEO. Escherichia colicells were grown in tryptophan enriched medium, leading to increased activ-ity of the tryptophan metabolism pathway. Most trypto-phan metabolism genes show subtle to substantial up-regulation except from yqeF which shows significant down-regulation (Table 6). Our method has removed the down-regulated gene from the latter pathway, ascribing its behaviour to the activity of other amino acid degradation pathways, which is biologically
meaningful, given that the cell is presented with excess tryptophan to partly cover its nutritional needs. In both cases discussed here, our method produces results that are consistent with the findings of the publications accompanying the data, while reducing the number of genes per pathway contradicting each other’s’expression and thus allowing us to infer the state of those pathways with higher degree of confidence. The ability of this kind of approach to produce such consistent results and to substantially increase gene expression agreement per pathway seems interesting in itself. It adds some further evidence to the initial hypothesis that multi-membership gene expression represents a net effect, in the sense that the biological system regulates the expression of these genes to accommodate its need through the adequate function of the pathway they participate in.
Statistical evaluation of functional agreement
In pathway based microarray analysis, to validate data quality and identify those pathways most affected by the experimental conditions, it is common practice to esti-mate the probability per pathway of observing as many or more differentially expressed genes purely by chance. For example, in [28] the authors describe Pathway Pro-cessor, a tool that can be used to score biochemical pathways according to the probability that as many or more genes in a pathway would be significantly altered in a certain experiment by chance alone. Pathways accompanied by very low probability are considered more likely to be affected by the experimental conditions.
Similar approaches have been adopted to identify interesting groupings produced by cluster analysis of gene expression data. In [30] the authors use the hyper-geometric distribution for the categorisation produced by clustering, to model the probability of observing at least kgenes from a cluster of size n in a category of sizeCfrom a total genome size ofGgenes. In this way they obtain p-values (equation 10), allowing them to examine if a cluster is enriched with genes from a parti-cular functional category to a greater extent than would be expected by chance. Clusters in which the majority of genes belong to a certain category produce low prob-ability withp-values near 0.
p= 1−
k−1
i=0
C i
G−C n−i
G n
(10)
We have applied a similar approach to a microarray dataset, consisting of experiments from GEO platform 17 [31], to compare the probability of the standard full membership gene allocation to the probability of Table 6 Log2 ratios of tryptophan metabolism genes, for
experiment GSM513
Gene Symbol Log2 ratio Gene Symbol Log2 ratio
atoB 1.1150 trpS 5.8490
yqeF -1.8120 katE -0.4370
fadB 2.6340 katG 1.4110
sucA 1.8200 tynA -0.7870
tnaA 1.4660
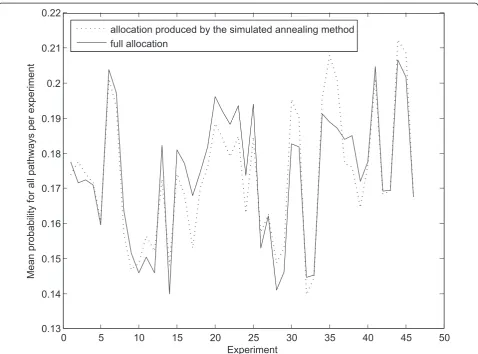
observing the allocations produced by processing of the data with the described algorithms. For our purposes, given the overall number of genes and the overall num-ber of affected genes on the array, we obtain the prob-ability of observing at least as many or more affected genes in a pathway of a certain size, purely by chance. Figure 3 shows the mean probability of obtaining the results in hand, per experiment. Evidently, there is no substantial change in probability, between our and the full membership allocation. However, our methodology adds an intuitional, biologically meaningful step to the analytical process.
Methods’Performance on pathway manipulation
The result of implementing the hill climbing, simulated annealing and genetic algorithm to a set of 46 microar-ray experiments from GEO platform GPL17 is shown on Figure 4. Interestingly, all methods seem to perform quite similarly in terms of fitness. In most cases the
simulated annealing approach is able to reach slightly higher fitness values. However, the difference is only subtle with a two sample t-test revealing no significant difference between the values corresponding to each search method. This is summarised on Table 7, which shows the mean of the minimum, maximum and mean fitness reached for the entire set of 46 experiments, upon ten separate runs of each method.
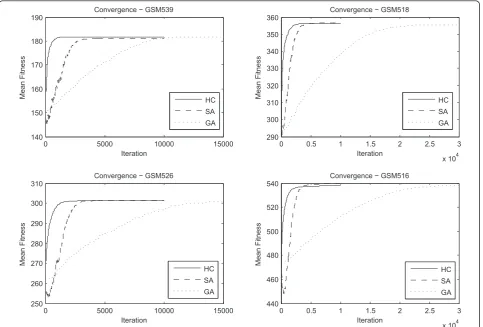
Figure 5 represents a visualisation of the Convergence of each optimisation method for a subset of four micro-array experiments. The experiments were chosen based on the mean fitness reached by 10 separate runs of each search approach, in order to exemplify the entire range of fitness values reached for GPL17. In particular the mean fitness values reached for each experiment where sorted in ascending order. GSM539 corresponds to the lower mean fitness reached for an experiment in the dataset, GSM516 to the highest mean fitness and GSM526 and GSM518 to values equally distanced from
0 5 10 15 20 25 30 35 40 45 50
0.13 0.14 0.15 0.16 0.17 0.18 0.19 0.2 0.21 0.22
Experiment
Mean probability
for all pathways per experiment
allocation produced by the simulated annealing method full allocation
these two extremes. Evidently, the genetic algorithm approach is slower than the other methods, requiring a significantly larger number of fitness calls to converge. The hill climbing and simulated annealing methods are roughly equally efficient, with the hill climbing being slightly faster, while the simulated annealing being able to reach slightly higher fitness values, in experiments with large number of expressed multi-membership genes and thus larger search space. Naturally, as the search space grows larger, due to a larger number of expressed multi-membership genes or growing number of pathways to which such genes can be assigned, the algorithms require more iterations to converge.
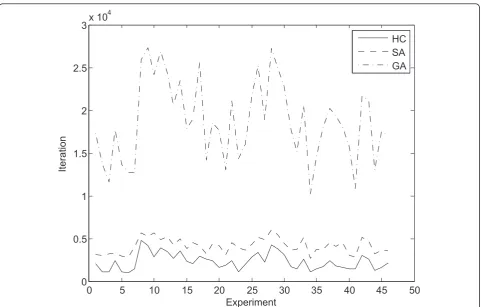
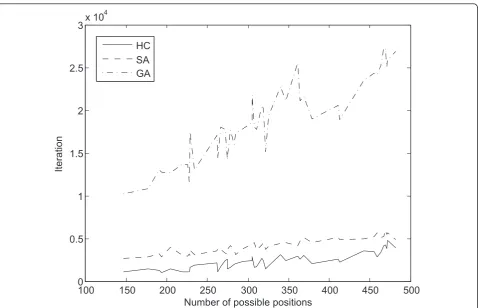
Figure 6 shows the mean number of iterations required for the algorithms to converge, while Figure 7 represents the same data in an ordered fashion from the
experiment with the least number of expressed multi-membership genes and possible positions for gene allo-cation to the experiment with most such positions.
As expected, the mean fitness value also shows an increase as the number of allocations of genes to path-ways grows (Figure 8), with highly significant correlation value of 0.9769, 0.9777 and 0.9770 for the hill climbing, simulated annealing and genetic algorithm respectively. The number of allocations of genes to pathways is determined by the number of expressed genes and the number of pathways in which the expressed multi-mem-bership genes participate.
On the contrary, there is no significant correlation between the number of gene to pathways allocations and the mean hamming distance between allocations produced by subsequent runs of the three search algo-rithms, as shown on Figure 9. In this case we observe small correlation values of -0.2687, -0.4686 and -0.3559 for the hill climbing, the simulated annealing and genetic algorithm respectively.
The same is true for the FARI’s (Figure 10) where the correlation between the mean FARI per experiment and the number of possible multi-membership gene to path-way allocations is -0.0802, 0.0499 and 0.0308 for the hill climbing, simulated annealing and genetic algorithm
0 5 10 15 20 25 30 35 40 45 50
150 200 250 300 350 400 450 500 550 600
Experiment
M
ean
Fi
tness
g
HC SA GA
Figure 4Mean fitness reached by each method, per experiment for GPL17. The figure reveals the mean fitness reached by the hill climbing, simulated annealing and genetic algorithm methods per experiment, for 46 experiments corresponding to platform GPL17 from GEO.
Table 7 Mean of the minimum, maximum and mean fitness reached by each method for GPL17
Hill Climbing Simulated Annealing Genetic Algorithm Max. Min. Mean Max. Min. Mean Max. Min. Mean 357.5 354.0 356.1 359.0 355.0 357.4 357.8 353.9 356.1
respectively. Nevertheless, FARI values are extremely high for allocations produced by separate runs of each of the search techniques, as summarised on Table 8.
The minimum FARI observed is 0.902, and the values remain high regardless of the observed variation in ham-ming distance. For example the mean FARI for pairs of allocations of hamming distance above 1 standard devia-tion is 0.964, 0.962 and 0.963 for the hill climbing, simu-lated annealing and genetic algorithm respectively. Based on this observation we can assume with sufficient degree of confidence that in cases of pairs of allocations, exhibit-ing substantial hammexhibit-ing distance, groups of genes have still been allocated together, in the same pathway, thus the FARI values are high. However, the pathways have been swapped, explaining the higher hamming distance values.
Work on KEGG modules
While the results discussed in the data processing with hill climbing section seem biologically meaningful, a cer-tain issue arises that is worth consideration. In
particular, it can be argued that since a gene can be assigned to any of its member pathways without removal from another, the allocation in the case of each individual pathway does not affect the rest. In that sense one can examine each pathway in isolation, considering the majority of genes, in terms of up- and down-regula-tion. In this case the maximisation problem is reduced to a few simpler maximisation problems whose solutions can then be combined.
This approach, however, has its own drawbacks which need to be considered. Importantly, it is not possible to apply this rationale in cases where up and down-regu-lated genes are present in equal or even similar numbers in a pathway, such as the case of gluconeogenesis and the pentose phosphate pathway in the discussed diauxic shift experiment. In fact, examining the dataset from GPL17 discussed in the methods performance on path-ways section we observed that this situation occurs in four pathways on average in each experiment. Further-more, the condition that a gene cannot be removed
0 5000 10000 15000
140 150 160 170 180
190 Convergence − GSM539
Iteration
Mean Fitness HC
SA GA
0 0.5 1 1.5 2 2.5 3
x 104 290
300 310 320 330 340 350
360 Convergence − GSM518
Iteration
Mean Fitness HC
SA GA
0 5000 10000 15000
250 260 270 280 290 300
310 Convergence − GSM526
Iteration
Mean Fitness
HC SA GA
0 0.5 1 1.5 2 2.5 3
x 104 440
460 480 500 520
540 Convergence − GSM516
Iteration
Mean Fitness
HC SA GA
from all its pathways cannot be met. By implementing the removal of the genes from each pathway that con-tradict the expression of the majority, we have observed that, on average, about 30 genes remain unassigned, cor-responding to about 20% of all expressed multi-mem-bership genes per experiment. Importantly, in algorithm 1, whenever this situation occurs the gene is reassigned to a pathway.
Nevertheless, the initial argument bears merit, thus we proceeded further to refine the proposed algorithmic approach. In particular, we implemented a search work-ing with KEGG modules rather than pathways, that is, sub-networks which represent chains of events, leading to gradual alteration of a substrate into a desired pro-duct. In essence a module is still a pathway, where we zoom in to look into a particular sequence of biochem-ical reactions, such as the case of KEGG module M00003, representing gluconeogenesis, which forms part of the KEGG Glycolysis/gluconeogenesis pathway.
One clear advantage of working with modules is that here, in principal we expect proteins forming the mod-ule to show agreement in terms of activity, which when reflected on their respective gene expression should pro-duce more consistent results in terms of up- or
down-regulation than in the case of genes forming entire KEGG pathways.
In addition, here we can disallow allocation of expressed genes to modules of opposing nature. For example, the Glycolysis KEGG module M00001 gradu-ally breaks down glucose to pyruvate, producing energy. In contrast, the gluconeogenesis module M00003 is responsible for the synthesis of glucose from precursors such as pyruvate. While KEGG includes glycolysis and gluconeogenesis in a single pathway due to the large number of genes shared by both, they are not simply the reverse of each other. Moreover, the two modules act in opposing directions and are not activated together as this would lead to a futile cycle [32], as previously mentioned. The same applies to amino acid and other biosynthetic and degradation modules, such as leucine, lysine and acylglycerol biosynthesis and degradation.
Hence, we have modified the algorithm to allow allo-cation of expressed genes shared by modules of
oppos-ing nature, which in the case of Saccharomyces
cerevisiae applies to about 14% of multi-membership genes, to only one of these modules at any particular instance. For example whenever an up-regulated gene is
assigned to glycolysis, it is removed from
0 5 10 15 20 25 30 35 40 45 50
0 0.5 1 1.5 2 2.5
3x 10
4
Experiment
Iteration
HC SA GA
gluconeogenesis, as long as it is a member of both mod-ules. We implement this at step 11) of Algorithm 1, opt-ing for simulated annealopt-ing, previously discussed. In the following sections we present the results of implement-ing this approach, to which we shall refer as module algorithm, based on a number of microarray experi-ments. We have examined the performance of the search starting from random allocations and concentrate on results characterised by high fitness values for biolo-gical interpretation.
KEGG modules results
The module algorithm, not allowing gene allocation to modules of opposing nature, was applied to 21 microar-ray experiments obtained from GEO, characterised by sufficient numbers of expressed genes and presence of genes of contradicting behaviour in the same modules. The datasets were also selected based on the experimen-tal conditions, whose nature allows us to comment on the obtained results. Importantly, upon processing the presence of contradicting genes was reduced by 50% on average with standard deviation of about 7%. Following is a discussion of results produced by applying this
approach to the aforementioned experiments, concen-trating on modules where genes appear to contradict each other state of expression, especially where genes are subject to reallocation.
In GSM1075, from [33], microarray data corresponds to total RNA extracted from yeast cells subjected to ade-nine starvation, after 30 minutes. As observed upon pro-cessing of the data (Figure 11), the search has identified the adenine biosynthesis module as activated, while gua-nine biosynthesis appears supressed. We also obtain an indication that pyrimidine ribonucleotide and deoxyribo-nucleotide biosynthesis is supressed as the algorithm has removed up-regulated genes from the modules. At the same time glycolysis appears repressed as opposed to gluconeogenesis which has been activated.
In GSM845 yeast cells subjected to starvation, after 12 hours, exhibit activation of gluconeogenesis and sup-pression of glycolysis. As expected the search has removed genes from biosynthetic modules while degra-dation of amino acids appears activated in the case of lysine and leucine (Figure 11).
In GSM876 from the same dataset, RNA is examined 12 hours after nitrogen depletion. The researchers
100 150 200 250 300 350 400 450 500
0 0.5 1 1.5 2 2.5
3x 10
4
Number of possible positions
Iteration
HC SA GA
100 150 200 250 300 350 400 450 500 150
200 250 300 350 400 450 500 550 600
Experiment
Mean Fitness
HC SA GA
Figure 8Mean fitness per experiment and method, according to search space. As the size of the search space grows, following the number of possible genes to pathways allocations, the methods are able to reach higher fitness values.
100 150 200 250 300 350 400 450 500
2 4 6 8 10 12 14
Number of possible positions
Mean Hamming Distance
%
HC SA GA
comment on the repressive effect of the conditions on the cluster of glycolytic genes. Indeed our algorithm has produced an allocation where Glycolysis is clearly supressed while gluconeogenesis seems in the process of activation, along with the glyoxylate cycle module (Fig-ure 11). Nucleotide biosynthetic modules appear supressed. Results are similar one, two and three days after depletion (GSM877, 878 and 879, data not shown).
In another dataset that deals with the global response of yeast, in terms of gene expression, to glucose addition (2 g/l pulse, 15min) in the growth medium, application of the search algorithm to data corresponding to 15min
following the pulse, produces allocations where up-regu-lated genes have been assigned to glycolysis (Figure 11). In contrast gluconeogenesis appears supressed in agreement with biological rationale. The same pattern is apparent after 20, 30, 45, 90 and 120 minutes as well as following a 0.2 g/l pulse, after 10, 15 and 20 min and in GSM 990 where glucose is once again added to the growth medium.
In contrast in GSM 290980 where RNA extracted from cells with no glucose in the medium after 2 hours are compared to cells with glucose, the search ade-quately assigns up-regulated genes to gluconeogenesis while down-regulated genes are allocated to glycolysis. As Figure 11 and reveals, the algorithm has reallocated a number of up-regulated genes from biosynthetic mod-ules which is a sensible result given the condition of carbon starvation. The Entner-Doudoroff pathway which is another chain of reactions for the catabolism of glu-cose also appears repressed, while the leucine and lysine degradation modules are clearly activated. The picture is virtually identical after 4 hours of glucose starvation.
Module algorithm performance
Naturally, it is worth examining the relative perfor-mance of the search based on modules, as in the case of
100 150 200 250 300 350 400 450 500
0.94 0.95 0.96 0.97 0.98 0.99 1
Number of possible positions
Mean FARI
HC SA GA
Figure 10Mean FARI between allocations per experiment, according to number of possible genes to pathways allocations. For the FARI values between allocations produced by subsequent runs of each method there is no correlation whatsoever with the size of the search space, as defined by the number of possible multi-membership genes’allocations.
Table 8 FARI statistics between allocations produced by 10 separate runs of each search method
Maximum Minimum Mean Standard Deviation Hill Climbing 1.000 0.928 0.978 0.012
Simulated Annealing
1.000 0.902 0.977 0.013
the pathway search algorithms. Figure 12 shows the convergence of the module algorithm for four experi-ments based on the mean fitness reached by 10 separate runs of the search approach, in order to exemplify the entire range of fitness values.
As previously observed the, the mean number of itera-tions required for the algorithm to converge exhibits significant correlation of 0.9419 to the number of possi-ble gene allocations (Figure 13), as does the mean fitness with correlation of 0.9616 (Figure 14). At the same time,
0 5 10 15
Glycolysis,core GluconeogenesisUrea cycle Adenine nucleotide biosynthesis Guanine nucleotide biosynthesis Pyrimidine ribonucleotide biosynthesis Pyrimidine deoxyribonuleotide biosynthesis
Full
0 5 10 15
0
Processed
0 5 10 15 20
Glycolysis Gluconeogenesis PPP,oxidative phaseTCA cycle,first TCA cycle,second Methionine salvage pathway Histidine biosynthesis,PRPPLysine degradation,lysine
Methionine salvage pathwayLeucine degradation,leucine Adenine nucleotide biosynthesis Guanine nucleotide biosynthesis Pyrimidine ribonucleotide biosynthesisFatty acid biosynthesis,initiation Polyamine biosynthesis,spermidineNucleotide sugar biosynthesis
0 5 10 15 20
0
0 5 10 15
Glycolysis Gluconeogenesis PPP,oxidative phase Entner−Doudoroff pathwayGlyoxylate cycle Methionine salvage pathway Adenine nucleotide biosynthesis Guanine nucleotide biosynthesis
0 5 10 15
0
0 5 10 15
Glycolysis GluconeogenesisGlyoxylate cycle Methionine biosynthesis Lysine degradation,lysine Leucine degradation,leucine Guanine nucleotide biosynthesisCholecalciferol biosynthesis
0 5 10 15
0
0 5 10 15
Glycolysis Gluconeogenesis PPP,oxidative phaseTCA cycle,first Leucine biosynthesis,pyruvateAcylglycerol degradation Lysine degradation,lysine Leucine degradation,leucine Adenine nucleotide biosynthesis Guanine nucleotide biosynthesisCholecalciferol biosynthesis Inosine monophosphate biosynthesis
0 5 10 15
0
GSM1075 GSM1075
GSM845 GSM845
GSM876 GSM876
GSM94989 GSM94989
GSM290980 GSM290980
there is no significant correlation (0.2265) between the number of genes to modules allocations and the mean hamming distance between allocations produced by sub-sequent runs of the search, as exhibited on Figure 15. This situation is similar to what we observed working with KEGG pathways in the preceding sections.
The same applies to the mean FARI’s, where the cor-relation between the mean FARI per experiment and the number of possible multi-membership gene to mod-ule allocations is -0.3700 (Figure 16). Once again we observe extremely high FARI values for allocations pro-duced by separate runs of the search, with mean FARI of 0.9777 and standard deviation of only 0.0157. Impor-tantly, FARI remain high even for variable hamming dis-tances, which as in the case of gene to pathways
allocations suggests that in certain pairs of allocations, exhibiting substantial hamming distance, groups of genes have still been allocated together, in the same module, leading to high FARI values.
Conclusions
We have shown that our algorithms can effectively assign multi-membership genes to their constituent pathways and modules, increasing the level of agree-ment, in terms of the direction of expression in either case. Nevertheless, working with modules seems advan-tageous from both biological and analytical point of view. That is, genes in a module are expected to show more consistent behaviour, while the more detailed defi-nition of biochemical processes forming modules allows
0 200 400 600 800 1000
85 90 95 100
105 Convergence − GSM94996
Iteration
Mean Fitness
0 200 400 600 800 1000
230 240 250 260 270
280 Convergence − GSM95012
Iteration
Mean Fitness
0 200 400 600 800 1000
320 340 360 380 400 420
Iteration
Mean Fitness
Convergence − GSM864
0 200 400 600 800 1000
460 480 500 520 540 560
Iteration
Mean Fitness
Convergence − GSM290980
0 10 20 30 40 50 60 70 80 90 100 300
400 500 600 700 800 900 1000
Number of possible allocations
Iteration
Figure 13Mean convergence of module algorithm per experiment, according to search space size. Experiments are represented in an ordered fashion, from the one with least expressed membership genes, and smallest search space to the one with most expressed multi-membership genes and largest search space.
0 10 20 30 40 50 60 70 80 90 100
100 150 200 250 300 350 400 450 500 550 600
Mean Fitness
Number of possible allocations
20 40 60 80 100 120 140 160 180 200 220 6
8 10 12 14 16 18 20
Number of possible allocations
Mean Hamming Distance
%
Figure 15Mean hamming distance, according to number of possible genes to pathways allocations, for module algorithm. There appears to be very small correlation between the mean hamming distance of allocations produced by separate runs of the module search algorithm in terms of percentage and the size of the search space.
20 40 60 80 100 120 140 160 180 200 220
0.94 0.95 0.96 0.97 0.98 0.99 1
Number of possible allocations
Mean FARI
us to identify modules of opposing nature. In such cases we restrict allocation of the same expressed genes to both processes.
The methodology is of potential interest, in the effort to infer the state of individual pathways and modules based on microarray data analysis. It suggests an inter-esting direction for future work, as the multi-member-ship nature of genes has not been extensively considered as such in relevant research.
Interestingly, we have observed minimal variation in the performance of the three search approaches, namely the hill climbing, simulated annealing and genetic algorithm. All methods produce highly consis-tent results and reach roughly equal fitness values, although the simulated annealing approach does seem slightly superior. Furthermore, the consistency of the produced allocations in terms of Hamming distance and FARI values does not show any correlation to the size of the search space, as defined by the number of possible genes to pathways or modules allocations in each experiment.
A related issue that may be resolved following this approach is the observed swapping of piles of genes between pathways, by subsequent runs of the search algorithms. As discussed in the preceding sections, cer-tain groups of genes seem to be allocated to different biochemical processes, but still placed together by sepa-rate applications of the methods described here. There is room for further investigation in that respect.
An issue that requires more thorough investigation is the presence of genes, e.g. repressors, for which it is expected to observe change in expression that contra-dicts the up- or down-regulated state of the pathway they are members of. While our methods can still pro-duce meaningful results, since this is confined to indivi-dual cases, especially when modules are used for the analysis, we plan to tackle this issue by improving our fitness function, taking into account the behaviour of suppressors and facilitating a more detailed pathway categorisation, for example using the Reactome database.
It is worth noting that the methodology has been applied toEscherichia coliandSaccharomyces cerevisiae
which are relatively simple living forms. According to KEGG statistics, the number of protein genes found in
Escherichia coli K-12 is 4149 with 1397 of them allo-cated to biochemical pathways. In contrast, a human cell encloses 25724 protein genes, 5283 of which have currently been allocated to 198 KEGG pathways. Due to the resulting larger search space the methodology dis-cussed here is likely to generate greater reshuffling in the results produced upon processing of microarray data from such more sophisticated organisms.
Finally, an appealing direction for future work would be the use of the proposed approach on a large dataset, consisting of thousands of microarray experiments to infer the state of individual pathways in terms of activa-tion and subsequently apply associaactiva-tion rules mining between biochemical processes in an effort to elucidate pathway regulation and interaction.
Acknowledgements
This research was supported by the studentship scheme of the School of Information Systems, Computing and Mathematics, Brunel University, UK.
Authors’contributions
All authors contributed to the development of the underlying concept; SP wrote the scripts and was the principal researcher; AP aided in
interpretation; SS aided software development. All authors read and approved the final manuscript.
Competing interests
The authors declare that they have no competing interests.
Received: 30 July 2009 Accepted: 22 September 2011 Published: 22 September 2011
References
1. Schena M, Shalon D, Davis R, Brown PO:Quantitative monitoring of gene expression patterns with a complementary DNA microarray.Science1995, 270:467-470.
2. Cavalieri D, Castagnini C, Toti S, Maciag K, Kelder T, Gambineri L, Angioli S, Dolara P:Eu.Gene Analyzer a tool for integrating gene expression data with pathway databases.Bioinformatics2007,23(19):2631-2632. 3. Kanehisa M, Goto S:Kyoto encyclopaedia of genes and genomes.Nucl
Acid Res2000,28:27-30.
4. Joshi-Tope G, Gillespie M, Vastrik I, D’Eustachio P, Schmidt E, de Bono D, Jassal B, Gopinath GR, Wu GR, Matthews L, Lewis S, Birney E, Stein L: Reactome: a knowledgebase of biological pathways.Nucl Acid Res2005, , 33 Database:D428-D432.
5. Rojas I, Golebiewski M, Kania R, Krebs O, Mir S, Weidemann A, Wittig U: SABIO-RK: a database for biochemical reactions and their kinetics.BMC Systems Biology2007,1(Suppl 1):S6.
6. Karp PD, Riley M, Paulsen IT, Collado-Vides J, Paley SM, Pellegrini-Toole A, Bonavides C, Gama-Castro S:The EcoCyc Database.Nucl Acid Res2002, 30(1):56-58.
7. Dahlquist KD, Salomonis N, Vranizan K, Lawlor SC, Conklin BR:GenMAPP, a new tool for viewing and analyzing microarray data on biological pathways.Nat Genet2002,31(1):19-20.
8. Shannon P, Markiel A, Ozier O, Baliga NS, Wang JT, Ramage D, Amin N, Schwikowski B, Ideker T:Cytoscape: a software environment for integrated models of biomolecular interaction networks.Genome Research2003,13(11):2498-504.
9. Goesmann A, Haubrock M, Meyer F, Kalinowski J, Giegerich R:PathFinder: reconstruction and dynamic visualization of metabolic pathways. Bioinformatics2002,18:124-9.
10. Kolpakov FA, Ananko EA, Kolesov GB, Kolchanov NA:GeneNet: a gene network database and its automated visualization.Bioinformatics1998, 14:529-537.
11. Toyoda T, Mochizuki Y, Konagaya A:GSCope: a clipped fisheye viewer effective for highly complicated biomolecular network graphs. Bioinformatics2003,19:437-8.
12. Panteris E, Swift S, Payne A, Liu X:Mining pathway signatures from microarray data and relevant biological knowledge.Journal of Biomedical Informatics2007,40(6):698-706.
13. Stryer L, Berg MJ, Tymoczko LJ:Biochemistry.5 edition. W.H 612 Freeman; 2002.
15. Greenbaum D, Colangelo C, Williams K, Gerstein M:Comparing protein abundance and mRNA expression levels on a genomic scale.Genome Biology2003,4(9):117.
16. Russo G, Zegar C, Giordano A:Advantages and limitations of microarray technology in human cancer.Oncogene2003,22:6497-6507.
17. Pavlidis S, Payne A, Swift S:An Improved Methodology for Pathway Based Microarray Analysis Based on Identification of Individual Pathways Responsible for Gene Regulation.IDAMAP2008, 69-74.
18. Russell SJ, Norvig P:Artificial Intelligence: A Modern Approach.2 edition. Upper Saddle River, NJ: Prentice Hall; 2003.
19. Kirkpatrick S, Gelatt CD Jr, Vecchi MP:Optimization by simulated annealing.Science1983,220:671-680.
20. Holland JH:Adaptation in Natural and Artificial Systems: An Introductory Analysis with Applications to Biology, Control, and Artificial IntelligenceAnn Arbor, MI: University of Michigan Press; 1975.
21. Brouwer RK:Extending the rand, adjusted rand and jaccard indices to fuzzy partitions.Journal of Intelligent Information Systems2009,32:213-235. 22. Blattner FR, Plunkett G, Bloch CA, Perna NT, Burland V, Riley M,
Collado-Vides J, Glasner JD, Rode CK, Mayhew GF, Gregor J, Davis NW, Kirkpatrick HA, Goeden MA, Rose DJ, Mau B, Shao Y:The Complete Genome Sequence ofEscherichia coliK-12.Science1997, 277(5331):1453-1462.
23. Michalewicz Z, Fogel DB:How to solve it: Modern heuristicsBerlin: Springer; 1998.
24. Hamming R:Error Detecting and Error Correcting Codes.Bell System Technical Journal1950,26(2):147-160.
25. Barrett T, Troup DB, Wilhite SE, Ledoux P, Rudnev D, Evangelista C, Kim IF, Soboleva A, Tomashevsky M, Edgar R:NCBI GEO: mining tens of millions of expression profiles–database and tools update.Nucleic Acids Res2006, ,35 Database:D760-D765.
26. Gene Expression Omnibus:Platform GPL3503.[http://www.ncbi.nlm.nih. gov/geo/query/acc.cgi?acc=GPL3503].
27. DeRisi JL, Iyer VR, Brown PO:Exploring the metabolic and genetic control of gene expression on a genomic scale.Science1997,278:680-686. 28. Grosu P, Townsend JP, Hartl DL, Cavalieri D:Pathway processor: a tool for
integrating whole-genome expression results into metabolic networks. Genome Res2002,12:1121-1126.
29. Khodursky AB, Peter BJ, Cozzarelli NR, Botstein D, Brown PO, Yanofsky C: DNA microarray analysis of gene expression in response to physiological and genetic changes that affect tryptophan metabolism inEscherichia coli.PNAS USA2000,97:12170-12175.
30. Swift S, Tucker A, Vinciotti V, Martin N, Orengo C, Liu X, Kellam P: Consensus clustering and functional interpretation of gene-expression data.Genome Biology2004,5:R49.
31. Gene Expression Omnibus:Platform GPL17.[http://www.ncbi.nlm.nih.gov/ geo/query/acc.cgi?acc=GPL17].
32. Champe PC, Harvey RA, Ferrier DR:Lippincotts Illustrated Reviews Biochemistry.3 edition. Lippincott reverend & adventurer; 2004. 33. Gasch AP, Spellman PT, Kao CM, Carmel-Harel O:Genomic expression
programs in the response of yeast cells to environmental changes.Mol Biol Cell2000,11(12):4241-4257.
doi:10.1186/1748-7188-6-22
Cite this article as:Pavlidiset al.:Multi-membership gene regulation in pathway based microarray analysis.Algorithms for Molecular Biology2011
6:22.
Submit your next manuscript to BioMed Central and take full advantage of:
• Convenient online submission
• Thorough peer review
• No space constraints or color figure charges
• Immediate publication on acceptance
• Inclusion in PubMed, CAS, Scopus and Google Scholar
• Research which is freely available for redistribution